
CCHP Load Calculations
Abstract
Keywords
Load calculators
climate
weather data
CCHP
5.1. Introduction
After making a decision about the component types for the CCHP system, component sizing is the next design step. Apart from the choice of sizing method, the consumer demands or loads play the most important role in the sizing of components. Therefore, determining consumer demands is an essential step in designing a CCHP system. Different sizing methods may use different load information, and they can be classified as follows:
• Single number method (SNM): Some methods only use yearly peak loads of electricity, cooling, heating, and DHW demands. Therefore, in this case only one number is available for each load type as the input data for the sizing method.
• 288 number method (TNM): Some methods may use a 24-hour average load calculation for each month. In these methods 12 sets of 24-hour data (12 × 24 = 288 numbers for each load type) will be available as input data for sizing the CCHP components.
• 8760 number method (ENM): Some methods may use hourly load calculations during the whole year. Therefore, in these methods 365 × 24 = 8760 numbers are available for each load type as input data for the sizing method.
SNM is simple to calculate and can be considered a rough estimation method for sizing and initial capital costs. This method does not give detailed information about fuel consumption, cost, overall efficiency, and environmental benefits. Moreover, since in these methods every component is designed according to the peak loads, the components may be oversized.
TNM is more accurate than SNM. But this method does not trace load changes during a month because it gives only 24 numbers corresponding to 24 hours for each month (in other words it considers all days of each month the same). The accuracy of results in this method suffers from lack of daily information during month.
ENM is the most currently accurate available load calculation method, because it calculates the loads for every hour during a year. Calculation of fuel consumption, fuel savings, economic evaluations, etc., is much more accurate than SNM and TNM. The impact of load variation on the economic, thermodynamic, and environmental criteria can be investigated precisely.
5.2. Weather Information
In order to calculate the electricity, heating, cooling, and DHW loads of a consumer, it is important to know the building orientation, construction materials of the building and their characteristics, altitude, latitude, longitude, number of occupants, presence time and schedule, activity type, lighting type, lighting index per square meter, electricity consumers, and corresponding heat generation. In addition, having the daily/hourly average value of the last 5 to 10 years of dry bulb temperature and relative humidity of the ambient where the consumer is located is essential. The wet bulb temperature, which some load calculators utilize for load estimations, can be calculated according to the dry bulb temperature and relative humidity.
The weather information of different locations is usually available on national metrological organization websites. In addition to the national websites some international websites exist that give weather information in most of locations around the world. Some of these websites are mentioned here:
http://www.weather-forecast.com
http://www.weather-forecast.com
The weather information and building characteristics can be used in the load calculator software to calculate the building demands.
A list of software that can be used for load calculations is introduced in the next section [1].
5.3. Load Calculators
The following software is used for load calculations in determining the electiricty, cooling, heating, and DHW demands of a consumers:
AIRWIND Pro
BTU Analysis Plus
BTU Analysis REG
BV2
CAMEL
CBE UFAD Cooling Design Tool
CHVAC
CL4M Commercial Cooling and Heating Loads
Climawin 2005
CoDyBa
Cold Room Calc
COLDWIND Pro
COMFIE
Cool Room Calc
Curb
Cymap Mechanical
DesignBuilder
DeST
DPClima
E-Z Heatloss
ECOTECT
ENER-WIN
Energy Profiler
Energy Profiler Online
Energy Scheming
Energy Usage Forecasts
EnergyPlus
EnergySavvy
ESP-r
HAP
HAP System Design Load
HBLC
HEED
HOT2000
HVAC Residential Load Calcs – HD for the iPad
ISOVER Energi
J-Works
LESO-COMFORT
LESOCOOL
LESOKAI
LESOSAI
Load Express
Micropas6
PASSPORT
QwickLoad
RHVAC
Right-Suite Residential for Windows
RIUSKA
System Analyzer
Toolkit for Building Load Calculations
TOP Energy
TRACE Load 700
In the following a case study including five climates is presented to show the load calculation steps.
5.4. Load Calculation Example
In this book, in order to investigate the impact of climate on load calculations and CCHP design, an identical building is considered in five different climates presented in Table 5.1.
Table 5.1
Five Different Climates and Nominated Cities
| Climate | Nominated City |
| Tropical and dry in summer, cold in winter (TDC) | Kerman |
| Temperate and dry in summer, extremely cold in winter (TDEC) | Kamyaran |
| Temperate and humid in summer, cold in winter (THC) | Bandar-Anzali |
| Tropical and humid in summer, temperate in winter (THT) | Chabahar |
| Tropical and semi-humid in summer, temperate in winter (TSHT) | Ahwaz |
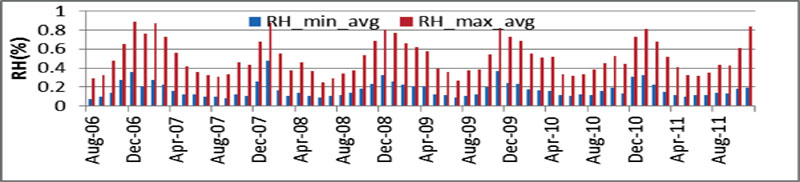
It is important to mention that considering nominated cities from Iran is just due to the authors’ familiarity with these climates and availability of weather information. This method of decision-making, design, and optimization is completely general and can be applied to any other city or climates around the world. To start the analyses, the daily weather information from the beginning of August 2006 to the end of July 2011 of the five cities is gathered from the available archive at the Iran Metrological Organization website [2]. The information includes the daily maximum and minimum of dry bulb temperature (Tdb) and relative humidity (RH). The monthly average of the Tdb and RH for the five years is calculated, and finally the average of Tdb,min, Tdb,max, and RH of each specific month during the five years is determined. The five-year averages of Tdb and RH at the atmospheric pressure are used in the engineering equation solver (EES) to determine the corresponding wet bulb temperature (Twb). The weather information for Kerman is presented in Figures 5.1 to 5.5 as examples but the results of other cities are presented in appendix 1 in Figures A1.1 to A1.12.


In the simulations presented in the next chapters, knowing the hourly temperature is necessary. The hygrometric data reported above are curve fitted using the MATLAB curve-fitting tool for each climate. The equations for Tdb,min and Tdb,max for the five climates are given in Eqs. (5-1) to (5-5). In these equations N is the day number starting from N = 1 for January 1st to N = 365 at the end of year. In order to calculate the hourly temperature for each day Erbs’s model [3] is utilized (Eq. 5-6). This equation calculates the hourly temperature during each day according to the Tdb,min and Tdb,max of the corresponding day.
In the mathematical simulations for every climate and city such curve fittings can be done and the equation can be used in the simulation.
 (5-1)
(5-1)
 (5-2)
(5-2)
 (5-3)
(5-3)
 (5-4)
(5-4)
 (5-5)
(5-5)
 (5-6)
(5-6)where HR is the hour from 1 to 24. It is worth mentioning that most of load calculators have the weather information for some sample cities in their database. If the city in which the CCHP is to be designed is included in the database of the load calculator software, there is no need to collect weather information and this step can be skipped.
After determining the weather data, specifying the building’s characteristics is essential to calculate the cooling and heating loads of the building.
The cooling and heating loads of a building have direct impact on the size of cooling and heating systems, and indirect impact on the size of the power generation unit. This is due to the heat recovery of energy loss in the prime mover of CCHP systems, which is responsible for providing all or part of the heating or cooling loads. Therefore, paying more attention to the heating and cooling load calculations is highly recommended because they can change the size of every component in CCHP systems.
The authors are aware that buildings should be constructed according to the climate. However, in the case study presented in this text, in order to show the impact of climate difference on the design results of CCHP systems, an identical, hypothetical, four-floor, eight-unit residential building with a total living area of 1200m2 is considered. The specifications of the building are described in the following.
The average ceiling height and building weight are 2.7 m and 468.7 kg/m2, respectively. The walls are medium weight with an overall U-value of 1.53 W/(m2.K). The overall U-values of floors above the unconditioned and conditioned spaces are 0.568 W/(m2.K) and 2.839 W/(m2.K), respectively. Each floor has 14 double-glazed windows of the 6 mm argon gap type, and each one has 2 × 2 (m) area. The total number of occupants is 32 people. The lighting is of the free-hanging fixture type with wattage of 20 W/m2 and a ballast multiplier of 1.25. The building is simulated in HAP and the cooling and heating loads are determined according to the TNM load calculation (12 sets of 24-hour data).
The magnitude and distribution of electricity consumption have a great impact on the design results for a CCHP system. Therefore the electricity consumers of the building for which the CCHP is designed should be identified, and their electricity consumption should be determined according to the nameplates of the consumers. An approximate consumption schedule listing the electricity consumers also should be considered during weekdays, weekends, holidays, etc.
The main electricity consumers and the corresponding power consumptions are as follows[4-6]. The lighting index is 20 W/m2, an LCD TV uses 160 W, a washing machine uses 2500 W, a refrigerator uses 130 W, a computer uses 250 W, a cloth iron uses 1000 W, and a vacuum cleaner uses 1000W. A demand factor of 0.76 is considered for the consumers. In addition, the power consumption of the water pump and the chiller’s solution pump (sp) and refrigerant pump (rp) are also calculated according to the cooling and heating loads as follows [7]:
 (5-7)
(5-7)The home appliances considered above are for a typical residential building. It is evident that for every particular building type (commercial, residential, industrial, educational, etc.) different electricity consumers may be defined. For example the electricity consumers of a residential building are very different with respect to a commercial, official, educational, or industrial building. Therefore for every building type, according to the electricity consumers’ type, size, and operation schedule, an electricity consumption distribution can be defined.
In addition to the heating, cooling, and electricity loads, in most building types, especially in the residential sector, preparing domestic hot water (DHW) is of great importance. In order to determine the magnitude and distribution of the DHW load, the hot water consumers, approximate consumption flow rate, and schedule should be determined.
The main DHW consumers and corresponding consumption time are presented in Table 5.2 for the residential building considered in the case study [8].
Table 5.2
DHW Consumers for the Typical Residential Building
| Consumer | Flow Rate (liter/min) | Consumption Time in 24 Hours per Person (min) for Spring and Summer | Consumption Time in 24 Hours per Person (min) for Autumn and Winter |
| Shower | 6.3 | 30 | 22.5 |
| Bath | 1.26 | 30 | 22.5 |
| Toilet and hand basin | 0.2 | 20 | 20 |
| Dish washing Sink in kitchen | 0.95 | 30 | 30 |
| Sink for foot washing | 0.2 | 10 | 5 |

The building demands, including the cooling (C), heating (H), domestic hot water (D), and electricity (E), are reported in Figures 5.6 to 5.10 . These data will be used in the following chapters to design the CCHP system.


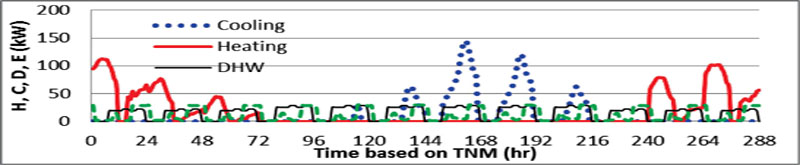
As can be seen, the cooling and heating load distribution and magnitude are completely different in the five climates. For example, Chabahar needs cooling during the whole year, while no heating is required. Ahwaz receives the maximum cooling load in summer, and it needs a slight amount of heat in some months. Load distributions for Kamyaran and Kerman are approximately the same, but the peak loads of Kamyaran are larger than Kerman. The cooling loads of Kamyaran and Bandar-Anzali are approximately the same, but the heating load of Kamyaran is approximately two times greater than Bandar-Anzali. These differences reveal that the size of CCHP system would be probably different in different climates, and attention must be paid to the load calculations in different climates before designing CCHP systems.
5.5. Problems
1. Provide the last five years of weather data for the city you live in and calculate the average data for the load calculations.
2. Consider a residential or commercial building in your region and calculate the electrical, heating, cooling, and DHW demands for that building.
3. Compare your calculations in Problem 2 with the available energy bills.
4. Curve fit the data you provided in Problem 2.