Appendix
Figure A1.1 Dry bulb temperature over five years for Ahwaz.
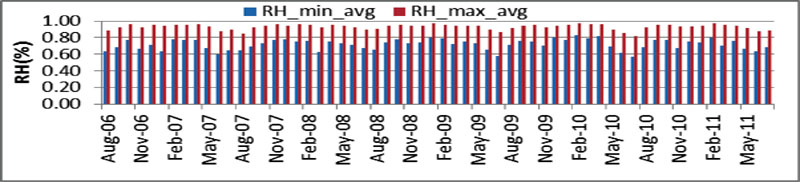
Figure A1.2 Relative humidity over five years for Ahwaz.
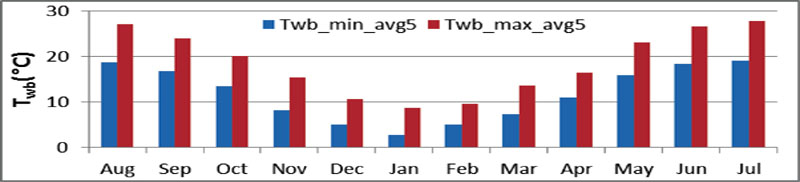
Figure A1.3 Twb of Ahwaz based on five-year average of RH and Tdb .
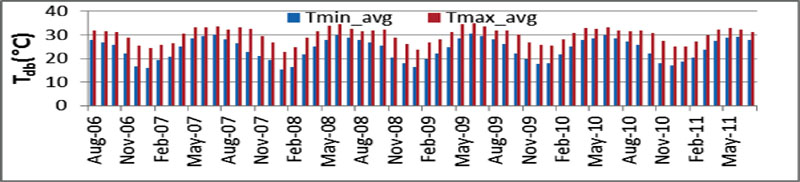
Figure A1.4 Dry bulb temperature over five years for Chabahar.
Figure A1.5 Relative humidity over five years for Chabahar.
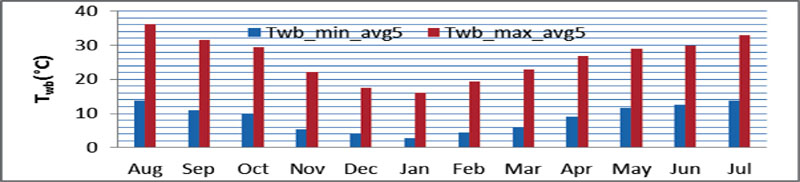
Figure A1.6 Twb of Chabahar based on five-year average of RH and Tdb .
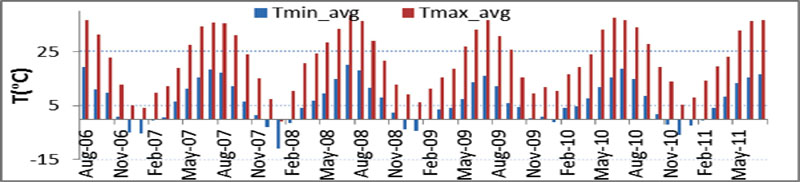
Figure A1.7 Dry bulb temperature over five years for Kamyaran.
Figure A1.8 Relative humidity over five years for Kamyaran.
Figure A1.9 Twb of Kamyaran based on five-year average of RH and Tdb .
Figure A1.10 Dry bulb temperature over five years for Bandar-Anzali.
Figure A1.11 Relative humidity over five years for Bandar-Anzali.
Figure A1.12 Twb of Bandar-Anzali based on five-year average of RH and Tdb .
Appendix 2
Technical input data to the code:
η pp η g η b FCU wh η CHP COP abc T 0 = 15°C , T hg C , T oil C , T jacketing C , T exhaust C , Q oil Q rec Q jacketing Q rec Q exhaust Q rec T room,sum C , T room,win C , T db,sum,Kerman C , T db,win,Kerman C , T db,sum,Ahwaz C , T db,win,Ahwaz C , T db,sum,Bandar Anzali C , T db,win,Bandar Anzali C , T db,sum,Chabahar C , T db,win,Chabahar C , T db,sum,Kmayaran C , T db,win,Kmayaran C , LAT Kerman LAT Ahwaz LAT Bandar Anzali LAT Chabahar LAT Kamyaran NOU = 8
Environmental input data:
i 0 C O , P = 4 i C O , P 0 = 4 i 0 C O , C = 0.1274 / C O P a b c i C O , C 0 = 0.1274 / C O P a b c i 0 C O , H = 0.1274 i C O , H 0 = 0.1274 i 0 C O , D = 0.1274 i C O , D 0 = 0.1274 i 0 C O 2 , P = 700 i C O 2 , P 0 = 700 i 0 C O 2 , C = 182 .04 / C O P a b c i C O 2 , C 0 = 182 .04 / C O P a b c i 0 C O 2 , H = 182 .04 i C O 2 , H 0 = 182 .04 i 0 C O 2 , D = 182 .04 i C O 2 , D 0 = 182 .04 i 0 N O X , P = 300 i N O X , P 0 = 300 i 0 N O X , C = 0.1532 / C O P a b c i N O X , C 0 = 0.1532 / C O P a b c i 0 N O X , H = 0.1532 i N O X , H 0 = 0.1532 i 0 N O X , D = 0.1532 i N O X , D 0 = 0.1532 i 1 C O , P = 0.8 i C O , P 1 = 0.8 i 1 C O , C = 0.1274 / C O P a b c i C O , C 1 = 0.1274 / C O P a b c i 1 C O , H = 0.1274 i C O , H 1 = 0.1274 i 1 C O , D = 0.1274 i C O , D 1 = 0.1274 i 1 C O 2 , P = 430 i C O 2 , P 1 = 430 i 1 C O 2 , C = 182.04 / C O P a b c i C O 2 , C 1 = 182.04 / C O P a b c i 1 C O 2 , H = 182.04 i C O 2 , H 1 = 182.04 i 1 C O 2 , D = 182.04 i C O 2 , D 1 = 182.04 i 1 N O X , P = 0.7 i N O X , P 1 = 0.7 i 1 N O X , C = 0.1532 / C O P a b c i N O X , C 1 = 0.1532 / C O P a b c i 1 N O X , H = 0.1532 i N O X , H 1 = 0.1532 i 1 N O X , D = 0.1532 i N O X , D 1 = 0.1532
Economic input data (the currency of these data is USD):
i 0 E = 10.83 U S D i E 0 = 10.83 U S D
i 1 E = { 1.1 ( 1.534 × 10 17 E − 10.33 n o m + 866.4 ) , 1.1 × 1420 , 0 < E n o m < 25 25 ≤ E n o m ≤ 500 i E 1 = 1.1 ( 1.534 × 10 17 E n o m − 10.33 + 866.4 ) , 25 ≤ E n o m ≤ 500 1.1 × 1420 , 0 < E n o m < 25
I 1 O M = 1.1 ( E n o m × 3.3 × 10 − 5 + 26.5 ) I O M 1 = 1.1 ( E n o m × 3.3 × 10 − 5 + 26.5 ) i 0 C = i 1 C = ( − 35.4 log ( C n o m ) + 431 ) i C 0 = i C 1 = ( − 35.4 log ( C n o m ) + 431 )
i 0 H = i 1 H = ⎧ ⎩ ⎨ ⎪ ⎪ ( 1.38 × 10 9 H − 3.212 n o m + 9.39 ) ( 23.54 × H − 0.08598 n o m − 6.48 ) 9.74 , 0 < H n o m < 75.53 H n o m ≥ 464.8 75.53 ≤ H n o m < 464.8 i H 0 = i H 1 = ( 1.38 × 10 9 H n o m − 3.212 + 9.39 ) H n o m ≥ 464.8 ( 23.54 × H n o m − 0.08598 − 6.48 ) 75.53 ≤ H n o m < 464.8 9.74 , 0 < H n o m < 75.53
i s o l a r = 267 ( U S D / m 2 ) i s o l a r = 267 ( U S D / m 2 )
t s e = t b e = 0.1188 ( U S D / k W h ) t s e = t b e = 0.1188 ( U S D / k W h ) t g a s = 0.377 ( U S D / m 3 ) t g a s = 0.377 ( U S D / m 3 )


 is the engine cost per kW of electricity; the coefficient 1.1 is consideration for the heat recovery heat exchangers.