
CHAPTER 8
CHARACTERIZATION OF CONFORMATIONAL PATTERNS IN ACTIVE AND INACTIVE FORMS OF KINASES USING PROTEIN BLOCKS APPROACH
8.1 INTRODUCTION
The three-dimensional (3D) structure, which is critical for the function of a protein is usually conserved during evolution. It holds a wealth of information that can be harnessed to understand various aspects of proteins including sequence–structure–function–evolutionary relationships. The understanding of these complex relationships is facilitated by a simplistic one-dimensional (1D) representation of the tertiary structure like a string of letters.
The advantage is an easier visualization without losing much of the vital information due to dimension reduction. Using various methodologies, local structural patterns that can be combined to generate the desired backbone conformation have been identified that use atomic coordinates characterising 3D structures of proteins. Protein blocks (PBs) is a set of 16 such local structural descriptors, denoted by letters a… p that have been derived using unsupervised machine learning algorithms and can approximate the 3D space of proteins. Each letter corresponds to a pentapeptide with distinct values of eight dihedral angles (Φ,Ψ).
We demonstrate the use of PBs to characterize structural variations in enzymes using kinases as the case study. A protein kinase undergoes structural alterations as it switches to its active conformation from its inactive form. Crystal structures of several protein kinases are available in different enzymatic states. First, we have applied the PBs approach in distinguishing between conformation changes and rigid-body displacements between the structures of active and inactive forms of a kinase. Second, we have performed a comparison of conformational patterns of active forms of a kinase with the active and inactive forms of a closely related kinase. Third, we have studied the structural differences in the active states of homologous kinases. Such studies might help in understanding the structural differences among these enzymes at a different level, as well as guide in making drug targets for a specific kinase.
Section 8.1.1 and Section 8.1.2 give a brief introduction on PBs and protein kinases, respectively, followed by the analyses on conformational plasticity in kinases using PBs in the subsequent sections.
8.1.1 An Introduction to Protein Blocks
The tertiary structure of a protein is complex and is formed by a specific arrangement of regular secondary structures, namely, helices and strands connected by less regular coils. Combinations of secondary structures in specific arrangements, called motifs, are frequently observed in proteins and are associated with specific functions; EF hand and helix–turn–helix motifs are some of the examples. These motifs are patterns that can act as functional signatures. Although the three-state representation (α−helix, β−strand, and coil) has been used for various structural analyses, it suffers from certain limitations. The description lacks the detailed information on relative orientation of secondary structures and ambiguity in assigning their beginning and end and precise definition of distinct conformations that are collectively classified as coils. Thus, it fails to capture the subtle variations in structures of closely related proteins. In addition, it lacks the information required to reconstruct the backbone of a protein structure. The depth of knowledge gained through the analysis of 3D structures is partly dependant on the details and accuracy of the representation. The description of protein structures as secondary structural elements is an oversimplification. Therefore, elaborate local structures that can describe a protein structure more precisely have been derived without using any a priori information on 3D structures. The more detailed descriptors were to serve two purposes. First, a combination of these fragments, like building blocks, would be able to approximate the backbone conformation of known structures. The higher the number of these fragments in a library, the more precise is the description. Second, they would be useful in understanding sequence–structure relationships and in predicting a fold solely from its sequence. However, fewer fragments would be better for adequate prediction of such relationships. The number of fragments in a library is a compromise between the two requirements.
Many groups have derived libraries of short protein structures called structural alphabets [1]. These libraries differ in the methodologies used to derive fragments and in the parameters used to describe these fragments [2–11]. The description parameters include the Cα coordinates, Cα distances, and dihedral angles that are used by methods like hierarchical clustering, empirical function, artificial neural network, hidden Markov model, and Kohonen maps for classification. These libraries differ in length of the fragments and the number of prototypes used to describe them.
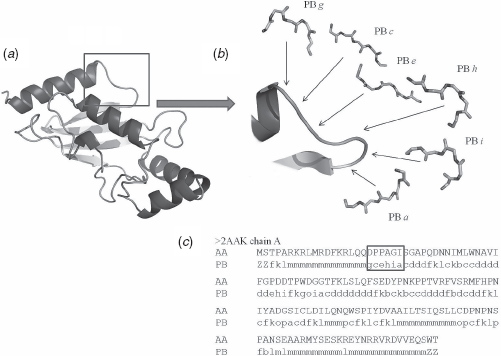
One such library of local structural descriptors are PBs, which are highly informative and have proved to be useful in various applications. It is a set of 16 structural prototypes named as a to p, each describing a five residue peptide [8]. Thus, each of the 16 prototypes is defined by a set of 8 dihedral angles. The PBs d and m roughly represent the backbone of strand and helix, respectively. The prototypes a to c are associated with the N-caps of the β strand and e to f to its C-caps. The PBs k to l and n to p, respectively, describes the N- and C-caps of α helix and g to j represent PBs, which can be associated with coils. These have been identified using unsupervised machine learning algorithm [8]. The dihedral angles were calculated for each of the overlapping fragment, five residues long, extracted from a nonredundant set of protein structures. The difference in the values of the angles among these fragments was scored using root-mean-square deviation on angular (RMSDA [7]) values. An unsupervised approach related to self-organizing map (SOM [12]) was trained to learn the difference in structural fragments using RMSDA as the distance metric and also the transition probabilities between fragments in a sequence. The process resulted in generation of 16 prototypes. It can approximate the local backbone conformation with an RMSD of 0.42 Å [13]. Figures 8.1 shows the 3D structure of ubiquitin conjugating enzyme [14] transformed into a 1D PB sequence. The PBs approach has proved useful in various kinds of analyses as described below, and at present it is the most widely used structural alphabet.
FIGURE 8.1 Transformation of a 3D structure of ubiquitin conjugating enzyme (PDB code 2AAKv [14]) to its 1D PBs sequence. (a) A 3D representation of 2AAK. (b) Focuses on the loop region and correspondence in terms of PBs, with PBs gcehia. (c) The complete structure encoded in terms of PBs, the loop region in (b) is boxed. This figure and Figures 8.2, 8.5, and 8.8 have been generated using PyMOL [15].
While the superposition of 3D structures is complex, two structures encoded as a string of PBs can be aligned through a simple dynamic programming algorithm. The PB-ALIGN algorithm, which uses dynamic programming and PB-specific substitution table to align two PB sequences, has been developed [16,17]. A substitution matrix specific to blocks, which contains the probability of substitution of a PB by any of the 16 PBs, has been generated. The PALI database [18], containing structure-based sequence alignment of homologous protein structures in every SCOP family, was used to generate the matrix. The frequency of substitution for every PB was calculated for all topologically equivalent regions and normalized by the occurrence of blocks in the database. Apart from aligning two structures (see Figures 8.2), the PB-ALIGN algorithm has also been used successfully in database mining to identify proteins of similar structure [21]. The PB approach also has been applied in identifying Mg2+binding sites in proteins [22].
Protein Blocks are five residue long fragments. To assess the structural stability of these short fragments, we identified the most frequent series of five consecutive PBs. They proved their capabilities to describe long length fragments [23]. A novel approach named the hybrid protein model (HPM) was developed [24,25]. This innovative approach made it possible to create longer prototypes that are 10–13 residues in length. Alongside, the number of prototypes has increased significantly to take into account structural variability for these longer fragments (e.g., 100–130 prototypes). These longer fragments were used to perform simple structural superimposition [26], methodological optimization [24], and analysis of sequence–structure relationships [25,27].
Prediction of protein structure from sequence alone is still a challenging task. Protein Blocks have been used not only to predict short loops [28], but also global structures [29]. The accuracy with a simple Bayesian approach reached 34.4% [8]; it was improved to 48.7% [30]. Recent developments have been made by other teams. Li et al. proposed an innovative approach for PB prediction, taking into account the information on secondary structure and solvent accessibilities [31]. Interestingly their approach was found to be useful for fragment threading, pseudosequence design, and local structure predictions. Zimmermann and Hansmann developed a method for PB prediction using support vector machines (SVMs) with a radial basis function kernel, leading to an improvement of the prediction rate of 60–61% [32].The prototypes of HPM have also been used in different prediction approaches [25,33].
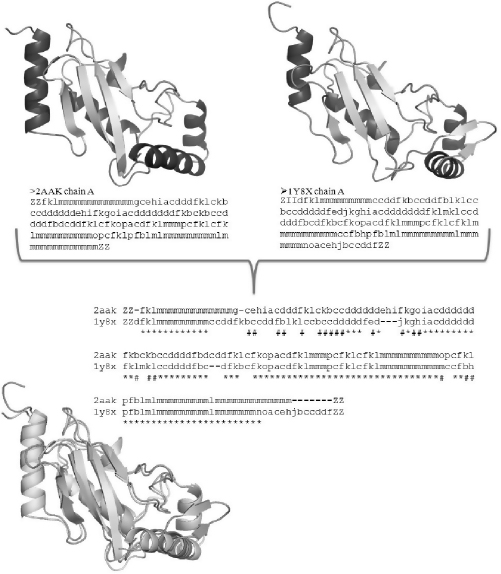
FIGURE 8.2 Protein structure superimposition using PB-ALIGN [17]. First, the protein structures are encoded in terms of PBs. In this example, the two proteins are the ubiquitin conjugating enzyme (cf. Figures 8.1) and a ubiquitin protein ligase (PDB code 1Y8X [19]). Then, using global and / or local alignment, in a similar way to CLUSTALW [20], the two PB sequences are aligned. Identical (∗) and similar (#) PBs have been underlined. The protein structures are easily superimposed from this PB sequence alignment.
Apart from its application in the approximation of protein backbone, comparison of protein structures and prediction of local backbone structures as mentioned above, the PB approach also has been used to build transmembrane protein structures [34], to design peptides [35], to define reduced alphabets for designing mutants [36], and to analyze protein contacts [37].
8.1.2 An Introduction to Protein Kinases
Protein phosphorylation is an important regulatory mechanism used by cells to respond to external stimuli (e.g., neurotransmitters, hormones, or stress signals). Protein kinases are enzymes that phosphorylate the target protein by transfer of γ phosphate of an adenosine triphosphate (ATP) molecule. The target proteins include enzymes (e.g., glycogen synthase and other kinases); transcription factors (e.g., c-Jun) and non-enzymatic proteins (e.g., histones) that are involved in distinct signaling pathways linked to metabolism, gene expression, cell motility, cell division, cell differentiation, and apoptosis. Phosphorylation of target protein alters its subcellular localization, activity levels or its association with other proteins, affecting the downstream processes in the signaling pathway. Since kinases are key players in the regulation of these processes, a tight regulation of their activity is crucial for normal functioning of an organism. A few mechanisms to regulate kinases have been described in the following paragraphs.
Based on the identity of amino acid phosphorylated in the target, protein kinases have been broadly categorized into (1) serine–threonine, (2) tyrosine, and (3) dual-specificity kinases, which can phosphorylate serine–threonine, tyrosine, and any of the three residues, respectively. Phosphorylation at other residues (e.g., histidine, lysine, arginine, cysteine, and aspartate) have also been reported in the literature. Serine–threonine and tyrosine kinases form the largest protein family in many eukaryotes and share a common 3D catalytic domain. A classification of kinases based on sequence similarity of the catalytic domain has been proposed [38]. The seven major groups are (1) AGC (protein kinases A, B, and C), (2) CMGC (cyclin-dependant kinase, map kinase, glycogen synthase kinase 3, casein kinase II), (3) CaMK (Ca2+, calmodulin kinase), (4) PTK (protein tyrosine kinase), (5) TKL (tyrosine kinase-like kinases), (6) STE (a family including many kinases from MAPK cascade), (7) OPK (other protein kinase). Each group contains various families and subfamilies, whose details are beyond the scope of this chapter. The reader can refer to various resources on kinases mentioned at the end of the chapter [39,40].
The kinase catalytic domain, which is 250–300 residues long, is well conserved among serine–threonine and tyrosine kinases. It can be divided into two subdomains: N-terminal lobe, formed mainly from a five-stranded sheet and a helix called an αC helix and a C terminal lobe, which is predominantly helical. Several conserved motifs important for catalytic activity have been characterized. Figures 8.3 highlights the important regions and the crucial residues required for catalysis. The ATP binding and the catalytic site are located between the two subdomains. A highly conserved P loop, which contains a glycine-rich motif, GXGXφG, formed by two antiparallel strands (β1 and β2) connected by a loop, binds to the phosphate group of ATP in the ATP binding cleft. The Gly residue provides flexibility and φ is usually a Phe or a Tyr residue that caps ATP. An invariant lysine, located in the β3 strand, orients α and β phosphates of ATP for phosphotransfer and also forms a catalytic triad through ionic interactions with Asp (184 in protein kinase PKA) and Glu (91 in PKA) that are located in the αC helix. These interactions are important to maintain kinase in its active state. Catalytic loop, part of the C-terminal lobe, contains an Asp residue that acts as a base and phosphorylates the OH group of the substrate. The activation loop present in the C-terminal lobe is phosphorylated when a kinase is in an active state. This causes stabilization of the loop conformation allowing the binding of substrate. The DFG motif in a typical kinase structure lies N-terminal to the activation loop, D in this motif interacts with the Mg2+ion. The C-terminal end of the activation loop is marked by a conserved APE motif. The Glu forms electrostatic interactions with a conserved Arg residue.
FIGURE 8.3 The catalytic domain of kinase. The motifs important for ligand binding and catalysis have been marked. The key residues important for function are shown as sticks. Mg-ATP is shown as spheres.

Another important interaction responsible for stabilization of the catalytic loop is formed between the Tyr and Arg residues. The placement of the DFG motif and phosphorylation sites vary among different kinases. The phosphorylation site and the nearby residues form a signature, specific for each kinase, that acts as a peptide positioning region.
The fact that protein kinases regulate important cellular processes necessitates a tight regulation of activation in these proteins. The enzymes are usually kept “off”’ and the activation is under multiple layers of control. Few important modes of regulation of these enzymes are described [39]. (a) The binding of extracellular ligands to receptors–ion channels leads to a change in the concentration of secondary messengers including small molecules: adenosine 32+ 5′−cyclic monophosphate (cAMP), guanosine 3′: 5′−cyclic monophosphate (cGMP); lipid secondary messengers:
diacylglycerol, phosphatidylinostiol, 3,4,5-triphosphate, and Ca2+. Most secondary messengers such as cAMP, for example; exert their effect through allosteric binding to additional domains–subunits in kinases as in PKA and Ca2+−-calmodulin activation as in CaMK. The secondary messengers-dependant kinases, in the absence of secondary messengers, are kept in the inactive state by association with autoinhibitory regions. (b) The catalytic subunits in cyclin-dependant kinases, for example, are activated only after their association with regulatory subunits (e.g., cyclins) whose level of expression varies depending on the functional state of the cell. (c) In Src kinases, for example, additional domains (e.g., SH2 and SH3) target the enzyme to different subcellular localization. (d) In receptor kinases, the external signal induces oligomerization of receptors leading to autophosphorylation of intracellular domains. The autophosphorylated site may serve as a docking site for accessory proteins leading to the activation of downstream processes in the signaling cascade. (e) Many protein kinases are activated by phosphorylation in sites located mainly in the activation loop of the catalytic domain or sometimes in regions beyond the catalytic domain or in another subunit. The signaling events are tightly regulated not only to activate a molecule from an “off”’ state, but also to limit the lifetime of active moieties. Even a slight perturbation in regulation can have severe consequences. The deregulation of kinases has been linked to diseases like cancer and diabetes. Various kinases, like MAP kinase, c-Src, c-Abl, PI3 kinase, and EGF receptor are known to be activated in cancer genes. The use of kinases as potential drug targets has been accelerated especially after the success of Gleevac (Novartis), an inhibitor of protein tyrosine kinases for anti-cancer therapy.
Kinases act as molecular switches and exist in two distinct conformational states: the “on” state, the high-activity form and “off” state, low-activity form [41]. We have compared the two states and characterized the structural alterations into rigid-body displacements and conformational variations by using the PBs approach. The analysis is presented in Section 8.2.
8.2 DISTINGUISHING CONFORMATIONAL VARIATIONS FROM RIGID-BODY SHIFTS IN ACTIVE AND INACTIVE FORMS OF A KINASE
The data set considered for this analysis includes crystal structures solved for various kinases in their active and inactive forms [42,43]. For each kinase, its active and inactive forms were superposed using a robust structural alignment algorithm, MUSTANG [44]. The regions that correspond to high deviation in their Cα position were identified by calculating Cα−-Cα deviation values for every pair of equivalent residues in the two aligned protein structures. Also, each of the two structures was encoded as a string of PBs. The two PB sequences were then mapped onto the structural alignment previously generated using MUSTANG. A score was assigned to all positions where the deviation in Cα positions is high, by using the substitution table for PBs [16]. The variable regions, which have undergone only rigid-body movements, will be reflected as high PB scores. Since the local structure has remained the same and has only shifted, the corresponding PBs would be identical or highly similar giving a positive score for the alignment region. On the contrary, a low PB score would indicate differences in the properties of aligned PBs indicating a conformation change at the structurally variable region. This approach was applied to analyze the structural differences in the two forms of various kinases and the results for individual cases are discussed below.
FIGURE 8.4 A plot of Cα−-Cα deviation and PB score versus the alignment position for the aligned structures of distinct states of insulin receptor kinase (IRK). The regions corresponding to conformational variations and rigid-body shifts are indicated as filled and open boxes, respectively.
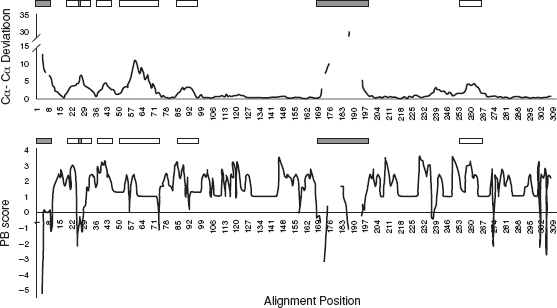
8.2.1 Insulin Receptor Kinase
Insulin receptor kinase is a transmembrane protein tyrosine kinase receptor that regulates pathways involved in cell metabolism and growth. A switch from its inactive to active form requires binding of insulin in the extracellular domain. The signal of ligand binding is transmitted to the catalytic domain located in the cytosolic side. The response to the signal includes autophosphorylation of tyrosine residues in the activation loop of the kinase domain. Phosphorylation of insulin response substrates by activated kinases leads to the activation of downstream molecules in the signaling pathway. Crystal structures of human IRK in both the active (PDB code 1IRK, [43]) and inactive forms (1IR3,[46]) have been reported. Figures 8.4 shows a plot of Cα−-Cα deviation values and PB scores corresponding to each position in the alignment of the active and inactive forms of kinases. The regions with high deviation of Cα positions and high PB scores that correspond to rigid-body shifts are indicated in open rectangles. The regions with high deviation and low scores that correspond to conformational differences are indicated in filled rectangles. The regions of structural variations in the two forms of IRK have also been marked in Figures 8.5(a). The rigid-body shifts are shown in dark gray and conformational variations are in black. These observations are consistent with structural variations in IRK reported in the literature. In the inactive form, the activation loop is in an autoinhibitory conformation preventing the binding of substrate and restricting the access of an ATP molecule. Phosphorylation of three tyrosine residues in the activation loop of the protein results in a large displacement in the loop that is as high as 30 Å. Overall, there is a rigid-body shift in the N-terminal domain that is prominent in β1 and β2 strands, P loop connected to the strands, and αC helix [Figures 8.5(a)]. The residues in nucleotide binding (P loop) form contacts with phosphates of ATP bound at the active site. A small region in P loop motif undergoes slight conformational change as reflected from the scores in the blocks alignment. The movement of helix brings a conserved Glu in close proximity to Lys in the ATP binding site [45]. These structural alterations together result in the alignment of residues for optimal interactions that are required for catalysis.
FIGURE 8.5 Superpositions of active and inactive states of various kinases. (a) Insulin receptor kinase, (b) mitogen activated protein kinase (MAPK), (c) protein kinase A, (d) cyclin-dependant protein kinase. The regions undergoing marked structural alterations have been labeled.

8.2.2 Mitogen-Activated Protein Kinase
Mitogen-Activated Protein Kinase are serine–threonine specific kinases that control embyogenesis, cell transformation, cell proliferation, cell differentiation, and apoptosis. The members of the MAPK family include ERKs, JNKs, and P38 kinases. The ERKs are activated by mitogen and growth factors, while JNK and P38 are activated in response to inflammatory cytokines, growth factors, and cellular stress. The dual phosphorylation at Thr and Tyr in the TXY motif located in the activation loop causes the switching of kinase to its active form. The activated kinases phosphorylate various transcription factors, cytoskeletal elements, other protein kinases, and enzymes. Since these enzymes mediate key events throughout the cell, they are drug targets for a wide range of diseases including cancer and Alzheimer. The superposition of the structures of active ERK2 (2ERK, [47]) and inactive state (1ERK, [48]) of the enzyme are shown in Figures 8.5(b). Although, no marked rigid-body displacements were observed, conformational variations were seen in nucleotide binding loop (P loop), activation loop, and a C-terminal extension L16, a region specific to MAPK. The N-terminal regions are disordered in both the protein structures.
The activation loop is the central regulator. Conformational change in the activation loop brings the phosphorylated Ser and Tyr residues closer to an Arg that provides charge stabilization. One of the phosphorylated residues now sits between the two domains facilitating domain closure while the other phosphorylated residue on the surface forms the P+1 specificity site. A small loop region in inactive kinase in L16 changes to a 310helix in the active form. This conformation change was also captured by a change in PBs between the active and inactive form that corresponds to loops and helices, respectively. The conversion to helical structure brings a previously buried Phe on the surface that now forms stacking interactions with a His in the activation loop. The 310helix promotes tighter interactions between the two domains. Also, the exposure of previously buried Leu residues to solvent creates a hydrophobic patch that facilitates homodimerization, known to be important for nuclear localization of the enzyme. The MAPK insertion region does not undergo significant change. The interaction of the phosphorylated region in the activation loop with the N-terminal lobe and L16 orients the N- and C-terminal lobe.
8.2.3 Protein Kinase A
Protein Kinase A is a cAMP dependant protein kinase and plays a key role in cellular response to this secondary messenger. The enzyme is a heterotetramer of two regulatory and two catalytic subunits. Activation of the kinase is mediated by binding of cAMP to the regulatory subunits with subsequent release of catalytic subunits. The tertiary structures of active (1ATP, [49]) and inactive forms (1J3H, [50]) were superposed. The comparison of the alignment of the two structures revealed structural alterations in the nucleotide binding loop, the αB helix, the αG helix, and the activation loop [Figures 8.5(c)]. The phosphorylation of the residues in the activation loop switches the enzyme to its active form. The conformational change in the activation loop is linked to adjustments in the rest of the structure to realign the catalytically important residues for efficient phosphotransfer. The rigid-body shift in the P loop brings the residues of this loop closer to ATP allowing the interactions with α and β phosphate groups to form. The loop connecting the helices F and G is the peptide-binding loop. Due to a shift in this loop and in the G helix, the residues in this region can now extend the network of interactions from the substrate-binding region to the active site allowing a communication between the distant regions promoting catalysis.
8.2.4 Cyclin-Dependant Kinase
Cyclin-Dependant Kinase 2 (CDK2) is a serine–threonine specific kinase that coordinates the events in eukaryotic cell cycle. The activation of the kinase requires binding to cognate cyclin and phosphorylation in the activation segment in a two-step process. The structure of phosphorylated CDK2 in complex with cyclin A and ATPγ S, the fully active form (1JST [51]), was compared with the unphosphorylated, apo form (1B38 [52]). Based on the PB scores, marked conformation changes were observed in the T loop that contains the phosphorylation site analogous to the activation loop in PKA. Other regions that undergo variations include the nucleotide-binding loop and the loop connecting β3 to PSTAIRE helix [Figures 8.5(β3]. High PB scores that correspond to rigid-body shifts were observed for β1 and β2 strands and β hairpin connected to the PSTAIRE helix. Binding of cyclin results in variation in the activation segment and the PSTAIRE helix. The additional interactions formed by the phosphorylated T segment with cyclin compared to the unphosphorylated segment cause further stabilization of the complex. Binding of cyclin restores the interaction between Lys in the β3 strand and Glu in the PSTAIRE helix. The PSTAIRE helix seems to play a key role in regulation. The residues in this helix interacts with cyclin and help in neutralization of charge at the phosphorylated site. Although an arginine from the catalytic loop also helps in charge neutralization, no significant structural alterations were observed in this region.
The above analyses indicate that different protein kinases share regions that undergo structural variations to switch to their active forms. However, the nature of structural alterations is not similar.
8.3 CROSS COMPARISON OF ACTIVE AND INACTIVE FORMS OF CLOSELY RELATED KINASES
This section describes the analyses on comparison of active forms of a kinase with the active and inactive forms of a closely related kinase. We show the results for two closely related pairs: (1) PKA [active, 1ATP[49] and inactive, 1J3H [50]], protein kinase B (PKB) [active, 1O6L [53] and inactive, 1MRV[54]]; (2) IRK [active, 1IRK [45] and inactive, 1IR3 [46]], insulin-like growth factor receptor kinase (ILGFRK) [active, 1K3A [55] and inactive, 1JQH [56]].
For each pair of closely related kinases, the active forms were aligned using MUSTANG [44]. The structures of the active forms of kinases were also superposed on the inactive form of a closely related kinase. The structures of each kinase were transformed as PBs and mapped on the structure-based sequence alignments. For all alignment positions where residues were aligned, the PB scores were calculated using the PB substitution matrix. A normalized PB score was calculated after adding values over the entire alignment and dividing by the number of residue–residue alignment positions. The analysis revealed a high PB score for an alignment of the active forms compared to the cross-comparison of the active and inactive forms for each pair of closely related kinases. Additionally, the alignment of active and inactive forms of the same enzyme scored lower than the pair of active kinases. The results are presented in Figures 8.6.
FIGURE 8.6 The plot highlights the difference in PBs score obtained after alignment of active pairs and active–inactive pairs in closely related kinases. The positions in the plot that refer to PB scores for active pairs are shown as dots and active–inactive pairs are indicated as crosses. The notation for kinase pairs is as follows: (1) PKA active–PKB active compared to PKA active–PKB inactive, (2) PKA active–PKB active compared to PKB active–PKA inactive, (3) PKA active–PKB active compared to PKA active–PKA inactive, (4) PKA active–PKB active compared to PKB active–PKB inactive, (5) IRK active–ILGFRK active compared to IRK active–ILGFRK inactive, (6) IRK active–ILGFRK active compared to ILGFRK active–IRK inactive, (7) IRK active–ILGFRK active compared to IRK active–IRK inactive, (8) IRK active–ILGFRK active compared to ILGFRK active–ILGFRK inactive.

The analysis indicates a higher global similarity in the active forms of closely related kinases as compared to the active and inactive forms. This preliminary study suggests a possibility of identifying the functional state of a kinase based on the PB score obtained after its comparison with the other known states of the same enzyme or its close homologs.
8.4 COMPARISON OF THE ACTIVE STATES OF HOMOLOGOUS KINASES
In this analysis, the structures of the active forms of PKA, IRK, CDK2, and MAPK have been compared. Although, the proteins share only 14% similarity in sequence, the structures of the active kinases share remarkable similarity. Figures 8.7 shows a block of structure-based sequence alignment generated after simultaneous superposition of the structures of above mentioned kinases using MUSTANG [44] algorithm and represented in JOY [57] format. As shown in Figures 8.7, the residues that play an important role either in catalysis or in ligand binding are conserved: Gly-rich motif in P loop; Lys in β3 strand that positions α and β phosphates of ATP for catalysis; Glu in αC helix that forms ion-pair with Lys and is important for catalysis; catalytic Asp, His, and Arg residues in the catalytic loop; conserved Asp in F helix (not shown in the figure), and DFG and APE motifs in the activation loop. Although important residues are aligned, certain regions holding these residues show high Cα−-Cα deviation with respect to equivalent regions in other kinases (see Figures 8.8). The P loop in PKA is shifted away compared to the loop in other kinases, which overlap better. The representation as PBs shows dissimilarity in the properties of PBs corresponding to this region suggesting a variation in local structure. There is a rigid-body shift in the αC helix of IRK. The helix movement is known to be coupled to nucleotide binding at the active site of the enzyme. The N-terminal DFG motif in IRK shows slight deviation compared to other kinases. This deviation corresponds to a conformational variation. The activation segment differs in length and is conformationally distinct among these kinases. The primary phosphorylation sites in these kinases do not lie at topologically equivalent regions. The helices F and G are conserved.
FIGURE 8.7 A multiple alignment of the structures of active kinases. The alignment has been labeled for various regions. Secondary structures are marked in the figure; α corresponds to α helix, β refers to β−strand and 3 to 310helix. The solvent inaccessible regions are shown in upper case while buried regions are in lower case.

FIGURE 8.8 The superposition of PKA, IRK, MAPK, and CDK structures in their active state is shown. The structurally variable regions are shown in black.

The above analysis highlights the similarities and differences in the structures of active forms of kinases through identification of regions of high Cα−-Cα deviation and their representation as PBs.
8.5 CONCLUSIONS
Protein blocks are a higher level abstraction of protein structures as compared to the standard three-state description as helix, strand, and coil.
The PBs approach can be used successfully in distinguishing rigid-body shifts from conformational variations, as has been exemplified for kinases, which have distinct 3D structures in their active and inactive states. The regions with high deviation in Cα positions and low PB scores correspond to conformational variations. On the contrary, a high PB score for regions with high deviation indicates a similarity in local structure with gross reorganization of the local region on the 3D structure. Under such circumstances, a large value of Cα−-Cα deviation is a consequence of displacement of the region. Based on our analyses using this approach, we find that the regions in inactive protein kinases that undergo structural alterations while switching to their active states are generally common among these kinases; however, the nature of variations is different. The study can be extended to analyze structural variations in proteins at various levels. Examples include the study of homologous proteins to understand structural differences, analyses of structural changes induced in proteins on binding to different ligand–effector molecules, and study of structural alterations at protein–protein interfaces because of binding to its interacting partner.
A cross-comparison of active and inactive states of closely related kinases indicates a higher global similarity in the structure of active states of the kinases as reflected from their PB scores compared to the active and inactive forms. This kind of study might be useful in estimating the activity levels(state) of kinases based on their PB score.
Even though the active states of various kinases are structurally quite similar, differences do exist. We have compared the active forms of four different kinases and identified the regions, which deviate from the topologically equivalent regions in other kinases. When encoded as PBs, some equivalent regions with high Cα−-Cα deviation have low PB scores indicating conformation differences in those regions. The regions with high deviation and score showed differences in spatial orientations of the local structures in the homologous kinases.
ACKNOWLEDGMENTS
We thank Mr. Mahajan and Ms. Swapna for comments and suggestions. This research is supported by an Indo-French Collaborative grant (grant from CEFIPRA number 3903- E). GA and DCD are supported by CSIR, Government of India and CEFIPRA, respectively.
REFERENCES
1. B. Offmann, M. Tyagi, and A. G. de Brevern (2007), Local Protein Structures, Curr. Bioinformatics 2: 165–202.
2. R. Kolodny, P. Koehl, L. Guibas, and M. Levitt (2002) Small libraries of protein fragments model native protein structures accurately, J. Mol. Biol. 323: 297–307.
3. C. Bystroff and D. Baker (1998), Prediction of local structure in proteins using a library of sequence-structure motifs, J. Mol. Biol. 281: 565–577.
4. R. Unger and J. L. Sussman (1993), The importance of short structural motifs in protein structure analysis, J. Comput. Aided. Mol. Des. 7: 457–472.
5. M. J. Rooman, J. Rodriguez, and S. J. Wodak (1990), Automatic definition of recurrent local structure motifs in proteins, J. Mol. Biol. 213: 327–336.
6. A. C. Camproux, P. Tuffery, J. P. Chevrolat, J. F. Boisvieux, and S. Hazout (1999), Hidden Markov model approach for identifying the modular framework of the protein backbone, Protein Eng. 12: 1063–1073.
7. J. Schuchhardt, G. Schneider, J. Reichelt, D. Schomburg, and P. Wrede (1996), Local structural motifs of protein backbones are classified by self-organizing neural networks, Protein Eng. 9: 833–842.
8. A. G. de Brevern, C. Etchebest, and S. Hazout (2000), Bayesian probabilistic approach for predicting backbone structures in terms of protein blocks, Proteins 41: 271–287.
9. S. J. Prestrelski, D. M Byler, and M. N Liebman (1992), Generation of a substructure library for the description and classification of protein secondary structure. II. Application to spectra-structure correlations in Fourier transform infrared spectroscopy, Proteins 14: 440–450.
10. S. Y. Ku and Y. J. Hu (2008), Protein structure search and local structure characterization, BMC Bioinformatics 9: 349.
11. J. S. Fetrow, M. J Palumbo, and G. Berg (1997), Patterns, structures, and amino acid frequencies in structural building blocks, a protein secondary structure classification scheme, Proteins 27: 249–271.
12. T. Kohonen (1982), Self-organized formation of topologically correct feature maps, Biol. Cybernetics 43: 59–69.
13. A. G. de Brevern (2005), New assessment of a structural alphabet, In Silico Biol. 5: 283–289.
14. W. J. Cook, L. C. Jeffrey, M. L. Sullivan, and R. D Vierstra (1992), Three-dimensional structure of a ubiquitin-conjugating enzyme (E2), J. Biol. Chem. 267: 15116–15121.
15. W. L. DeLano (2002), The PyMOL Molecular Graphics System. USA: Delano Scientific, San Carlos, CA.
16. M. Tyagi, V. S. Gowri, N. Srinivasan, A. G. de Brevern, and B. Offmann (2006), A substitution matrix for structural alphabet based on structural alignment of homologous proteins and its applications, Proteins 65: 32–39.
17. M. Tyagi, et al. (2006), Protein Block Expert (PBE): a web-based protein structure analysis server using a structural alphabet, Nucleic Acids Res. 34: W119–123.
18. S. Balaji and N. Srinivasan (2001), Use of a database of structural alignments and phylogenetic trees in investigating the relationship between sequence and structural variability among homologous proteins, Protein Eng. 14: 219–226.
19. D. T. Huang, A. Paydar, M. Zhuang, M. B. Waddell, and J. M. Holton et al (2005), Structural basis for recruitment of Ubc12 by an E2 binding domain in NEDD8s E1, Mol. Cell 17: 341–350.
20. J. D. Thompson, D. G. Higgins, and T. J. Gibson (1994), CLUSTAL W: improving the sensitivity of progressive multiple sequence alignment through sequence weighting, position-specific gap penalties and weight matrix choice, Nucleic Acids Res. 22: 4673–4680.
21. M. Tyagi, A. G. de Brevern, N. Srinivasan, and B. Offmann (2008), Protein structure mining using a structural alphabet, Proteins 71: 920–937.
22. M. Dudev and C. Lim (2007), Discovering structural motifs using a structural alphabet: application to magnesium-binding sites, BMC Bioinformatics 8: 106.
23. A. G. de Brevern, H. Valadie, S. Hazout, and C. Etchebest (2002), Extension of a local backbone description using a structural alphabet: a new approach to the sequence-structure relationship, Protein Sci. 11: 2871–2886.
24. A. G. de Brevern and S. Hazout (2003), Hybrid protein model for optimally defining 3D protein structure fragments, Bioinformatics 19: 345–353.
25. C. Benros, A. G. de Brevern, C. Etchebest, and S. Hazout (2006), Assessing a novel approach for predicting local 3D protein structures from sequence, Proteins 62: 865–880.
26. A. G. de Brevern and S. Hazout (2001), Compacting local protein folds by a Hybrid Protein Model, Theor. Chem. Acc. 106: 36–49.
27. C. Benros, A. G. de Brevern, and S. Hazout (2009), Analyzing the sequence-structure relationship of a library of local structural prototypes, J. Theor. Biol. 256: 215–226.
28. L. Fourrier, C. Benros, and A. G. de Brevern (2004), Use of a structural alphabet for analysis of short loops connecting repetitive structures, BMC Bioinformatics 5: 58.
29. Q. W. Dong, X. L. Wang, and L. Lin (2007), Methods for optimizing the structure alphabet sequences of proteins, Comput. Biol. Med. 37: 1610–1616.
30. C. Etchebest, C. Benros, S. Hazout, and A. G. de Brevern (2005), A structural alphabet for local protein structures: improved prediction methods, Proteins 59: 810–827.
31. Q. Li, C. Zhou, and H. Liu (2009), Fragment-based local statistical potentials derived by combining an alphabet of protein local structures with secondary structures and solvent accessibilities, Proteins 74: 820–836.
32. O. Zimmermann and U. H. Hansmann (2008), LOCUSTRA: accurate prediction of local protein structure using a two-layer support vector machine approach, J. Chem. Inf. Model. 48: 1903–1908.
33. A. Bornot, C. Etchebest, and A. G. de Brevern (2009), A new prediction strategy for long local protein structures using an original description, Proteins 76: 570–587.
34. A. G. de Brevern et al. (2005), A structural model of a seven-transmembrane helix receptor: the Duffy antigen/receptor for chemokine (DARC), Biochim. Biophys. Acta. 1724: 288–306.
35. A. Thomas et al. (2006), Prediction of peptide structure: how far are we? Proteins 65: 889–897.
36. C. Etchebest, C. Benros, A. Bornot, A. C. Camproux, and A. G. de Brevern (2007), A reduced amino acid alphabet for understanding and designing protein adaptation to mutation, Eur. Biophys. J. 36: 1059–1069.
37. G. Faure, A. Bornot, and A. G. de Brevern (2009), Analysis of protein contacts into Protein Units, Biochimie 91: 876–887
38. S. K. Hanks and T. Hunter (1995), Protein kinases 6. The eukaryotic protein kinase superfamily: kinase (catalytic) domain structure and classification, Faseb J. 9: 576–596.
39. G. D. Hardie and S. Hanks (1995), The Protein Kinase Facts Book Vol.1, Set : Protein–Serine Kinases, London, Academic Press Inc. Ltd.
40. G. D. Hardie and S. Hanks (1995), The Protein Kinase Facts Book Vol.2, Set : Protein-Tyrosine Kinases, London, Academic Press Inc. Ltd.
41. M. Huse and J. Kuriyan (2002), The conformational plasticity of protein kinases, Cell 109: 275–282.
42. A. Krupa, G. Preethi, and N. Srinivasan (2004), Structural modes of stabilization of permissive phosphorylation sites in protein kinases: distinct strategies in Ser/Thr and Tyr kinases, J. Mol. Biol. 339: 1025–1039.
43. E. J. Goldsmith, R. Akella, X. Min, T. Zhou, and J. M. Humphreys (2007), Substrate and docking interactions in serine/threonine protein kinases, Chem Rev 107: 5065–5081.
44. A. S. Konagurthu, J. C. Whisstock, P. J. Stuckey, and A. M. Lesk (2006), MUSTANG: a multiple structural alignment algorithm, Proteins 64: 559–574.
45. S. R. Hubbard (1997), Crystal structure of the activated insulin receptor tyrosine kinase in complex with peptide substrate and ATP analog, Embo. J. 16: 5572–5581.
46. S. R. Hubbard, L. Wei, L Ellis, and W. A. Hendrickson (1994), Crystal structure of the tyrosine kinase domain of the human insulin receptor, Nature (London), 372: 746–754.
47. B. J. Canagarajah, A. Khokhlatchev, M. H. Cobb, and E. J. Goldsmith (1997), Activation mechanism of the MAP kinase ERK2 by dual phosphorylation, Cell 90: 859–869.
48. F. Zhang, A. Strand, D. Robbins, M. H. Cobb, and E. J. Goldsmith (1994), Atomic structure of the MAP kinase ERK2 at 2.3 Å resolution, Nature (London), 367: 704–711.
49. J. Zheng et al. (1993), 2.2 Å refined crystal structure of the catalytic subunit of cAMP-dependent protein kinase complexed with MnATP and a peptide inhibitor, Acta Crystallogr. D Biol. Crystallogr 49: 362–365.
50. P. Akamine et al. (2003), Dynamic features of cAMP-dependent protein kinase revealed by apoenzyme crystal structure, J. Mol. Biol. 327: 159–171.
51. A. A. Russo, P. D. Jeffrey, and N. P. Pavletich (1996), Structural basis of cyclin-dependent kinase activation by phosphorylation, Nat. Struct. Biol. 3: 696–700.
52. N. R. Brown et al. (1999), Effects of phosphorylation of threonine 160 on cyclin-dependent kinase 2 structure and activity, J. Biol. Chem. 274: 8746–8756.
53. J. Yang et al. (2002), Crystal structure of an activated Akt/protein kinase B ternary complex with GSK3-peptide and AMP-PNP, Nat. Struct. Biol. 9: 940–944.
54. X. Huang et al. (2003), Crystal structure of an inactive Akt2 kinase domain, Structure 11: 21–30.
55. S. Favelyukis, J. H. Till, S. R. Hubbard, and W. T. Miller (2001), Structure and autoregulation of the insulin-like growth factor 1 receptor kinase, Nat. Struct. Biol. 8: 1058–1063.
56. A. Pautsch et al. (2001), Crystal structure of bisphosphorylated IGF-1 receptor kinase: insight into domain movements upon kinase activation, Structure 9: 955–965.
57. K. Mizuguchi, C. M. Deane, T. L. Blundell, M. S. Johnson, and J. P. Overington (1998), JOY: protein sequence-structure representation and analysis, Bioinformatics 14: 617–623.