
CHAPTER 2
Currency Futures and Forward Contracts
Foreign currency futures contracts were introduced in 1972 by the CME. Today, the CME is the largest foreign currency futures exchange. The contracts on the CME call for the delivery (or purchase) of a specified amount of foreign currency at the delivery date. Exhibit 2.1 lists many of the currency futures contracts traded on the CME and Exhibit 2.2 shows Bloomberg Description and Price screens for the CME’s December 2016 British pound (BP) futures contract. The futures contract price on the British pound (BPA <Curncy>) is quoted in cents, and the size of the contract calls for the purchase or delivery of 62,500 BPs. The delivery date on the December contract is 12/21/16, and on 7/14/16 the futures prices was ¢133.70/BP.
| Chicago Mercantile Exchange, CME: Currency | Volume | Open Interest | ||
| Ticker | Description | Options | 7/14/2016 | 7/14/2016 |
| ADA Curncy | AUD/USD Future | Yes | 94,129 | 88,594 |
| BPA Curncy | GBP/USD Future | Yes | 134,116 | 237,330 |
| BRA Curncy | BRL/USD Future | Yes | 517 | 26,871 |
| CDA Curncy | CAD/USD Future | Yes | 93,463 | 116,287 |
| CRDA Curncy | E‐Micro, AUD/USD | No | 8,173 | 1,847 |
| CREA Curncy | E‐Micro, EUR/USD | No | 14,466 | 4,062 |
| CRPA Curncy | E‐Micro, GBP/USD | No | 5,096 | 2,575 |
| DOA Curncy | CNY/USD Fut Chinese Yuan | Yes | 3 | 358 |
| ECA Curncy | EUR/USD Future | Yes | 129,021 | 370,525 |
| EEA Curncy | EUR/USD Emini Future | No | 3,978 | 4,398 |
| JEA Curncy | JPY/USD E‐Mini Future | No | 1,219 | 1,422 |
| JYA Curncy | JPY/USD Future | Yes | 144,023 | 160,831 |
| MCDA Curncy | E‐Micro, CAD/USD | No | 1,416 | 845 |
| MIRA Curncy | E‐Micro, INR/USD | No | 73 | 217 |
| MJYA Curncy | E‐Micro, JPY/USD | No | 1,906 | 1,297 |
| MSSA Curncy | E‐Micro, CHF/USD | No | 33 | 207 |
| NOA Curncy | NOK/USD Future | No | 25 | 820 |
| NVA Curncy | NZD/USD Future | Yes | 19,755 | 43,786 |
| OSA Curncy | CHF/USD AON Future | Yes | 18,271 | 39,946 |
| PEA Curncy | MXN/USD Future | Yes | 36,431 | 97,964 |
| SFA Curncy | CHF/USD Future | Yes | 18,271 | 39,946 |
EXHIBIT 2.1 Currency Futures Contracts Listed on the CME

EXHIBIT 2.2 CME December British Pound Futures Contract Bloomberg Description and Price Screens, BPZ6 <Curncy>
Forward contracts on foreign currencies are provided in the Interbank Foreign Exchange Market. As noted in Chapter 1, this OTC market consists primarily of major banks that provide tailor‐made forward contracts to their clients, which often are large multinational corporations and institutions. Exhibit 2.3 shows a three‐month British pound forward rates description and price graphs (GBP3M <Curncy>) and Exhibit 2.4 shows the bid quotes as of 7/14/16 on three‐month, six‐month, and one‐year forward contracts for 10 major currencies.

EXHIBIT 2.3 Three‐Month British Pound Forward Rates Bloomberg Description and Price Screens, GBP3M <Curncy>
| Currency | Spot 7/14/2016 | 3‐Month Forward 07/14/2016 10/18/2016 | 6‐Month Forward 07/14/2016 01/18/2017 | 1‐Year Forward 07/15/2016 07/18/2017 |
| EURUSD | 1.1112 | 1.115048 | 1.119592 | 1.12858 |
| USDJPY | 105.65 | 105.3086 | 104.8546 | 103.9465 |
| AUDUSD | 0.763 | 0.760698 | 0.75844 | 0.75457 |
| GBPUSD | 1.3295 | 1.330872 | 1.332743 | 1.336913 |
| USDCAD | 1.2933 | 1.293282 | 1.29311 | 1.29231 |
| USDDKK | 6.6943 | 6.67071 | 6.642758 | 6.583762 |
| NZDUSD | 0.7185 | 0.71549 | 0.712569 | 0.707507 |
| USDNOK | 8.3786 | 8.37893 | 8.377055 | 8.364083 |
| USDSEK | 8.4978 | 8.464869 | 8.427289 | 8.362952 |
| USDCHF | 0.9816 | 0.976974 | 0.971736 | 0.96137 |
EXHIBIT 2.4 Forward Rates, 7/14/2016
Currency futures and OTC forward contracts provide investors, businesses, and other economic entities a tool for hedging and speculating on currency positions. Long currency hedge positions are used to lock in the future costs of purchasing currency, while short hedges are used to lock in the price on the future sale of a currency. Currency futures and forward contracts are also used to speculate on expected price changes. An outright long currency futures position is taken when the price of the currency is expected to rise and a short outright position is taken when the price is expected to fall. Speculators can also form intracommodity and intercommodity spreads to obtain different return‐risk exposure for their speculative positions. Finally, like commodities, currency futures and forward prices are governed by the cost of carrying the underlying asset.
In Chapter 1, our hedging, speculation, and arbitrage examples were with commodity futures, such as crude oil, corn, coffee, and precious metals. In this chapter, we extend our analysis of hedging, speculation, and arbitrage to currency futures and forward contracts—the first financial futures contract.
Hedging with Foreign Currency Futures and Forward Contracts
With foreign currency futures and forward contracts, the domestic currency value of future cash flows or the future dollar value of assets and liabilities denominated in another currency can be hedged. Large multinational corporations usually hedge their currency positions in the interbank forward market, while smaller companies, some portfolio managers, and individuals typically use the organized futures markets. In either case, the currency position usually is hedged with a naive hedging model in which the number of futures and forward contracts is equal to the value of the foreign currency position to be hedged.
Short Hedge
To illustrate currency hedging, consider the case of a US investment fund expecting a payment of £10,000,000 in principal on its Eurobonds next September. Suppose the US fund is concerned about a $/BP exchange rate (Et) decrease and decides to hedge its September BP receipt with a BP forward contract. In this case, the fund would enter an agreement to sell £10,000,000 with a dealer (such as a bank) in the interbank dealer’s market on a specified September delivery date at a forward price of, say, f0 = $1.50/BP. The fund would have a short position in which it agrees to sell and the dealer would have a long position in which she agrees to buy. On the September delivery date, the fund would receive its £10,000,000 principal from its Eurobonds, which it would then sell on its forward contract to the dealer at f0 = $1.50/BP for $15,000,000. If the spot exchange rate at the September delivery date were less than f0 = $1.50/BP, then the fund would be pleased that it used the forward contract to lock in its $15,000,000 receipt instead of converting on the spot. However, if the spot exchange rate at the September delivery date were greater than f0 = $1.50/BP, then the fund would be disappointed that it used the forward contract to lock in its $15,000,000 receipt instead of converting its £10,000,000 on the spot at a higher $/BP exchange rate.
Instead of a forward hedge, the fund could alternatively hedge with a futures contract. Suppose September BP futures on the CME are trading at f0 = $1.50/BP. Since the contract size on the BP futures contract is 62,500 BP, the fund would need to go short in 160 BP contracts: nf = £10,000,000/£62,500 = 160 BP contracts. At expiration, the fund would find it easier and less expensive in terms of commission costs to sell its £10,000,000 on the spot market at the spot exchange rate, and then close its futures position by going long in an expiring September BP futures contract at an expiring future price equal (or approximately equal) to the spot exchange rate (fT = ET). Given that the spot and expiring futures prices are equal (or approximately equal), the fund would find that any less dollar revenue resulting from the spot rate being less than $1.50/BP would be offset by a profit from its futures position. On the other hand, any greater dollar revenue from the spot exchange rate exceeding $1.50 would be negated by losses on the fund’s futures position. As a result, the fund’s dollar revenue of selling £10,000,000 on the spot and closing its 160 BP futures contracts would be $15,000,000.
This futures hedge can be seen in Exhibit 2.5. In the exhibit, the first row shows three possible spot exchange rates of $1.40, $1.50, and $1.60, the second row shows revenues from selling £10,000,000 on the spot exchange market, the third row shows the profits and losses from the futures position, and the fourth row shows the constant hedged revenue of $15,000,000 from aggregating both positions. If ET = $1.40/BP, the fund receives $14,000,000 from selling £10,000,000 at $1.40/BP, but receives $1,000,000 profit from its futures position; that is, the agreement to sell £10,000,000 (= (160)(62,500 BP)) September BPs for $1.50 is closed with an agreement to buy £10,000,000 (= (160)(62,500 BP)) September BPs for $1.40/BP, resulting in a $1,000,000 receipt from the clearinghouse. On the other hand, if ET = $1.60/BP, the fund receives $16,000,000 from selling its £10,000,000 at the spot rate of $1.60/BP, but it has to pay the clearinghouse $1,000,000 to close the futures position; that is, the agreement to sell £10,000,000 (= (160)(62,500 BP)) September BPs for $1.50 is closed with an agreement to buy £10,000,000 (= (160)(62,500 BP)) September BP for $1.60/BP, resulting in a $1,000,000 payment to the clearinghouse. Thus, regardless of the spot exchange rate at the September expiration date, the fund receives $15,000,000.
| Initial Position: Short in 160 September BP futures contracts (Size = 62,500 BP) at $1.50/BP to hedge conversion of £10,000,000 to dollars in September. Delivery:
|
|||
| Positions | Hedged Revenue | ||
| (1) fT = ET (2) $ Revenue: ET (£10,000,000) (3) Profit from Futures (4) Net Revenue = Row (2) + (3) |
$1.40/BP $14,000,000 $1,000,000 $15,000,000 |
$1.50/BP $15,000,000 0 $15,000,000 |
$1.60/BP $16,000,000 −$1,000,000 $15,000,000 |
EXHIBIT 2.5 Short Hedge Example
Profit from Futures = (160)(62,500 BP)($1.50/BP − fT)
Long Hedge
If a US economic entity has a future debt obligation or payment that it is required to pay in foreign currency, then it could hedge the dollar cost by taking a long currency futures or forward contract. To illustrate this hedge, consider a US company that owed £10,000,000, with the payment to be made in September. If the company believed that $/BP, exchange rate were more likely to increase, it could lock in the dollar cost of buying £10,000,000 by going long in a forward contract. In this case, the company would enter an agreement to buy £10,000,000 with a dealer in the interbank dealer’s market on a specified September delivery date at a forward price of, say, f0 = $1.50/BP. The company would have a long position with an agreement to buy and the dealer would have a short position with an agreement to sell. On the September delivery date, the fund would buy £10,000,000 on its forward contract from the dealer at f0 = $1.50/BP for $15,000,000 and then pay its £10,000,000 obligation. If the spot exchange rate at the September delivery date were greater than f0 = $1.50/BP, then the company would be pleased that it used the forward contract to lock in its $15,000,000 cost instead of buying BP on the spot. However, if the spot exchange rate at the September delivery date were less than f0 = $1.50/BP, then the company would be disappointed that it used the forward contract to lock in its $15,000,000 cost instead of buying the BP on the spot at the $/BP exchange rate.
Alternatively, the company could hedge the September dollar cost of buying £10,000,000 by going long in a September BP futures contract. Again, suppose September BP futures on the CME are trading at f0 = $1.50/£. To hedge its dollar cost, the company would need to go long in 160 BP contracts: nf = £10,000,000/62,500 BP = 160 BP contracts. Doing this, the company would, in turn, ensure itself of a $15,000,000 cost at the futures September expiration when it purchased the £10,000,000 at the spot $/BP exchange rate and closed its long futures contracts at futures prices equal to the spot exchange rate. This futures hedge can be seen in Exhibit 2.6. In the exhibit, the first row shows three possible spot exchange rates of $1.40, $1.50, and $1.60, the second row shows the dollar cost of buying £10,000,000 at the spot exchange rate of ET, the third row shows the profits and losses from the futures position, and the fourth row shows the constant hedged cost of $15,000,000 from the positions. If ET = $1.40/BP, the company pays only $14,000,000 for £10,000,000, but would have to pay $1,000,000 on its futures position; that is, the agreement to buy £10,000,000 (= (160)(62,500 BP)) September BPs at $1.50 is closed with an agreement to sell £10,000,000 (= (160)(62,500 BP)) of September BPs for $1.40/BP, resulting in a $1,000,000 payment to the clearinghouse. On the other hand, if ET = $1.60/BP, the fund pays $16,000,000 for £10,000,000, but it would receive $1,000,000 on its futures position; that is, the agreement to buy £10,000,000 (= (160)(62,500 BP)) September BPs for $1.50 is closed with an agreement to sell £10,000,000 (= (160)(62,500 BP)) September BPs for $1.60/BP, resulting in $1,000,000 in receipts from the clearinghouse. Thus, regardless of the spot exchange rate at the September expiration date, the fund pays $15,000,000.
| Initial Position: Long in 160 September BP futures contracts (size = 62,500 BP) at $1.50/BP to hedge dollar purchase of £10,000,000 in September. At Delivery:
|
|||
| Positions | Hedged Cost | ||
| (1) fT = ET (2) $ Cost: ET (£10,000,000) (3) Profit from Futures (4) Net Revenue = Row (2) − (3) |
$1.40/BP $14,000,000 − $1,000,000 $15,000,000 |
$1.50/BP $15,000,000 0 $15,000,000 |
$1.60/BP $16,000,000 $1,000,000 $15,000,000 |
EXHIBIT 2.6 Long Currency Hedge Example
Profit from Futures = (160)(62,500 BP)(fT − $1.50)
Hedging Risk
These examples represent perfect hedging cases in which certain revenues or costs can be locked in at a future date. In practice, perfect hedges are the exception and not the rule. As noted in Chapter 1, there are three types of hedging risk that preclude one from obtaining a zero risk position: quality risk, timing risk, and quantity risk.
Quality risk exists when the commodity or asset being hedged is not identical to the one underlying the futures contract. In hedging currency positions, there is usually no quality risk, but there can be timing and quantity risk. Timing risk would exist in our previous hedging cases if the manager or company needed to sell or buy BPs at a time different from the futures expiration. As noted in Chapter 1, the difference between the futures and spot price is called the basis (Bt). The basis tends to narrow as expiration nears, converging to zero at expiration (BT = 0).
Hedging International Investments
Portfolio managers often use currency futures and forward contracts to immunize their international portfolios against exchange rate risk. For example, suppose a US institutional investment fund that owned 10,000 shares of a French stock currently worth 100 euros per share wanted to hedge the dollar value of its investment. Suppose the $/€ spot and three‐month CME futures exchange rates are both $1.20/€ (or €0.8333/$), making the current dollar value of the stock worth $1,200,000 (= ($1.20/€)(10,000)(€100)). If the fund wanted to hedge the dollar value of its stock at the end of three months against exchange rate risk, it would need to go short in eight euro futures contracts (contract size is 125,000 euros):

If, at the end of three months, there is no change in the price of the French stock, then the futures‐hedged dollar value of the stock would be $1,200,000, irrespective of the spot $/€ exchange rate. If the $/€ decreased by 10% over the period from $1.20/€ to $1.08, then the dollar value of the stock also would decrease by 10% from $1,200,000 to $1,080,000; this decrease, though, would be offset by a $120,000 profit from the futures position: 8[125,000 euros][$1.20/€ − $1.08/€] = $120,000.
Hedging with currency futures or forward contracts allows international investors to focus on selecting stocks or portfolios, without having to worry about changes in the exchange rate. For instance, in the above example, if the price of the French stock increased by 5% from €100 to €105 at the same time the dollar appreciated by 10% against the euro, then an unhedged position would lose 5.5% in dollars:

If the position is hedged with eight euro futures contracts, though, the fund would receive a $120,000 futures profit and the rate of return on the currency‐hedged investment would be 4.5%:

Thus, the futures hedge allows the investor to profit from good stock selection.
It should be noted that the rate of return in dollars earned from the currency‐hedged stock in the previous example is less than the 5% increase in the stock price. This is because the hedge that was set up protects only the initial value; dividends and stock appreciation were not hedged against exchange rate risk. To also hedge stock price changes against exchange rate changes would require knowing the correlation between the changes in the exchange rate changes and the stock price.
Speculating with Foreign Currency Futures and Forward Contracts
Currency futures and forward contracts are used for speculating on expected changes in the spot exchange rate. In using currency futures or forward contracts, speculators can take either outright positions or intracommodity or intercommodity spreads with different currency futures.
Outright Positions
A speculator expecting an increase in the spot dollar price of a currency ($/FC) could take a long currency futures or forward contract. For example a US dollar investor who in June believed that the $/BP exchange rate would increase by September could go long in a September BP forward contract. Suppose the speculator entered an agreement to buy £10,000,000 from a dealer in the interbank market on a specified September delivery date at a forward price of, say, f0 = $1.50/BP. The speculator would have a long position with an agreement to buy and the dealer would have a short position with an agreement to sell. On the September delivery date, the speculator would buy £10,000,000 on her forward contract from the dealer at f0 = $1.50/BP for $15,000,000 and then sell the £10,000,000 on the spot market. If the speculator’s expectations were correct and the spot $/BP had increased to, say, $1.60/BP, then the speculator would realize a profit of $1,000,000 when she sold her £10,000,000 on the spot for $16,000,000. On the other hand, if her expectations were wrong and the spot $/BP had decreased to, say, $1.40/BP, then the speculator would realize a loss of $1,000,000 when she sold her £10,000,000 on the spot for $14,000,000.
A speculator expecting a decrease in the spot dollar price of a currency ($/FC) could take a short currency futures or forward contract. For example, if the US dollar investor in the preceding example believed in June that the $/BP exchange rate would decrease by September, she would go short in the BP forward contract, entering an agreement to buy £10,000,000 from a dealer in the interbank market on a specified September delivery date at a forward price of, say, f0 = $1.50/BP. On the September delivery date, the speculator would buy £10,000,000 on the spot market and sell the British pound on her forward contract to the dealer (at f0 = $1.50/BP) for $15,000,000. If the speculator’s expectations were correct and the spot $/BP had decreased to, say, $1.40/BP, then the speculator would realize a profit of $1,000,000 when she bought her £10,000,000 on the spot for $14,000,000 and sold them on the futures for $15,000,000. On the other hand, if her expectations were wrong and the spot $/BP had increased to, say, $1.60/BP, then the speculator would realize a loss of $1,000,000 when she bought her £10,000,000 on the spot for $16,000,000 and sold them on the forward for $15,000,000.
Alternatively, the speculator could take a position in a September BP futures contract listed on the CME. If she were bullish, she would go long in 160 BP contracts: nf = £10,000,000/£62,500 = 160 BP contracts at, say, at f0 = $1.50/BP. At the futures September expiration she would close her long futures contracts at a futures price equal (or approximately equal) to the spot exchange rate. This long speculative position is shown in Exhibit 2.7. In the exhibit, the first row shows three possible spot exchange rates of $1.40, $1.50, and $1.60 and the second row shows the profits and losses from the futures position. Thus, if the spot exchange rate equaled ET = $1.40/BP, our hedger would have to pay $1,000,000 to the clearinghouse; that is, the agreement to buy £10,000,000 (= (160)(62,500 BP)) September BPs at $1.50 is closed with an agreement to sell £10,000,000 (= (160)(62,500 BP)) September BPs for $1.40/BP, resulting in a $1,000,000 payment to the clearinghouse. On the other hand, if ET = $1.60/BP, our hedger would receive $1,000,000 on her futures position; that is, the agreement to buy £10,000,000 (= (160)(62,500 BP)) September BPs for $1.50 is closed with an agreement to sell £10,000,000 (= (160)(62,500 BP)) September BPs for $1.60/BP, resulting in a $1,000,000 receipt from the clearinghouse.
| Initial Position: Long in 160 September BP futures contracts (size = 62,500 BP) at $1.50/BP At Delivery: Close BP futures contracts by going short in 160 expiring September BP futures at fT = ET. |
|||
| Positions | Speculative Position | ||
| (1) fT = ET (2) Profit from Futures (160)(62,500 BP)((fT − $1.50)) |
$1.40/BP − $1,000,000 |
$1.50/BP 0 |
$1.60/BP $1,000,000 |
EXHIBIT 2.7 Long Speculative Currency Position
If the speculator were bearish, she would go short in 160 BP contracts: nf = £10,000,000/£62,500 = 160 BP contracts at, say, at f0 = $1.50/BP. At the futures September expiration, she would close her short futures contracts at a futures price equal (or approximately equal) to the spot exchange rate. This short speculative position is shown in Exhibit 2.8, which shows three possible spot exchange rates of $1.40, $1.50, and $1.60 and their corresponding profits and losses from the futures positions. In this case, if ET = $1.40/BP, the hedger would receive $1,000,000 from the clearinghouse; that is, the agreement to sell £10,000,000 September BPs at $1.50 is closed with an agreement to buy £10,000,000 September BPs for $1.40/BP, resulting in a $1,000,000 receipt from the clearinghouse. On the other hand, if ET = $1.60/BP, she would pay $1,000,000 on her futures position; that is, the agreement to sell £10,000,000 September BPs for $1.50/BP is closed with an agreement to buy £10,000,000 September BPs for $1.60/BP, resulting in a $1,000,000 payment to the clearinghouse.
| Initial Position: Short in 160 September BP futures contracts (size = 62,500 BP) at $1.50/BP At Delivery: Close BP futures contract by going long in 160 expiring September BP futures at fT = ET |
|||
| Positions | Speculative Position | ||
| (1) fT = ET (2) Profit from Futures: (160)(62,500 BP)(($1.50 − fT) |
$1.40/BP $1,000,000 |
$1.50/BP 0 |
$1.60/BP −$1,000,000 |
EXHIBIT 2.8 Short Speculative Position
Case: Speculating on the BP with Futures
Suppose on 5/26/2016, a dollar currency speculator expecting Britain to vote in favor of staying in the European Union took a long position in one December 2016 BP contract at $1.4688 (146.88 cents). The contract would require the speculator to buy 62,500 BP on 12/21/16 (see Bloomberg Description page and price graph in Exhibit 2.2). On the other hand, suppose another currency speculator expected Britain to vote to exit the EU and took a short position on 5/26/2016 in the December BP contract. The contract would require the speculator to deliver 62,500 BP for $1.4688 on 12/21/16. On 6/23/16, Britain voted to leave the EU and on 6/27/16 the December futures price had decreased to $1.3203/BP. If both the long and short speculators closed their outright position on 6/23/16, the long speculator would have incurred a loss of $9,281.25 from her long December British pound contract, while the short speculator would have realized a profit of $9,281.25 (see Exhibit 2.9).
| Clearinghouse Records for Long BP Speculator | |
| 5/26/16 6/27/16 Close |
Speculator agrees to buy 62,500 BP in December for $1.4688/BP Speculator agrees to sell 62,500 BP in March at $1.3203 Speculators pays clearinghouse $9,281.25 Closing payment to clearinghouse: 62,500 BP ($1.3203/BP − $1.4688/BP) = –$9,281.25 |
| Clearinghouse Records for Short BP Speculator | |
| 5/26/16 6/27/16 Close |
Speculator agrees to sell 62,500 BP in March for $1.4688/BP Speculator agrees to buy 62,500 BP in March for $1.3203/BP Clearinghouse pays short speculator $9,281.25 Closing Receipt from clearinghouse: 62,500 BP ($1.4688/BP − $1.3201/BP) = $9,281.25 |
EXHIBIT 2.9 Speculative Positions on December 2016 BP Futures, 5/26/16 to 6/27/16
Currency Futures Spreads
Instead of assuming the risk inherent in an outright futures position, speculators could reduce their exchange rate risk by forming intracommodity or intercommodity currency spreads. A US speculator who expects the $/BP exchange rate to change, for example, could form an intracommodity spread by taking a position in a nearby BP currency futures or forward contract and an opposite position in more deferred BP currency futures or forward contract. A speculator also could form an intercommodity spread by going long and short in different currency futures or forward contracts. For example, if a speculator expects the dollar price of both the euro and British pound to increase, she could form an intercommodity spread by going long in the currency with the greater exchange rate elasticity and short in the other currency.
Intracommodity Spread
As noted in Chapter 1, more distant futures contracts (T2) are generally more price sensitive to changes in the spot price, S, than near‐term futures contracts (T1):

Thus, a speculator who expects the price of a currency to increase in the future could form an intracommodity spread by going long in the longer‐term currency futures and short in a shorter‐term one. This type of intracommodity spread will be profitable if the expectation of the price increasing occurs. That is, the increase in the spot exchange causes the price on the longer‐term currency futures to increase more than the shorter‐term one. As a result, a speculator’s gains from his long position in the longer‐term futures will exceed his losses from his short position. If the spot price falls, though, losses will occur on the long position; these losses will be partially offset by profits realized from the short position on the shorter‐term contract. On the other hand, if a speculator believes the spot exchange rate will decrease but did not want to assume the risk inherent in an outright short position, he could form a spread with a short position in a longer‐term contract and a long position in the shorter‐term one. As we noted in Chapter 1, the speculator does not have to keep the ratio of long‐to‐short positions 1‐to‐1, but instead could use any ratio (2‐to‐1, 3‐to‐2, etc.) to obtain his desired return‐risk combination.
It should be noted that the difference in price sensitivity between shorter‐term and longer‐term futures prices may be minimal if the futures and spot prices are equal. This can be the case on currency futures when interest rates are equal in each country. Currency futures pricing is examined later in this chapter.
Intercommodity Spread
An intercommodity currency spread is formed with two futures contracts with the same expiration dates but on different currencies. In constructing intercommodity spreads, a spreader often makes use of the correlation between the underlying exchange rates. Exhibit 2.10 shows an estimated regression relation between the US dollar price of the Australian dollar (AUD) and the US dollar price of the British pound (BP). The slope of the regression line is ΔAUD/ΔGBP = 0.749. A currency speculator expecting the US dollar to depreciate (appreciate) with the US dollar price of the AUD and BP increasing (decreasing) could form an intercommodity spread by going long (short) in BP futures and short (long) in the AUD contract. Exhibit 2.11 shows the prices for a June 2016 AUD and BP futures contracts from 1/4/16 to 6/13/16. Suppose a speculator expecting the dollar to depreciate against some of the major currencies formed an intercommodity spread on 4/7/16 by going short in two June 2016 British pound contracts (contract size = 62,500 British pounds) at $1.4063 and long in one June 2016 AUD contract (contract size = 100,000 AUD) at $0.7485. From 4/7/16 to 4/26/16, the dollar did depreciate against a number of currencies, resulting in a 3.68% increase in the $/BP from $1.4063 to $1.458 and a 3.15% increase in the $/AUD from $0.7485 to $0.7721. If the spreader closed her intercommodity spread on 4/26/16, she would have realized a profit of $6,462.50 on her two long June British pound futures contract and a loss of $2,360 on her one short June AUD futures contract, resulting in a net gain of $4,102.50 (see Exhibit 2.12).

EXHIBIT 2.10 Regression Relation between British Pound (BP) and Australian Dollar (AUD)
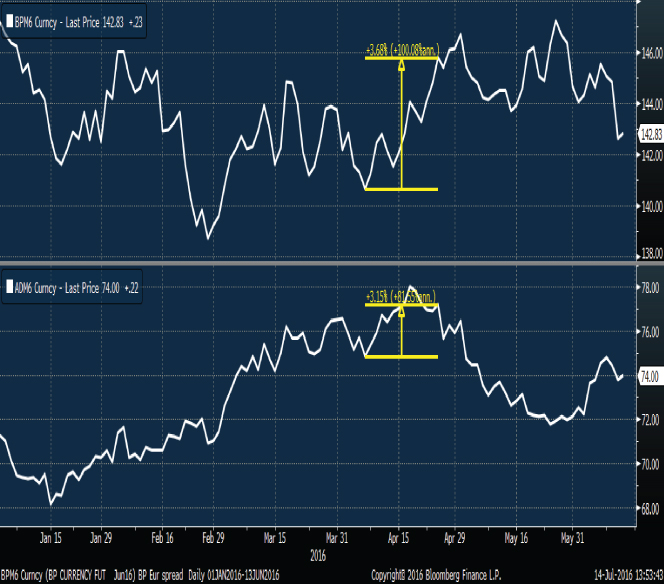
EXHIBIT 2.11 Prices on June 2016 BP Futures Contracts and June 2016 AUD Futures Contracts, 1/4/16 to 6/13/16
| Clearinghouse Records for Two Long June 2016 British Pound Futures Position | |
| 4/1/16 | Opening Position: Long two BP June futures contracts (contract size = 62,500 BP):
|
| 4/26/16 | Closing Position: Short two BP June futures contracts:
|
| Close | Speculator receives $6,462.50 from the clearinghouse: 125,000 BP ($1.458/BP − $1.4063/BP) = $6,462.50 |
| Clearinghouse Records for One Short June 2016 AUD Futures Position | |
| 4/1/16 | Opening Position: Short one June AUD futures contract (contract size = 100,000 AUD):
|
| 4/26/16 | Closing Position: Long one June AUD futures contract:
|
| Close | Speculator pays clearinghouse $2,360: 100,000 AUD ($0.7485/AUD − $0.7721/AUD) = −$2,360 |
| Net Position | |
| 4/26/16 | $6,462.50 − $2,360 = $4,102.50 |
EXHIBIT 2.12 Intercommodity Spread: Long in Two June 2016 BP Futures Contracts and Short in One June AUD Futures Contracts
The spreader probably regretted that she did not take an outright long position in the British pound where she would have realized a $6,462.50 gain. Her long position in Australian dollars, however, was taken to give her some protection if the dollar price of the BP and AUD decreased. The spread provides the speculator a lower return opportunity but also lower risk than the outright position. Moreover, as noted in Chapter 1, many different spreads, each with different return‐risk combinations, can be formed by changing the ratio of long to short positions.
Hedging and Speculating with Equivalent Money Market Positions
Hedging Currency Positions Using the Money Market
Instead of forward or futures contracts, financial and nonfinancial companies can also hedge their positions by using a money market position. For example, the US company in our long hedging example with the September £10,000,000 liability could lock in an effective dollar cost of buying the BP by creating a BP asset worth £10,000,000 in September and a US dollar liability in September. To see this, suppose the company can borrow dollars at 3% and invest BP at 3%, the spot exchange rate is $1.50/£ or £0.6667/$ and the September payment date is one year from the present. To fix its dollar cost, the company would need to borrow $14,563,106.80 (the present value of $15,000,000 = PV($15,000,000) = PV[(£10,000,000)($1.50/BP)] = $15,000,000/1.03), convert at £0.6667/$ to £9,708,737.86, and invest at 3%. One year later, the company would have £10,000,000 (= £9,708,737.86 (1.03)) from its BP investment that it could use to cover its £10,000,000 debt, and it would owe $15,000,000 (=$14,563,106.80 (1.03))—the same dollar obligation it had by hedging with the long futures or forward contracts.
By contrast, the investment fund in our short hedge case with the £10,000,000 September principal receipt could hedge the dollar value of its receipt by creating a £10,000,000 liability and a dollar asset. For example, suppose the trust can invest dollars at 3% and borrow BP at 3%, the spot exchange rate is $1.50/£, and the September receipt date is one year from the present. To fix its dollar revenue, the company would need to borrow £9,708,737.86 (PV(£10,000,000 ) = (£10,000,000)/1.03), convert to $14,563,106.80 (= ($1.50/£) £9,708,737.86), and invest at 3%. One year later, the company would owe £10,000,000 (= £9,708,737.86 (1.03)) from its BP loan that it would pay with its £10,000,000 Eurobond principal revenue, and it would receive $15,000,000 (= $14,563,106.80 (1.03)) from its dollar investment—the same dollar revenue it had by hedging with the short future contracts.
Money market positions are useful for hedging currency position with long‐term horizons that are not possible with futures contracts whose original maturities may only go out two years. For example, in the previous case, a short hedger who wanted to lock in dollar value of converting £10,000,000 in, say, five years, could hedge the currency position by borrowing the present value of £10,000,000 for five years (£10,000,000/(1.03)5 = £8,626,087.84), converting to dollars (($1.50/BP)(£8,626,087.84) = $12,939,131.77), and then investing the dollars for five years. At the end of five years, the BP cash inflow (£10,000,000) would exactly cover the BP debt (£8,626,087.84)(1.03)5 = £10,000,000 and the dollar investment would be worth $15,000,000 (= ($12,939,131.77)(1.03)5). Such five‐year hedging again would not be possible with BP futures contracts with maturities only going out two years. It is possible, however, that a hedger could find a dealer in the interbank forward market to offer a tailor‐made five‐year contract.
Speculating with Equivalent Money Market Positions
Instead of speculating on the spot exchange rate using futures or forward contracts, a speculator can alternatively use the money market. For example, suppose our currency speculator in our previous example expected the $/£ rate to increase in one year from its current $1.50/£ level (or £0.6667/$), and he could borrow dollars at 3% and invest BP at 3%. To speculate on a $/£ exchange rate increase, the speculator could borrow $14,563,106.80, the present value of $15,000,000 (PV($15,000,000) = $15,000,000/1.03), convert at 0.6667£/$ to £9,708,737.86 and invest the BPs at 3%. One year later, the speculator would have a £10,000,000 investment (= £9,708,737.86 (1.03)) and $15,000,000 debt (= $14,563,106.80 (1.03)). If the spot $/BP rate increased from $1.50 to, say, $1.60/BP, then the speculator would gain $1,000,000 when he converts his £10,000,000 at $1.60/£ to $16,000,000 and pays his $15,000,000 debt. However, if the spot rate decreased from $1.50 to, say, $1.40/BP, then the speculator would lose $1,000,000 when he converts his £10,000,000 at $1.40/£ to $14,000,000 and pays his $15,000,000 debt (see Exhibit 2.13). This is the same profits and loss scenarios that he would have realized by speculating with long positions in futures and forward contracts.
Initial Position:
Closing Position one year later:
|
|||
| Positions | Speculative Position | ||
| (1) fT = ET (2) BP Investment (3) Conversion: (£10,000,00)(ET) (4) $ Debt (5) Net Position: (3) − (4) |
$1.40/BP £10,000,000 $14,000,000 $15,000,000 −$1,000,000 |
$1.50/BP £10,000,000 $15,000,000 $15,000,000 0 |
$1.60/BP £10,000,000 $16,000,000 $15,000,000 $1,000,000 |
EXHIBIT 2.13 Long Speculative Position Using Money Market
Suppose our currency speculator expected the $/£ rate to decrease in one year from its current $1.50/£ level (or £0.6667/$), and he could borrow BP at 3% and invest dollars at 3%. To speculate on the $/BP exchange rate decrease using the money market, the speculator would borrow £9,708,737.86 (PV(£10,000,000) = (£10,000,000)/1.03), convert to $14,563,106.80 (= ($1.50/£) £9,708,737.86) and invest the dollars at 3%. One year later, the speculator would have a $15,000,000 investment (= $14,563,106.80 (1.03)) and a £10,000,000 debt (= £9,708,737.86 (1.03)). If the spot $/BP rate decreased from $1.50 to, say, $1.40/BP, then the speculator would profit by $1,000,000 when he buys £10,000,000 at $1.40/BP for $14,000,000 and pays his £10,000,000 debt and collects $15,000,000 from his dollar investment ($15,000,000 = $14,563,106.80(1.03)). However, if the spot rate increased from $1.50 to, say, $1.60/BP, then the speculator would lose $1,000,000 when he buys £10,000,000 for $16,000,000 at $1.60/BP and receives only $15,000,000 from his dollar investment (see Exhibit 2.14). This is the same profit‐and‐loss scenario that he would have realized by speculating with short positions in futures and forward contracts.
Initial Position:
Closing Position one year later:
|
|||
| Positions | Speculative Position | ||
| (1) fT = ET (2) BP debt (3) Conversion: (£10,000,00)(ET) (4) $ Investment (5) Net Position: (4) − (3) |
$1.40/BP £10,000,000 $14,000,000 $15,000,000 $1,000,000 |
$1.50/BP £10,000,000 $15,000,000 $15,000,000 0 |
$1.60/BP £10,000,000 $16,000,000 $15,000,000 −$1,000,000 |
EXHIBIT 2.14 Short Speculative Position Using Money Market
Money market positions are useful for speculating on change in exchange rate occurring over a long‐term horizon that the maturity of futures contracts does not provide. For example, in the previous case, a speculator expecting the $/BP to increase over the next five years could borrow dollars for five years, convert to pounds, and then invest the pounds for five years, hoping at the end of five years the $/BP exchange was greater than $1.50. Such five‐year speculative positions would not be possible with BP futures contracts with maturities only going out two years. It is possible, however, that a speculator could find a dealer in the interbank forward market to offer a tailor‐made five‐year contract.
Arbitrage Opportunities
It should be noted that in the above cases, speculating with the money market positon yielded the same possible cash flows as the forward or futures position taken with a futures price of f0 =$1.50. Note that in our example, if the futures price did not equal f0 = $1.50, then there would be an arbitrage opportunity by taking opposite positions in the futures and money market. For example, if f0 < $1.50, then an arbitrageur could earn a riskless profit by going long in the futures position at f0 < $1.50 and taking the short speculative money market position. As shown in Exhibit 2.15, if f0 = $1.45/BP, an arbitrageur would realize a cash flow of $500,000 one year later, regardless of the exchange rate. On the other hand, if f0 > $1.50, then an arbitrageur could earn a riskless profit by going short in the futures position at f0 > $1.50 and taking the long speculative money market position. As shown in Exhibit 2.16, if f0 = $1.55/BP, an arbitrageur would realize a cash flow of $500,000 one year later, regardless of the exchange rate. Moreover, arbitrageurs by exploiting these arbitrage opportunities when f0 does not equal $1.50 by their actions (going long when f0 < $1.50 and short when f0 > $1.50), will push the price of the BP currency futures to f0 = $1.50. At $1.50, the arbitrage is zero. Thus, $1.50 is the equilibrium futures price. As we will examine in more detail in the next section, the equilibrium price of futures and forward contracts is determined by arbitrage relations similar to this currency case.
Initial Position:
Closing Position One Year Later:
|
|||
| Positions | Speculative Position | ||
| (1) fT = ET (2) Profit from Futures: (160)(62,500 BP)((fT − $1.45) (3) BP Debt (4) Conversion: (£10,000,00)(ET) (5) $ Investment (6) Net Position: (2) + (5) − (4) |
$1.40/BP −$500,000 £10,000,000 $14,000,000 $15,000,000 $500,000 |
$1.50/BP $500,000 £10,000,000 $15,000,000 $15,000,000 $500,000 |
$1.60/BP $1,500,000 £10,000,000 $16,000,000 $15,000,000 $500,000 |
EXHIBIT 2.15 Arbitrage when f0 < $1.50: Long Futures and Short Money Market Position
Initial Position:
Closing Position One Year Later:
|
|||
| Positions | Speculative Position | ||
| (1) fT = ET (2) Profit from Futures: (160)(62,500 BP)(($1.55 − fT)) (3) BP Investment (4) Conversion: (£10,000,00)(ET) (5) $ Debt (6) Net Position: (2) + (4) − (5) |
$1.40/BP $1,500,000 £10,000,000 $14,000,000 $15,000,000 $500,000 |
$1.50/BP $500,000 £10,000,000 $15,000,000 $15,000,000 $500,000 |
$1.60/BP −$500,000 £10,000,000 $16,000,000 $15,000,000 $500,000 |
EXHIBIT 2.16 Arbitrage when f0 > $1.50: Short Futures and Long Money Market Position
Carrying‐Cost Model for a Currency
In international finance, the carrying cost model governing the relationship between spot and forward or futures prices is referred to as the interest rate parity theorem (IRPT). In terms of IRPT, the forward price of a currency or forward exchange rate is equal to the cost of carrying the spot currency (priced at the spot exchange rate of E0) for the contract’s expiration period.
In terms of a US dollar position, carrying a foreign currency for the period (T) would require borrowing E0/(1+ RF)T dollars at the rate RUS, where RF is the foreign risk‐free rate (the rate paid on foreign currency), converting the dollars to 1/(1+ RF)T units of foreign currency (FC) at the spot exchange rate of E0, and investing the currency in the foreign risk‐free security yielding RF. At the end of the period, this arbitrage would yield one unit of FC and a debt obligation of [E0/(1+ RF)T](1+ RUS)T. Thus, the forward or futures price of purchasing one unit of currency at T should not be different from the debt obligation or net financing cost of carrying the currency. Thus, the equilibrium forward or futures price or exchange rate is

or in terms of continuously compounded US and foreign annualized risk‐free rates:
These equations define IRPT. The equation, in turn, shows that the relation between the forward or futures rate and the spot rate depends on the relative levels of domestic and foreign interest rates. If the interest rate parity condition does not hold, an arbitrage opportunity will exist. The arbitrage strategy to apply in such situations is known as covered interest arbitrage (CIA). Introduced by John Maynard Keynes, CIA involves taking long and short positions in the currency spot and forward or futures markets, as well as positions in the domestic and foreign money markets. To illustrate, suppose the annualized US and foreign currency interest rates are RUS = 4% and RF = 6%, respectively, and the spot exchange rate is E0 = $0.40/FC. By IRPT, a one‐year future contract would be equal to $0.39245283/FC:

If the actual (market) forward rate, f0M, exceeds $0.39245283/FC, an arbitrage profit would exist by: (1) borrowing dollars at RUS, (2) converting the dollar to FC at E0, (3) investing the FC in a foreign risk‐free rate at the rate RF, and (4) and entering a short futures contract to sell the FC at the end of the period at F0M. For example, if F0M = $0.40/FC, an arbitrageur could:
- Borrow $40,000 at RUS = 4% [creating a loan obligation at the end of the period of $41,600 = ($40,000)(1.04)].
- Convert the dollars at the spot exchange rate of E0 = $0.40/FC to 100,000 FC (= (2.5FC/$)($40,000)).
- Invest the 100,000 FC in the foreign risk‐free security at RF = 6% [creating a return of principal and interest of 106,000 FC one year later].
- Enter a futures contract to sell 106,000 FC at the end of the year at F0M = $0.40/FC.
One year later, the arbitrageur would receive $42,400 when she sells the 106,000 FC on the futures contract and would owe $41,600 on her debt obligation, for an arbitrage return of $800. Such risk‐free profit opportunities, in turn, would lead arbitrageurs to try to implement the CIA strategy. This would cause the price on the futures contract to fall until the riskless opportunity disappears. The zero arbitrage profit would occur when the interest rate parity condition is satisfied.
If the futures rate is below the equilibrium value, then the CIA is reversed. In this example, if F0M = $0.38/FC, an arbitrageur could:
- Borrow 100,000 FC at RF = 6% [creating a 106,000 FC debt].
- Convert the 100,000 FC at the spot exchange rate to $40,000.
- Invest the $40,000 in the US risk‐free security at RUS = 4%.
- Enter a futures contract to buy 106,000 FC at the end of the year at f0M = $0.38/FC.
At the end of the period, the arbitrageur’s profit would be $1,320:
As arbitrageurs attempt to implement this strategy, they will push up the price on the futures contract until the arbitrage profit is zero; this occurs when the interest rate parity condition is satisfied.
Hedging Interbank Forward Contracts
Banks that provide forward contracts to their customers typically use the IRPT to hedge their contracts by taking a position in the spot markets. For example, given RUS = 4%, RF = 6%, and E0 = $0.40/FC, a bank could offer a one‐year forward contract at F0 = $0.39245283/FC, then hedge the contract by using a CIA strategy. For example, if a bank’s customer wanted to buy 10,000,000 FC one year from the present, then the bank could provide the customer with a forward contract in which the bank agrees to sell forward 10,000,000 FC to the customer at the end of one year for $3,924,528. To hedge this short forward position, the bank, in turn, could:
- Borrow $3,773,585 (= (10,000,000 FC/1.04)($0.39245283)).
- Convert the $3,773,585 to 9,433,962 FC (= $3,773,585(2.5FC/$)).
- Invest the 9,433,962 FC for one year at RF = 6%.
One year later, the bank would have 10,000,000 FC (= 9,443,962(1.06)) and would owe $3,924,528 (= $3,773,585(1.04)), which would exactly offset the bank’s forward position.
On the other hand, if a bank’s customer wanted to sell 10,000,000 FC one year from the present, then the bank could provide the customer with a forward contract in which it agrees to buy forward 10,000,000 FC to the customer at the end of one year for $3,924,528. To hedge this long forward position, the bank would reverse the previous strategy: Borrow 9,433,962 FC at 6%, convert to $3,773,585, and invest in US security at 4%. At the end of one year, the bank would have $3,924,528 and would owe 10,000,000 FC, which would offset its long forward position.
In hedging their forward contracts, banks are in a position in which they can take care of any mispricing that occurs if the forward price does not satisfy the interest rate parity condition. By taking advantage of such opportunities, they would push the forward price to its equilibrium level.
Currency Futures Prices
Note that a sufficient condition for futures and forward prices to be equal is for short‐term interest rates to be constant over time. In the case of currency futures and forward contracts, the requirement for equality is for both the foreign and domestic short‐term rates to be constant. If this occurs, then, theoretically, the IRPT can be extended to determining the equilibrium futures exchange rate; if these rates are not stable, though, then the interest rate parity model would be only an estimate of the equilibrium futures price. Empirically, several studies comparing currency futures and forward exchange rates have found no significant differences between them. Thus, even with market imperfections such as taxes and transaction costs, the IRPT appears to be a good description of what determines both the forward and futures exchange rates.
Pricing a British Pound Futures Contract
Exhibit 2.11 shows the prices on the June 2016 British pound from 1/4/16 to 6/13/16 (expiration date on the contract). On 3/14/16 the three‐month US dollar deposit rate (USDRC <Curncy>) was 0.5392% and the British pound three‐month deposit rate (GBP3M <Curncy>) was 0.57%. Using a 30‐day, 360‐day day‐count convention, the maturity on the June futures (6/13/16) would have been T = 90/360 = 0.25 on 3/14/16. The spot $/BP was $1.4302 on 3/14/16. Using the carrying‐cost model, the equilibrium price of the June BP futures contract on 3/14/16 would have been $1.4301:

The actual futures price on the June BP contract on 3/14/16 was also $1.4301.
It should be noted that when interest rates on the two currencies are equal, then the futures price will be equal to the spot. Thus, the only minimal difference between the spot and futures price, is due to the small difference between the rate paid on dollars and the rate paid on BP.
Investment Uses of Interest Rate Parity Theorem
In addition to determining the equilibrium currency futures or forward price, investors and borrowers can also use the IRPT to define the cutoff expected spot exchange rate for determining whether they should invest or borrow domestically or internationally. To illustrate, consider our earlier example where RUS = 4% and RF = 6%, E0 = $0.40/FC, and f0 = $0.39245283/FC. If an investor knew with certainty that the exchange rate one year later would be f0 = $0.39245283/FC, then she would be indifferent to an investment in a one‐year US risk‐free security yielding 4% and a one‐year foreign risk‐free security yielding 6%. If the US investor, however, were certain that the spot exchange one year later would exceed $0.39245283/FC, she would prefer to invest her dollars in the foreign security rather than the US one. For example, if a US investor knew the spot exchange rate one year later would be E(ET) = $0.41/FC, then she would prefer the foreign investment, in which a rate of 8.65% could be earned, instead of the US security, which earns only 4%. To attain 8.65%, the investor would have to convert each of her investment dollars to 1/E0 = 1/$0.40/FC = 2.5 FC and invest the 2.5 FC at RF = 6%. One year later, the investor would have 2.65 FC (= 2.5FC(1.06)), which she would be able to convert to $1.0865 if the spot exchange rate were $0.41/FC. Thus, the dollar investment in the foreign security would yield an expected dollar rate of 8.65%.

On the other hand, if a US investor expected the exchange rate would be less than $0.39245283/FC, then she would prefer the US risk‐free investment to the foreign one. For example, if E(ET) = $0.39/FC, then the US investor would earn only 3.35% from the foreign investment compared to 4% from the US investment:

The example suggests that in a world of certainty, the equilibrium forward rate as specified by the IRPT can be used to define the expected cutoff exchange rate, E(ETc), needed to determine if one should invest in a domestic or risk‐free security:

In a real world of uncertainty in which futures spot exchange rates are unknown, however, the required cutoff rate depends on investors’ attitudes toward risk. For example, if investors were risk‐neutral, then they would require no risk premium and their required expected rate from the risky investment would be equal to the risk‐free investment. In this case, the cutoff exchange rate for investors would be the equilibrium forward rate. However, if investors were risk‐averse, as we would expect, then the required expected rate from the risky investment would have to exceed the risk‐free rate. This would require that investors’ cutoff exchange rate exceed the forward rate. For example, if risk‐averse US investors required an annualized 2% risk premium (RP) in order to invest in a foreign security, then the expected cutoff exchange rate would be $0.40/FC:

Thus, if investors are risk averse, then E(ET) would have to be greater than f0 for them to invest in the foreign security that is subject to exchange rate risk instead of the domestic investment.
Cross‐Exchange Rate Relations
The cross exchange rate defines the relationship between different exchange rates. For example, on 7/14/16, the spot BP/dollar (BP/$) exchange rate was 0.7499625 BP/$ (US dollar/BP rate = $1.3334/BP) and the Australian dollar/US dollar (AUD/$) was 1.31027 AUD/$ ($/AUD = $0.7632). Given BP/$ and AUD/$ rates, the equilibrium BP/AUD exchange rate would have to be 0.572 BP/AUD and the AUD/BP rate would have to be 1.748 AUD/BP.

This carry‐cost price, in turn, equals the actual BP/AUD price on 7/14/16 of 1.748 AUD/BP and 0.572 BP/AUD.
If the actual BP/AUD exchange rate were not equal to 1.748 BP/AUD or 0.572 AUD/BP, then an arbitrage strategy, defined as triangular arbitrage, could have been exploited to earn riskless profit. For example, suppose the BP/AUD exchange rate were 0.60 BP/AUD on 7/14/16. An arbitrageur with a position in dollars could earn a riskless return of $0.048 for each dollar invested using this approach:
- Buy 1.31027 AUD with $1.
- Convert the 1.31027 AUD to 0.786162 BP: (1.31027 AUD)(0.60 BP/AUD) = 0.786162 BP.
- Convert the 0.786162 BP to $1.048: (0.786162 BP)($1.3334/BP) = $1.048.
By executing this triangular arbitrage strategy, the arbitrageur would be buying BP with AUD, which would push the BP/AUD exchange rate toward 0.572. On the other hand, if the BP/ADU exchange rate were at 0.55 (or 1.8182 AUD/BP), an arbitrageur could earn a riskless return of $0.04 for each dollar invested using this approach:
- Buy 0.7499625 BP for $1.
- Convert the 0.7499625 BP to 1.36358 AUD: (0.7499625 BP)(1.8182 AUD/BP) = 1.36358 AUD.
- Convert the 1.36358 AUD to $1.04: (1.36358 AUD)($0.7632/AUD) = $1.04.
These actions, in turn, would serve to push the BP/AUD exchange rate up toward 0.572.
Conclusion
The flexible exchange rate system makes it necessary for multinational corporations, international investors, and international organizations to deal with the problems of exchange‐rate risk. To this end, forward contracts on the interbank market and futures contracts on the exchanges have provided these entities with a relatively effective exchange rate risk‐reduction tool. In this chapter, we have examined the markets, the hedging and speculative uses, and the pricing of these contracts.
Selected References
- Branson, W. “The Minimum Covered Interest Differential Needed for International Arbitrage Activity.” Journal of Political Economy (December 1979): 1029–1034.
- Cornell, B. “Spot Rates, Forward Rates, and Exchange Market Efficiency.” Journal of Financial Economics (August 1977): 55–65.
- Huang, R. “Some Alternative Tests of Forward Exchange Rates as Predictors of Future Spot Rates.” Journal of International Money and Finance (August 1984): 153–178.
- Johnson, R. Stafford. Introduction to Derivatives: Options, Futures, and Swaps. Oxford: Oxford University Press, 2009, Chapter 14.
- Johnson, R., Hultman, C., and Zuber, R. “Currency Cocktails and Exchange Rate Stability.” Columbia Journal of World Business 14 (Winter 1979): 117–126.
- Madura, J., and Nosari, E. “Utilizing Currency Portfolios to Mitigate Exchange Rate Risk.” Columbia Journal of World Business (Spring 1984): 96–99.
- Panton, D., and Joy, M. “Empirical Evidence on International Monetary Market Currency Futures.” Journal of International Business Studies (Fall 1978): 59–68.
- Swanson, P., and Caples, S. “Hedging Foreign Exchange Risk Using Forward Exchange Markets: An Extension.” Journal of International Business Studies (Spring 1987): 75–82.
Problems and Questions
- Given the following:
- E0 = $1.50/BP
- F0 = $1.50/BP (one‐year forward contract)
- RUS = 2% (annual)
- RBP = 2% (annual)
- Explain how you would speculate on the BP using the forward market if you expected the spot exchange rate to be $1.60/BP one year from now.
- Explain how you would speculate on the BP using the money market if you expected the spot exchange rate to be $1.60/BP one year from now (assume you can borrow and lend at RUS = RBP = 2%).
- Explain how you would speculate on the BP using the forward market if you expected the spot exchange rate to be $1.40/BP one year from now.
- Explain how you would speculate on the BP using the money market if you expected the spot exchange rate to be $1.40/FC one year from now (assume you can borrow and lend at RUS = RBP = 2%).
- Mr. B just signed a contract to play professional basketball in Mexico for the Mexican Stars. The team owner has agreed to pay his living expenses for two years and an annual salary of 2,000,000 pesos, with 1,000,000 pesos to be paid one year from the present and the second‐year 1,000,000 pesos to be paid two years from the present. Mr. B plans to play two years, then return to the United States. He would like to hedge the dollar value of his contract. Currently, the spot $/peso exchange rate is $0.05/peso and the Mexican risk‐free rate is 6% (annual), the US risk‐free rate is 2%. Forward rates offered by US and Mexican banks are governed by the IRPT.
- Explain how Mr. B could hedge the dollar value of his salary using forward contracts.
- Suppose Mr. B could not find a bank to provide him with a forward contract. Explain how he could alternatively hedge his salary against exchange rate risk by using the money market. Assume Mr. B can borrow pesos at 6% and can invest dollars at 2%.
- The Nancy Jewelry Company is a US company with jewelry stores located across the United States. In March, the company signs a contract with Swiss Watch, Inc. to purchase 100,000 watches the following March (T = 1 year) at the cost of 30SF per watch, with the payments to be made at the time of the March delivery. Currently, US and Swiss risk‐free interest rates are both at 2% (annual), the $/SF spot exchange rate is $1.10/SF, and the $/SF forward rates and the CME futures rate are governed by the IRPT.
- Explain how the Nancy Jewelry Company could hedge its dollars cost of the watches against exchange rate risk using forward contracts.
- Explain how the Nancy Jewelry Company could hedge its payment next March by using the money market. Assume it can borrow and lend dollars and Swiss francs at 2%.
- Explain how the Nancy Jewelry Company could hedge its March payment by taking a position in the CME’s SF futures contract (contract size is 125,000 SF). Evaluate the hedge at possible spot exchange rates at the March expiration of $1.20/SF and $1.00/SF. Assume the watch payment occurs at the same time as the futures expiration and the expiring futures price is equal to the spot.
- Suppose ESPN (Disney) is expecting revenues of 6,250,000 BP next April (one year from now: T = 1) from its United Kingdom Rugby sports productions division. Fearing that exchange rates could decrease when it converts its 6,250,000 BP, ESPN would like to hedge the dollar value of its revenue. Currently, the spot $/£ exchange rate is $1.50/£, the US risk‐free rate is 3%, the British risk‐free rate is 3%, and the one‐year forward rate offered by US and British banks is determined by the IRPT.
- Explain how ESPN could hedge the dollar value of its revenue using a forward contract.
- Explain how ESPN could alternatively hedge its revenue of 6,250,000 BP against exchange‐rate risk by using the money market. Assume ESPN can borrow BPs at 3% and dollars at 3%.
- Suppose in April, the BP futures contract trading on the CME is at $1.50/£ (contract size = 62,500 BP). Show how ESPN could hedge its revenue against exchange‐rate risk by using the contract expiring next April. Assume that at the futures expiration, ESPN will close its futures position at an expiring futures price equal to the spot exchange rate and convert its BP revenue at the spot exchange rate. Evaluate the position by assuming possible spot $/£ exchange rate at expiration of $1.45/£ and $1.55/£.
- Suppose Fox Sports owes the United Kingdom Rugby Association 12,500,000 BP as payment for the exclusive licensing right to produce Rugby matches on the European and US cable markets. Suppose the licensing payment is due next May (one year from now: T = 1). Fearing that exchange rates could increase when it buys the pounds, Fox would like to hedge the dollar cost of buying the currency. Currently, the spot $/£ exchange rate is $1.50/BP, the US risk‐free rate is 3%, the British risk‐free rate is 3%, and the one‐year forward rate offered by US and British banks is determined by the IRPT.
- Explain how Fox Sports could hedge the dollar cost of purchasing BP using a forward contract.
- Explain how Fox Sports could alternatively hedge its 12,500,000 BP purchase against exchange‐rate risk by using the money market. Assume ESPN can borrow and lend BP at 3% and dollars at 3%.
- Suppose in May, the BP futures contract trading on the CME is at $1.50/£ (contract size = 62,500 BP). Show how Fox could hedge its BP cost against exchange‐rate risk by using the contract expiring next May. Assume that at the futures expiration, Fox will close its futures position at an expiring futures price equal to the spot exchange rate and buy its BP at the spot exchange rate. Evaluate the position by assuming possible spot $/£ exchange rate at expiration of $1.45/£ and $1.55/£.
- A US investor just bought one share of Heineken stock for 200 euros when the dollar/euro spot exchange rate was $1.20/€. The investor expects the stock to pay a dividend worth 5 euros and to appreciate by 10% one year from now.
- Calculate the one‐year expected rate of return on the stock for an investment made in euros.
- Calculate the possible one‐year expected rates of return on the stock in terms of a dollar investment. Assume possible end‐of‐the‐year exchange rates of $1.05/€, $1.10/€, $1.15/€, $1.20/€, and $1.25/€.
- If the US risk‐free rate were 7% (annual) and the Netherlands risk‐free rate on euros were 5%, what would be the one‐year forward rate a bank could provide the investor if it provides forward contracts based on the IRPT?
- What would be the investor’s possible expected rates of return if she hedged the dollar price of the stock (€200) by going short in a forward contract as determined by the IRPT? Evaluate at possible exchange rates of $1.05/€, $1.10/€, $1.15/€, $1.20/€, and $1.25/€.
- Suppose the spot US dollar/euro exchange rate is $1.20/€, the US risk‐free rate is 4% (annual) and the rate paid on euros is 2%.
- Assuming the IRPT holds, what should the equilibrium 1‐year $/€ forward rate be?
- Suppose a US bank provides one of its business customers with a forward contract in which the customer agrees to sell to the bank 12 million euros one year later at a forward price equal to IRPT. Assuming the bank can borrow and lend dollars and euros at the above risk‐free rates, explain how the bank would hedge its forward position.
- Explain the type of forward contract the bank would provide the business customer and how it would hedge the contract if the business customer wanted to buy 12 million euros one year later.
- Explain why a risk‐neutral investor would be indifferent between a one‐year US dollar investment in a risk‐free security at 3% and a one‐year British pound investment at 5% if the investor expected the $/£ spot exchange rate one year later to equal the forward rate as determined by the IRPT. In your explanation, assume the current spot exchange rate is $1.50/BP.
- Suppose the US investor in Question 8 were risk averse, instead of risk neutral, and wants a risk premium of 1% (annual) for assuming the exchange‐rate risk on the international investment.
- Find the expected spot exchange rate that would make the risk‐averse investor indifferent between the US and British risk‐free investments.
- Demonstrate that the investor would earn that return if this expected exchange rate is realized.
- Given the following euro and British pound spot exchange rates: 0.80€/$1 and 0.70 £/$1:
- What is the equilibrium £/€?
- Describe the triangular arbitrage strategy a US arbitrageur would pursue if the BP price of a euro were 0.90£/€.
- Describe the triangular arbitrage strategy a US arbitrageur would pursue if the BP price of a euro were 0.85£/€.
Bloomberg Exercises
- Select a currency of interest (use SECF (SECF <Enter>); Category: Currencies, Spots tab. Upload the currency’s Menu screen (Ticker <Curncy> <Enter>), and evaluate it using the following screen:
- DES: Description
- GP: Price Graph
- FXFR: Spots/Forwards Monitor
- FXFA: FX‐Interest Rate Arbitrage
- FRD: FX Forward Calculator
- CN: News: Currency
- Use the SECF screen to find the tickers for a select currency’s spot exchange rate, deposit rates, forward rates, and futures: SECF <Enter>; Category: “Currencies,” type in currency name in the amber “Name” box and select tabs: Spots, Depos, Fwds, and Futr. Upload the menu screens for a selected spot exchange rate (e.g., GBP <Curncy> for BP/$ spot rate), deposit rates (e.g., BPDRC <Curncy> for BP 3‐month deposit rate), forward rate (e.g., GBP3M <Curncy> for 3‐month British pound forward rate), and futures (e.g., BPA <Curncy> for BP/$ active futures). On each of the menu screens, analyze some of its screens (e.g., DES and GP).
- Access Bloomberg information for a CME‐listed currency futures contract: Type CTM to bring up the “Contract Table Menu,” click “Categories” and “Currencies,” search for CME currency futures on the Menu (type CME in the amber Exchange box), find the CME currency of interest and bring up the contract’s menu screen (Ticker <Curncy>; e.g., BPA <Curncy> for British pound futures), and then use the Expiration screen (EXS) to find the ticker for the contract with the expiration month you want to analyze (Ticker <Curncy>; e.g., BPH7 <Curncy> for the March 2017 contract). View screens to examine: DES and GP.
- Using the GP screen, examine the historical prices of the currency futures contract you selected in Exercise 3. Select a time period that the contract was active.
- Select a period in which you would have taken a long position and calculate the profit from opening and closing at the futures prices at the beginning and ending dates for your selected period. Calculate the losses if you had taken a short position.
- Select a period in which you would have taken a short position and calculate the profits from opening and closing at the futures prices at the beginning and ending dates for your selected period. Calculate the losses if you had taken a long position.
- Using the annotation bar, apply the “% Change” tool to calculate the percentage change for your select periods, and then click the “News” icon on the annotation bar to find relevant news events on or preceding the opening date.
- Examine the spot exchange rate for the period that your futures contract was active. The ticker for the index can be found on SECF. Use the Chart screen (Chart <Enter>) to create multigraphs for the prices on the futures contract and the spot exchange rate. On the Chart Menu screen, select Standard G chart; once you have loaded your securities, go to “Edit” to put your graphs in separate panels.
- Using the Bloomberg HRA Regression screen estimate the relation between two currencies. Load your selected currency (e.g., GBP <Curncy> for the British pound), and then go to the HRA screen for the regression. On the HRA screen, enter the other currency as the independent variable in the amber box (e.g., AUD <Curncy>) and select the time period and periodicity (daily).
- Comment on the regression results and the relation (beta).
- Explain how you would form bullish and bearish intercommodity spreads with the futures contracts on the underlying currencies.
- Using the Chart screen (Chart <Enter>), examine the intercommodity spread you formed in Exercise 5. Note than the contracts have to have the same expiration.
- Use the Chart screen (Chart <Enter>) to create multigraphs for the index futures contracts. On the Chart Menu screen, select Standard G chart; once you have loaded your securities, go to “Edit” to put your graphs in separate panels.
- Select a period in which you would have taken a bullish spread position and calculate the profit you would have realized from opening and closing at the futures prices at the beginning and ending dates for your selected period. Calculate the losses if you had taken a bearish intercommodity position.
- Select a period in which you would have taken a bearish spread position and calculate the profit you would have realized from opening and closing at the futures prices at the beginning and ending dates for your selected period. Calculate the losses if you had taken a bullish position.
- Using the annotation bar, apply the “% Change” tool to calculate the percentage change for your select periods, and then click the “News” icon on the annotation bar to find relevant news events on or preceding the opening date.
- Examine an ex‐post long hedging position for a future currency purchase.
- Select a futures contract and use the expiration date on the futures contract as the date of your purchase.
- Use the Chart screen (Chart <Enter>) to create multigraphs for the prices on the futures and spot exchange rate. On the Chart Menu screen, select Standard G chart; once you have loaded your futures and currency, go to “Edit” to put your graphs in separate panels.
- Select a beginning date that you would have implemented your hedge and a closing date near the futures expiration as the date for purchasing the currency and closing your hedge. Calculate the profit or loss on the futures position from opening and closing at the futures prices at the beginning and ending dates, the cost of purchasing the currency on the closing date, and the hedged cost (currency purchase minus futures profit). Compare your hedged cost to the unhedged cost. In retrospect, was the hedge a good strategy?
- Examine an ex‐post short hedging position for a future currency sale.
- Select a futures contract and use the expiration date on the futures as the date of your sale.
- Use the Chart screen (Chart <Enter>) to create multigraphs for the prices on futures and spot exchange rate. On the Chart Menu screen, select Standard G chart; once you have loaded your futures and currency, go to “Edit” to put your graphs in separate panels.
- Select a beginning date that you would have implemented your hedge and a closing date near the futures expiration as the date for the currency sale and closing your hedge. Calculate the profit or loss on the futures position from opening and closing at the futures prices at the beginning and ending dates, the revenue from selling the currency on the closing date, and the hedged revenue (currency sale plus futures profit). Compare your hedged revenue to the unhedged revenue. In retrospect, was the hedge a good strategy?
- Select a currency exchange rate with the dollar (GBP <Curncy> for BP), a futures contract on the currency (e.g., British pound expiring in approximately three months), the deposit rate on the currency (e.g., GBP3M <Curncy> for a three‐month deposit rate on BP), and the deposit rate on the US dollar (e.g., USDRC <Curncy> for three‐month US dollar rates) that matches the maturity (e.g., three months) of your selected futures. Using the selected deposit rates, calculate the carrying‐cost price of the futures. How close is it to the actual price?