CHAPTER 2
Digital Marketing Analytics
By Matt Bailey
Analytics. I've seen people literally cringe when that word is spoken. For some reason, analytics has become one of the most misunderstood, yet the most valuable of all digital skills. In this chapter, not only will I show you that analytics don't have to be intimidating, but I'll provide you with a working framework to apply in any organization. Because chances are, when going into a new position with your OMCA credentials, you may be one of the only people on your team with any formal training or understanding of analytics.
One of the reasons that analytics is so misunderstood is that most formal marketing education lacks even the basics of data measurement and analytics. It takes a while for the education system to catch up to digital marketing, and when it does, it's still years behind. Most marketers that I meet in large agencies, brands, or in the small to medium business (SMB) space have never had any analytics training.
The other aspect is that most analytics training courses get far more complicated than they ever need to be. Instructors quickly dive deep into predictive analytics or concepts that most markets will never need. Analytics becomes this out‐of‐reach idea that would be nice to know, but impossible to attain.
Let's take a different approach. It takes one singularly important skill to unlock analytics. And this skill is available to anyone but should be even more proficient for marketers. With this skill, analytics not only comes alive, but it transforms organizations.
The skill? Asking questions.
By the end of this chapter, you will know about the following:
- Aligning your analytics to organizational objectives and goals
- Defining key components of a useful KPI
- How data are collected
- Defining segments in analytics
- Important analytics terminology and concepts
My Analytics Journey
In the mid‐1990s, I built a website to market and sell commercial real estate properties. Back then, this was a minor part of my real estate business, but the only way that I could reach an international audience. I learned so much from this experience. For starters, my background in journalism helped me in developing my website, writing content, and designing the pages. It was then that I realized that I was ranking highly in the search engines. I had learned SEO by applying the same techniques that were used to lay out newspapers and seeing the benefits as my rankings increased and business grew.
One night, I sat down to work on the website, but I only had 2 hours available. It was at that moment that my analytics journey was born with THE QUESTION: “What is the most profitable thing that I can do with my time?” But I didn't have an answer to that question. I realized that I must have the answer in order to prioritize my sales and marketing activities! Otherwise, it was all guesswork and gut instinct. I researched and added analytics to my site and connected it to my sales tracking. What I found astonished me and changed my entire marketing career. I found that big numbers lie.
I was getting thousands of visits a month from search engines, which also contributed more than 95 percent of my conversions (visitors who completed a lead form). If I were making marketing decisions based on those numbers, then I would increase my efforts at rankings—because those numbers were huge! But that finding wasn't answering the question. THE QUESTION was one of profitability, not visits, and not conversions.
Digging deeper, I connected the search‐driven leads to sales to find how much revenue I could attribute to search. And wow, was I in for a shock! Search, which created hundreds of thousands of visits, which contributed significantly more visits and leads than any other source—created no revenue. That's right. None. Zero. Zilch. Big numbers lie.
When I dug into the 2 percent—those that came from other sources—that's when I found my eureka moment. People who came from links on other sites—which was a result of my PR campaign to gain more visibility—converted at a lower rate, but those conversions turned into sales. Those 2 percent of link‐clicking visitors were responsible for 90 percent of sales. I finally had my answer to THE QUESTION.
What was most profitable? Old‐fashioned public relations and networking.
- Getting my press out to other websites in the industry and creating relationships
- Getting my links on other websites that reached more qualified prospects
- Working leads from these qualified sources more than search leads
As I said earlier, this changed my approach to digital marketing from then on. To quote Peter Drucker, “If it cannot be measured, it cannot be managed.” It was all about asking and answering THE QUESTION. But as I was to find out over the next 20+ years in digital marketing, most companies don't even know what THE QUESTION is.
THE QUESTION is what drives the organization. It is the central business outcome from the strategy. For example, there is a world of difference if the goal of the organization is to increase leads as opposed to increase profitability. Each goal requires a specific set of measurements to answer and address that goal. If an organization's goal is to increase leads, then the accompanying measurements will focus on performance data that surround that conversion point, such as sources of leads, numbers of leads, and conversion rates.
Conversely, if an organization is focused on increasing profitability, then measurements will not only focus on performance, but on the financial aspects of each channel, of campaigns, and even business processes that can be optimized to increase efficiency and reduce spend.
The goal of the organization defines the measurements that will be needed because it is in the context of answering the question. Because of this, analytics is not the same for every organization. Based on your or your organization's goal, you'll need to define the data you need and then analyze it according to the intended outcome. This is what makes analytics unique, relevant, and exciting.
Company goals define analytics, not the other way around. If the goal is to increase leads or to reach a certain number of leads entering the pipeline per month, then you have defined the most important measurements to evaluate the success of that goal, the number of leads gained each month. You'll know if you are successful by comparing the number leads gained to the number of leads desired. Simple, right?
However, if you want to implement a company goal to reduce the cost of a lead, then what you need to measure (and where you go to find the data) changes substantially. Now your analysis requires you to track the process of gaining the lead, tracking the investment through each source, channel, and campaign, while developing metrics to compare the cost per lead. Once that is done, then decisions must be made about where to spend the budget to maintain that lower cost per lead.
Analytics Start with Goals
Let's start with a very simple table and flow to establish analytics.
In the first column of Table 2.1, I start with defining the primary goal or objective of the organization. In this example, I use increase revenue. Now I start building the expectations and the comparative metrics. For any measurement to be useful, it must have a comparison. If increase revenue is my goal, then I must know the answer to these questions: (1) What is the current revenue? (2) Did revenue increase? (3) By how much?
What you have now is the beginnings of an analytics measurement model. I've defined the business outcome, then I defined the two questions that are essential for answering the objective. This also gives you the foundation of a simple dashboard that will provide the immediate information that you need to assess the progress toward the goal.
The next stage is to examine the primary goal further and examine the ways that it can be realized. In what ways can the organization increase revenue? If you really think about this stage, you'll realize that this isn't just a marketing question. It's a business question that may bring you back to the four Ps of marketing (Product, Price, Place, Promotion), as each of these has an impact on revenue!
TABLE 2.1 Marketing Analytics Measurement Model; Stages 1 and 2
| Business Objective | Activities That Increase Revenue |
|---|---|
| Increase Leads Average number of leads/number of leads (baseline) Leads gained (compare) $ impact on revenue | |
| Increase Revenue What is the current revenue? Amount of revenue increase/decrease | Increase Lead to Sale Rate Current lead to sale rate (baseline) Measured lead to sale rate +/‐ sale rate – why? $ impact on revenue |
| Increase Customer Purchases/Purchase Amounts Average/cumulative/YTD purchases/purchase amounts (baseline) Increased purchase and purchase amount $ impact on revenue |
Usually at this point, I have to keep marketers focused on this question. Too many times, marketers want to immediately jump into making videos for TikTok, without making the time investment into formulating a strategic approach. They get to the social media fun, but to do it correctly requires the thoughtful groundwork of planning and defining measurable results.
Now what increases revenue? Initially, I can propose three events that increase revenue: increasing leads, increasing the lead‐sale rate, and increasing the number of sales and the average amount of purchases. While I've presented this in a B2B context, you could easily apply this to other types of business. For an ecommerce business, it can be increasing the number of customers, increasing the average sale amount, increasing the number of sales, and decreasing customer churn. All these activities increase revenue. Once these are defined, you then identify the relevant measurements for each.
Once you start to develop a linear view of the activities you are also defining the relevant measurements required for each stage. The last point in each of the activities is there to refocus the measurements back to the primary business objective—what is the impact of that activity on revenue? That important detail can't be left out because it answers the question! What you'll start to notice at this stage is that the more you define the important measurements, you should know where to go to gain that information. It won't always be in your analytics. In fact, through this activity, some companies realize that they aren't capturing the critical business data that answer these questions!
For those who report data, this will streamline your approach and create a clear dashboard of critical information. I've heard many times from marketers that because they don't know what data are important, they just include all they can find!
In this case, if you are creating the report, you can disregard the charts, tables, and extraneous data that don't report the impact on revenue! Focus on the relevant measurements that answer the big question first: Did you increase revenue? Then, if the management or stakeholders want to know how or why, you can provide that data. But for most cases, when you report data, they only want an answer to the question. Be sure that you know the question before you create that report.
The next stage of this process (shown in Table 2.2) is to develop the strategy to meet the objective. Match the corresponding strategy that will meet the activities needed to increase revenue. For example, to increase leads, you need to implement a customer acquisition program. To increase the lead to sale rate, you need to optimize the nurturing process through the CRM and sales contacts. To increase the number and value of sales, you need to develop promotions and positioning for upsell, cross‐sells or other incentives. Again, you list the relevant activities in this stage and the corresponding measurements that can be applied.
Then, you finally get to the marketer's dream—start talking about channels, content, and media. But you still have to be structured about this. The next stage is again defining how the strategy will be executed. In this stage I recommend defining the media or content that needs to be created for the activities that will drive the strategy. For example, for an inbound strategy I will define the primary media or content as webinars and research papers that act as lead magnets. In this case, I use webinars and research papers while also including the relevant measurements that tie back to the objective. As you can see in Table 2.3, the media and content measurements can easily be expanded, but here I am focusing on maintaining a clear line back to the business objective.
TABLE 2.2 Marketing Analytics Measurement Model, Stage 3
| Business Objective | Activities That Increase Revenue | Strategy |
|---|---|---|
| Increase Leads Average number of leads/number of leads (baseline) Leads gained (compare) $ Impact on revenue | New Customer Acquisition Inbound/content marketing # leads gained by channel $ revenue by channel # leads gained by campaign $ revenue by campaign | |
| Increase Revenue What is current revenue? Amount of revenue increase/decrease | Increase Lead to Sale Rate Current lead to sale rate (baseline) Measured lead to sale rate +/‐ Sale rate – why? $ Impact on revenue | Nurture (CRM and Sales) |
| Increase Customer Purchases/Purchase Amounts Average/cumulative/YTD purchases/purchase amounts (baseline) Increased purchase and purchase amount $ Impact on revenue | Promotions and Positioning |
The next stage (shown in Table 2.4) gets to the tactical marketing activities that consume most of a marketer's time and attention. These are the activities of developing a campaign that will target an audience, drive clicks, result in conversions, and meet the objectives of the campaign. It is this stage where massive amounts of data are produced because each channel and tactic create an overwhelming amount of information. At this stage, simply define the most important data you need to answer the questions in the previous stage. For example, from the co‐branded email campaign, how many webinar registrations were captured? Then, how many of those registrations became leads?
TABLE 2.3 Marketing Analytics Measurement Model, Stage 4
| Business Objective | Activities That Increase Revenue | Strategy (What) | Media and Content (How) |
|---|---|---|---|
| Increase Leads Average number of leads/number of leads (baseline) Leads gained (compare) $ Impact on revenue | New Customer Acquisition Inbound/content marketing # leads gained by channel $ revenue by channel # leads gained by campaign $ revenue by campaign | Webinars # webinar registrations # attended #leads generated $ estimated value of leads | |
| Research Papers # of new leads $ estimated value of leads | |||
| Increase Revenue What is current revenue? Amount of revenue increase/decrease | Increase Lead to Sale Rate Current lead to sale rate (baseline) Measured lead to sale rate +/‐ Sale rate – why? $ Impact on revenue | Nurture (CRM and Sales) | |
| Increase Customer Purchases/Purchase Amounts Average/cumulative/YTD purchases/purchase amounts (baseline) Increased purchase and purchase amount $ Impact on revenue | Promotions and Positioning |
TABLE 2.4 Marketing Analytics Measurement Model, Stage 5
| Business Objective | Activities That Increase Revenue | Strategy (What) | Media and Content (How) | Channel and Tactic (Where) |
|---|---|---|---|---|
| Increase Leads Average number of leads/number of leads (baseline) Leads gained (compare) $ Impact on revenue | New Customer Acquisition Inbound/content marketing # leads gained by channel $ revenue by channel # leads gained by campaign $ revenue by campaign | Webinars # webinar registrations # attended #leads generated $ estimated value of leads | Email (co‐branded+list) | |
| Search Ads | ||||
| Display Ads | ||||
| Social Ads | ||||
| Research Papers # of new leads $ estimated value of leads | SEO—Organic Search | |||
| Email (co‐branded+list) | ||||
| Social (Organic and Paid) | ||||
| Increase Revenue What is current revenue? Amount of revenue increase/decrease | Increase Lead to Sale rate Current lead to sale rate (baseline) Measured lead to sale rate +/‐ Sale rate – why? $ Impact on revenue | Nurture (CRM and Sales) | ||
| Increase Customer Purchases/Purchase Amounts Average/cumulative/YTD purchases/purchase amounts (baseline) Increased purchase and purchase amount $ Impact on revenue | Promotions and Positioning |
The data produced by each channel and tactic are important—for those people working on those tactics. It is not always relevant or important to the decision‐makers in the organization who are setting the strategy. They want to know the “bottom line” of the results that were produced. Maintaining a clear view of each stage provides a clear view of the activities in play and their impact on the purpose. At any stage and at any time, you can view this chart and the corresponding measurements and know which areas are lagging and which areas are producing the intended results. This is what creates a data‐centric organization.
Where Do the Data Come From?
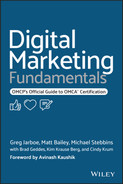
To navigate this complex world of overwhelming amounts of data, you need to know where they come from and the nature of the information. To put it in simple terms, the data start with people using your website or app. Their actions are captured, processed, and reported by a machine that sees everything in 1s and 0s. Literally, a computer is attempting to capture, understand, and communicate human behavior on a digital interface (website/app). Just think about how ridiculous that sounds. Yet, that's not the end of it! We now, as humans, are attempting to decode those charts, graphs, and reports that are given to us by these machines. See Figure 2.1.
Your job is to decode the data into meaningful information that explains what the humans (the visitors) were attempting to do on your websites and how that translates into business objectives! If that sounds overwhelming, it is! You are attempting to understand (on a machine) what data machines gather about human behavior (while they are on a machine), and there is nothing simple about that!
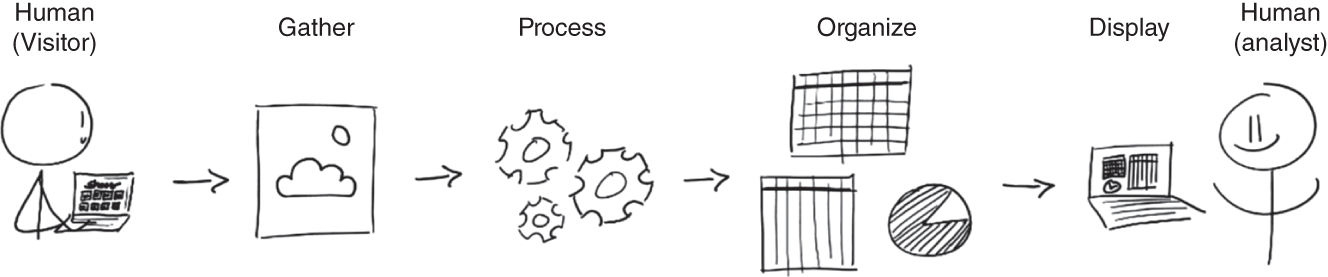
FIGURE 2.1 The Analytics Collection, Processing, and Reporting Process
Gathering the Data
The first step is to capture and collect visitor activity on your website. In the past, the server where a website was hosted would maintain a log of every page request. Of course, this was called the log file. Every request would be collected and timestamped. A page request, while sounding simple, could be highly complex. An HTML page is simply a file that contains a set of instructions and text. These instructions also provide the links to find the other necessary elements to assemble the page. Images, scripts, forms, and other elements are kept in separate files but assembled in the browser when someone requests the page. The HTML acts as the base canvas with the instructions of where to find all the necessary elements, how to assemble them, and how the page will function. Each request to the server is called a “hit.” So, if a page is requested (one request) that has 10 images, 7 scripts, and 2 forms, it generates an additional 19 requests (or hits) to the server. Each of those requests is logged and timestamped in sequential order.
As you could imagine, once you start getting thousands of visits a day, the file would grow substantially. As the Internet became busier and more people going online, maintaining these log files on servers required more space than hosts were willing to provide. The response was to create a hosted version of the log file and provide analytics from the data. Now, the hosted service needed a method to gather the data because it wasn't connected to a website's hosting server. So began JavaScript tagging.
Just a warning that this next paragraph is going to get technical. There are three methods of implementing JavaScript tracking:
- The first is through an inline HTML tag. It is used to track a single click or a download, and it is not recommended. It increases download time for the page, which can negatively impact your rankings.
<a OnClick="ga('send', 'social', 'Linkedin', 'Share',window.location.href);">…</a> - Next is embedded JavaScript, which runs on the visitor's browser. It is identifiable by the
<script>tag (the<script>tag does not includesrc):<script>Window.dataLayer = window.datalayer ||[];Function gtag(){dataLayer.push(arguments);}Gtag("js",new Date());Gtag("config", "UA-123456");</script> - Finally, External JavaScript uses the
<script>tag and includessrc, which enables it to run in the background, apart from other scripting commands. This is used by Google Tag Manager to collect visitor data:<script async src=https://www.googletagmanager.com/gtag/js?id=UA-123456-xx></script
What Data Does Analytics Script Collect?
That's the billion‐dollar question. Google realized that the data they collect was their biggest asset because they use it to match advertisers to visitors based on the visitor's browsing history. Google's annual revenue from selling advertising will be more than $300 billion by the time this book is published.
For starters, when a page is requested, there is an exchange of information called the HTTP protocol. (Hey, recognize that!?!) Before the page is loaded into the browser, your computer engages in a very formal exchange of introductions. This is first initiated by the HTTP header, which transmits this data:
- Cookies (Google): For Google Analytics to track the user between sites
- IP address
- Device type
- Operating system and version
- Browser and browser version
- Referrer: URL of the current page with the link
- Language: Language and region of the requested website
- Date and time: Every request is timestamped
- Host: Domain name of the requested file
Other data are also collected:
- Screen resolution
- Screen size
- Screen colors
- Client size
- Viewport size
- Performance data
- Plugins
- Top sites (bookmarks)
Other data are also utilized in Google Analytics. Some may be captured in analytics, some by other methods, as Google also owns the Chrome browser, which also transmits user data to Google. You know that these tags collect a massive amount of data, and Google does not offer a list of the full amount or types of data collected by its analytics script.
The development of cloud computing provided a perfect method for capturing and analyzing all this data. To be usable, these data have to be collected and processed, and it takes tremendous computing power to process millions of lines of activity to organize, synthesize, and report the data. Analytics providers employ data sampling to balance the computing time with the need for immediate access to standard reports. For large sites, it would simply take too long to crunch 100 percent of the data and provide it in an on‐demand format. Sampling the data extrapolates the trends from the sample to provide the standard reports. Analytics owners can change the settings to choose a higher amount of data to be sampled. Obviously, if you see that 10 percent or less of your data are being used to create the reports, you know that there will be some major inaccuracies. For example, changing the preferences to greater precision rather than a faster response will create a larger dataset for sampling, but also take a bit more time in creating the report.
How Accurate Are the Data?
Let's just get this out there. There is no such thing as 100 percent accuracy in analytics.
While the data collection methods look impressive and capture a lot of data, there is still a lot of processing and interpretation that must be done with the raw data. Remember, you're dealing with humans and human behavior. How many times have you switched devices when researching a vendor or shopping? Let's say you start shopping while at work, maybe looking for a gift for someone. You cover a lot of ground by searching on Google for gift ideas and browse four or five websites. Later, at lunch, you think about one of the ideas, and you take out your phone and type in one of the websites that you remember. Of course, the ad for that brand is the first result, so rather than scrolling down, you click the ad, go to the site, find the product and spend time reading more about it, maybe even looking at a few of the videos about the product. Now, later that night, you are at home, and you decide to purchase. You go to your home computer, because you might feel more comfortable with the checkout procedure on the big screen, as most people of a certain age do. You type in the website URL, go directly to the website, then to the product, and you've completed the checkout in only a few minutes.
To you, this seems normal and nothing out of the ordinary. That's because you're thinking of this in human terms. In machine terms, here is a typical interpretation of your behavior in analytics:
- New visitor: Source: Google (Organic search), IP address xxx.xx.xx.xxx, device:desktop, pages viewed=12, time on site=6:25
- New visitor: Source Google (Paid Search), IP address: yyy.yy.yy.yyy, device:mobile/iPhone, pages viewed=3, time on site=3:20
- New visitor: Source: Direct, IP address: zzz.zz.zz.zzz, device:desktop, pages viewed=3, time on site=2:45, GOAL: Checkout purchase
In machine terms, you appear to be three separate visitors. This is because analytics is tied to the device. By tracking the device type, IP address (location), browser types, and identifying information this separates activities when using multiple devices. Now this can be overcome by personalizing each device for tracking. This is exactly what Google attempts to do when you login to your Google account on different devices. Google (and Facebook) attempts to unify your devices to know what you use, when you use it, and combine that data into a unified capture of the person rather than the devices. So, how do you share everything that you do to provide a complete record of your online activities to Google? Then use Google's Chrome browser on your devices, while logged into your Google account, and using websites with Google Analytics installed. Google will record everything that you do and track as much data as they can from your browsing behavior! If you aren't comfortable with this, you can mitigate the data collection by using different browsers while logged out of your accounts.
Analytics programs run on algorithms, just like search engines. The algorithms are simply rules applied to the interpretation of the data. Primarily, these rules define how to interpret certain events or data and classify it accordingly. As an example of this, have you ever left your computer overnight while your browser and a dozen or so tabs were open? Well, the analytics algorithm must figure out when exactly you left the website. This is the timeout. Some timeouts are after 20 minutes of inactivity (inactivity is defined as the time elapsed since the last request made to the server). How do you come up with a time‐on‐site calculation when there is no definitive exit action? All time‐on‐site calculations are based on estimates of behavior and the algorithm's rules to calculate this metric.
But what about the next morning? You awaken your computer, click on the browser, and the tabs reload all the web pages? According to the analytics algorithm, you've started another session! Even though you might only reload the tab and then not get to that website for another hour, you've since timed out again. Once you begin interacting with the website in that tab, you'll start another session, which will count the pages you request and the time on site. If you finally convert by purchasing something or filling out a form, the analytics will suggest that you did this on the third or fourth visit, which were generated by a direct visit to the website. But in your mind, it's been the same visit, with a few hours or days in between each interaction that was originally generated from a search query.
This is the issue with accuracy. It's machines and algorithms attempting to classify and report human behavior on websites, which is completely unpredictable. Every analytics program has its own method of addressing these behavioral question marks, which is why you'll never find agreement among different analytics providers. They all have different algorithms that interpret the behavior according to their rules.
Accuracy in Attribution
Here's the final way that accuracy is up for interpretation. Let's take the earlier example of multiple visits to a website. But let's also assume that the analytics has tracked these visits as being from the same visitor. It would look like this:
- Visit 1: Source: Google (Organic search), IP address xxx.xx.xx.xxx, device: PC, pages viewed =12, time on site=6:25
- Visit 2: Source: Google (Paid Search), IP address: yyy.yy.yy.yyy, device: iPhone, pages viewed=3, time on site=3:20
- Visit 3: Source: Direct, IP address: zzz.zz.z.zzz, Device: PC, Pages viewed=3, time on site=2:45, GOAL: Checkout purchase
The default setting in just about every analytics program is called last‐click attribution. This means that the source of the visitor who met the goal in that session gets 100 percent of the credit for the conversion or the goal completion. Because of this, Google Analytics 4 changed drastically to report first touch, or first user medium, which favors search and paid search channels.
In this example, the goal completion was the last session, which the visitor initiated by going to the website directly. This means that a direct visit gets 100 percent of the credit for the sale or conversion. Do you think that is right?
The visitor first found the website through organic search, then performed a brand name search and clicked on the ad in the second visit, and then decided to purchase in the last visit. So, which source should have the attribution? Should the first since it was responsible for getting the visitor there in the first place? Should the second, because it showed that the visitor remembered the brand name? Or are you correct in giving the final source the full credit?
The answer will depend on your question. If you are evaluating the effectiveness of your marketing in driving customers, then you will want to focus on those first‐touch sources and measure their effectiveness in ultimately driving conversions. In this case, you would change to a first‐click attribution model. This would change the data completely to emphasize the sources and channels that are responsible for the first interaction with those visitors that would later become customers.
However, if you are evaluating multi‐channel effectiveness in attracting, nurturing, and converting, then you would want to see all the channels that influence the outcome—from beginning to end. You would accomplish this by using a linear attribution model that gives each source equal credit for the conversion. This would change the data again, enabling you to see which channels contribute the most toward engaging visitors and nurturing them to become customers or leads. Without an understanding of the attribution models and how they affect the data, most beginners to analytics are making decisions based on last‐click data, which neglects the first‐touch channels that are instrumental in gaining new visits or influencing their decisions.
Additional Data Sources and Tracking
When marketing through third‐party platforms, such as Facebook, Instagram, LinkedIn, or even email, you may not receive all of the data you need. There are additional methods of capturing tracking, such as UTM code, which appends to a link and provides clearer data about the visit. In addition, your analytics data may need to be supplemented with additional platform data, such as Google Ads, Facebook, and others.
UTM Codes UTM codes are additional tracking codes that you can append to your campaign links. You can identify specific campaigns and campaign channels and view them as separate line items in your analytics. By the way, UTM stands for Urchin Tracking Module, used by Urchin Software Corporation. Urchin was acquired by Google in 2005 and rebranded as Google Analytics.
You implement UTM codes in your campaign links manually, and you can use one of the many UTM Builders available online. The UTM code in a link looks like this:
https://mydomain.com/landingpage?utm_campaign=freetrialoffer&utm_medium=social&utm_source=linkedin
utm_campaign=freetrialoffer: Identifies the campaignutm_medium=social: Identifies the type of medium, such as email, social, display, etc.utm_source‐linkedin: Identifies the specific source where the link will be placed
Other UTM codes provide even more information, but these are the basics that are used in most campaigns. When evaluating your visits from different sources, these campaigns will show alongside the sources, providing a specific comparative view of your campaigns compared to regular traffic.
This is especially helpful to track activity and keep it separate from other types of campaigns or other sources. Tracking links in email campaigns enables you to see what people are clicking on and how they interact with your site after the click‐through.
Platform Data Analytics tracks the visitors to your website and what they do while they are there. The limitation to this is when you use other platforms to drive visits to your website. There is a lot of campaign activity that takes place on the other platforms (Facebook, Instagram, TikTok, Snapchat, LinkedIn, Pinterest, email, etc.) in order to get the visit. Analytics tracks the visitors once they get to your site and usually reports which platform delivered them, but much of the data of what they did on that third‐party platform is not in your analytics.
Each third‐party platform that you use generates its own measurements. Creating campaigns on Facebook and Instagram, Google, LinkedIn, TikTok, or even sending emails through an ESP (email service provider) creates measurements that are specific to each platform. Those measurements won't necessarily pass through to your analytics, so they need to be integrated or tracked as part of your overall campaign measurements. At least with Google, you still take manual steps to integrate your Google Ads with your Google Analytics. Otherwise, your campaign data are in two separate sources. Integrating the two enables you to see the initiation of the campaign data alongside the website activity that results from that visit.
The importance of this is to know which platforms are not only delivering visitors to your website, but also to measure the effectiveness of that platform in delivering visitors that convert and provide business value. The platforms themselves can't report conversions; they only report activity metrics such as views or impressions, likes or approval actions, shares, and comments. If you are buying ads on the platform, you'll get additional metrics such as CPM (cost per mille), click‐through rates, and costs. These are activity metrics that provide feedback about the “engagement” of people on the platform, but they need to connect with your website or app analytics to track the ultimate business outcome of sales, leads, or other conversions.
Analytics Compared to Surveys and Research Analytics is different from other sources of business data. When conducting research, organizations typically rely on surveys, questionnaires, focus groups, or even interviews of their target market. These are all legitimate forms of research and provide great data that can be used to formulate strategy, adjust targeting or messaging, or even create new products.
Analytics is different because it records behavior in real time. While someone may say that something is important, or that they have a preference, we often find that their actual behavior online is amazingly different. Analytics captures what people actually do rather than what they say they will do. It also captures the transaction rather than the intention. For example, when asked, “How did you find our website?” people may respond that they found the site from search, from social media, or from a friend. Analytics will report exactly how and when the first visit was generated. It does not rely on memory, influence, or the environment of the survey.
I always like to point people to the book Everybody Lies by Seth Stephens‐Davidowitz. Basically, people lie in nearly every aspect of life. But they lie even more in surveys, polls, questionnaires, and interviews. The only place where people tell the truth is the search bar on Google. And in analytics.
Competitive Intelligence I've always found it interesting that there is a persistent fear that competitors are always doing better. I've met too many business owners or managers who start with that assumption. Because the competitor's website has the latest bells and whistles, because it's prettier, and because it has that new AI chat thingy—they must be doing better than us! So, to answer a typical question about analytics: no, you can't see other company's analytics. Unless you have been given access, it isn't possible.
I've had to explain this numerous times. You can't judge how successful a business is simply based on the design, attractiveness, or function of a company's website! You can find many tools online that will provide some external, objective measurements, such as estimated visits, rankings, links to the website, and words they are bidding on. But again, those are all external factors. You have no way of knowing how many sales or leads they are generating. You don't know how much they are following up on those business leads, or even if they are competently managing them. Even more to the point, you don't know their profit margin. They could be outspending you significantly to get those leads, but then losing money in the long run. You just don't know.
Navigating Data: Concepts and Terminology
When people log into their analytics, I've seen their heads spin. They are confronted with an overwhelming amount of charts, graphs, and data tables, along with a new language. The language of analytics! In this section, I break down the language and terminology of analytics into understandable concepts and discuss how it applies to marketing campaigns. Remember, you are ultimately attempting to understand people and their behavior! The terms you encounter will be attempting to describe some form of human interaction or behavior.
The ABCs of Analytics
Now let's get into the basics of understanding data. To build your foundation of understanding any analytics program or report, just follow the ABCs.
| A: Acquisition | Where did the people come from? |
| B: Behavior | What did they see and do? |
| C: Conversion | How much is it worth? |
This is analytics and the purpose of analytics at its core. You are answering questions of WHAT happened, WHY it happened, and HOW to make decisions from what happened. You can only get to the data by breaking it into the essential elements of what you want to know.
A: Acquisition Acquisition tracks where people come from. Here are the primary channels visitors use:
- Search (organic and paid). These are people who made a search and clicked on your website in the results. They either clicked on the organic results or on a paid ad if you are running a campaign.
- Direct. This means that the visitor typed in your website address in their browser or has it bookmarked in their favorites. With autocomplete in the browser, it makes this method much easier for people to remember the websites they visited.
- Referral. These visitors clicked on a link to your website while on another website. If a blog or a news site mentioned you and had a link alongside your business name, people who clicked that link are called referrals. Think of it like a word‐of‐mouth referral. Similarly, someone recommended your business by linking to it.
- Social. This category covers nearly every social media platform that is known in analytics.
- Email. Any email campaigns you send with analytics tracking will show the subsequent websites visits generated by the email.
- Other. Sometimes, referrer data aren't passed to analytics. If the referrer can't be determined, it gets dumped into the catch‐all of Other.
- UTM campaigns. If you set up UTM links, they will show up in your acquisition reports alongside these categories.
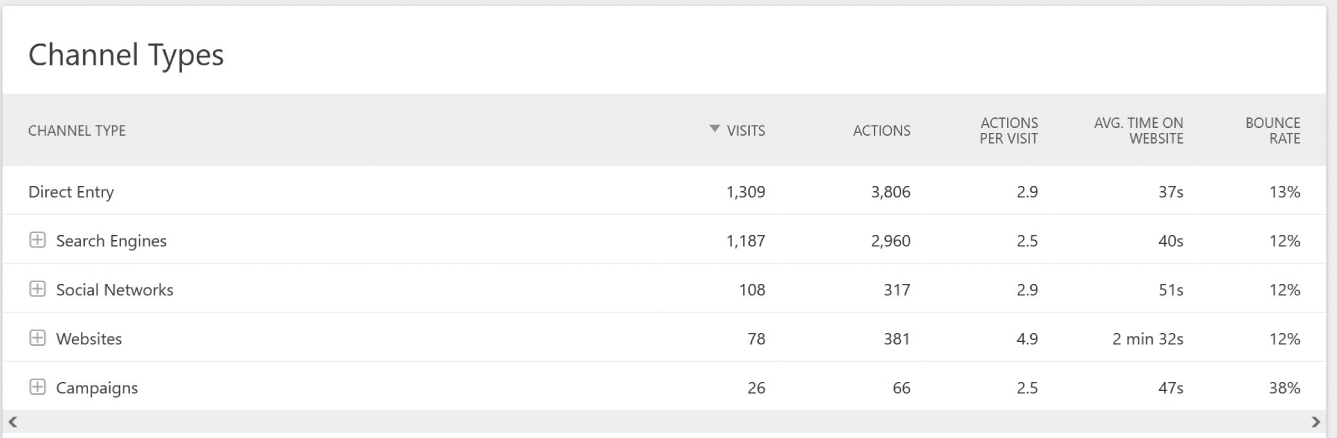
FIGURE 2.2 Matomo Analytics. Acquisition: All Channels Report. https://matomo.org/
The measurements associated with acquisition are shown in the first columns: channel type and number of visits.
B: Behavior Behavior measures what people do on the website. However, I find it much more interesting to base any judgment of behavior on what people saw and how it affected their behavior. Evaluating behavior without knowing what people were looking for or what they saw is only half of the equation, because this helps us find intent—the reason for the visit in the first place!

FIGURE 2.3 Google: G4 Analytics, Acquisition: All Channels Report (https://Analytics.Google.com)
FIGURE 2.4 Piwik Pro: Acquisition Channels (https://piwik.pro/)
Figures 2.2, 2.3 and 2.4 are examples of different analytics programs and their reporting of behavior. The terminology of each is slightly different, but centers on the same idea:
- Actions/Events. These are actions that the visitor performs, such as page views, link clicks, downloads, goals, and out clicks.
- Bounce Rate. A bounce is a single page visit. It means that there was only one page viewed and the visitor left the site. (In strict analytics terms, it means that they did not request another page or file and timed out.) The bounce rate tells you how many visitors out of 100 only had a single page visit. So, if the bounce rate is 33 percent, then (on average) 33 out of 100 visitors only saw a single page.
- Pages per Session. This is another average based on the number of pages that have been requested by the visitor during an active session. Pages per session is being phased out of newer analytics applications and being replaced with actions or events, as many interactions can happen in a single page.
- Average Session Time/Average Engagement Time/Average Time on Website. This is an interesting metric. As mentioned, it is based on the timestamped requests made from your browser. When you request a new page, it is timestamped, and so on for each additional page. When you stop making requests, the session times out, and the calculation is made to come up with length of the session. In the Average Engagement Time column in Figure 2.3, the averages are shown based on the source of the visit. You can compare the behavior of visitors based on their source. When comparing many different types of websites, there are some generalizations that can be made, such as visitors from direct and email tend to have longer sessions. Visitors from social and display ads tend to have the shortest sessions. Of course, this isn't a rule; it's a generalization that is based on the behaviors of visitors from each source. People tend to behave differently based on their source, and it is something to find and evaluate for your business.
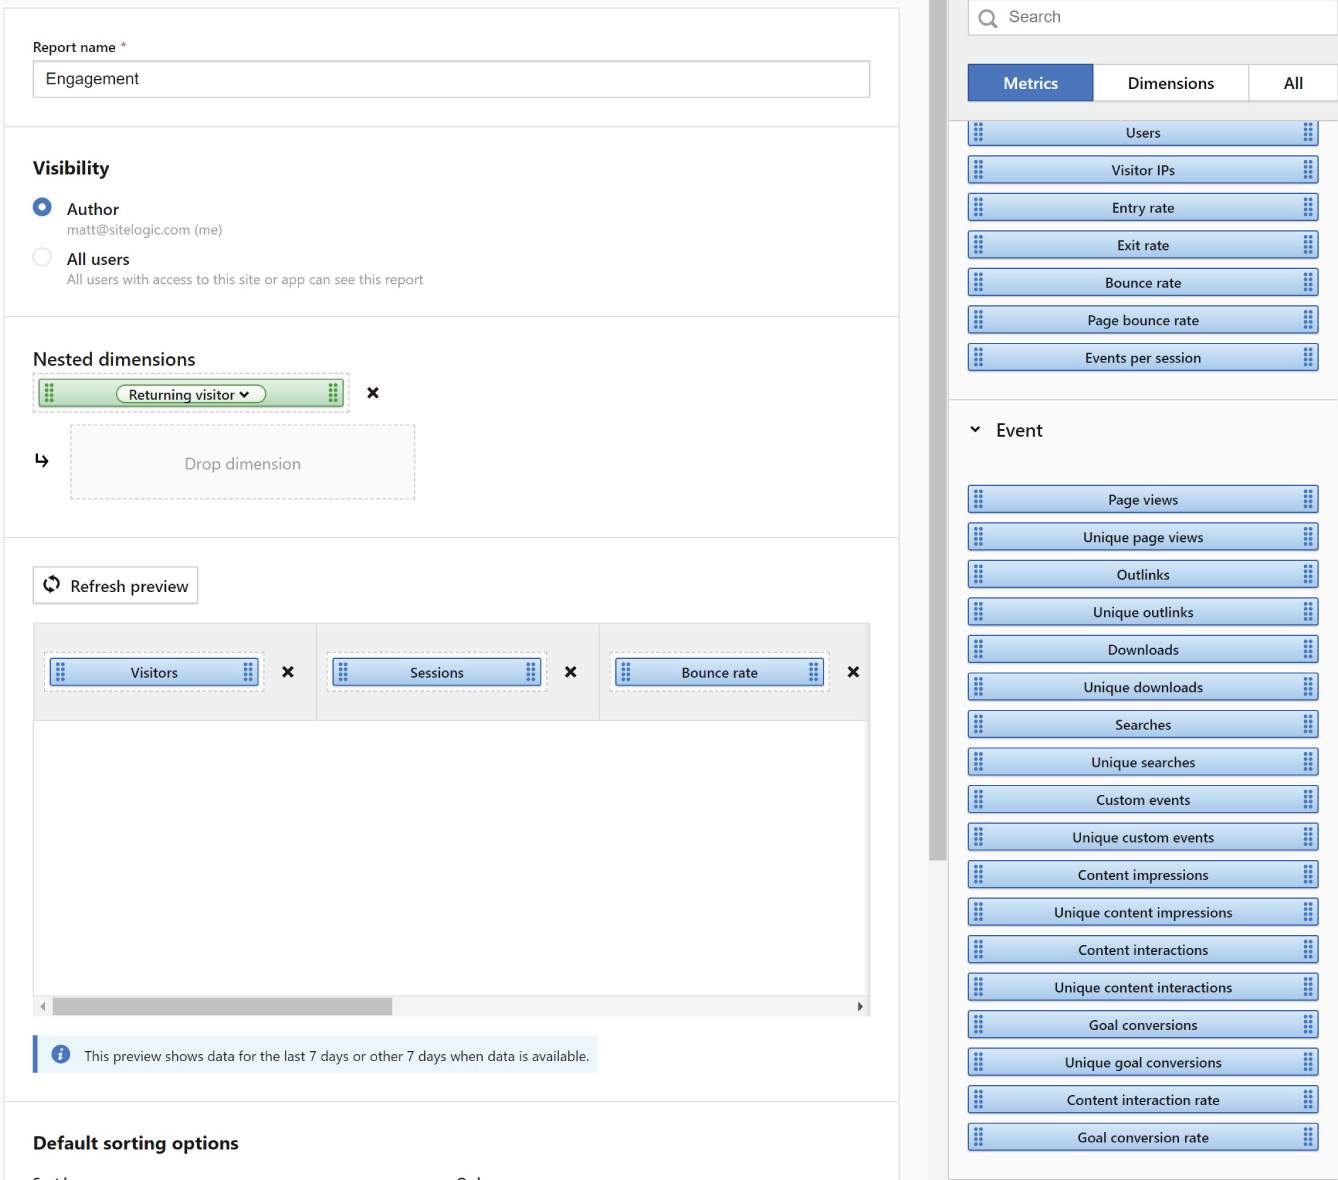
FIGURE 2.5 Piwik Pro: Custom Reports—Events (https://piwik.pro/)
Actions, or events, are replacing the page view metric, and analytics programs are adapting to allow businesses to create their own reports and events based on their unique website, app, or purpose. In this example in Figure 2.5, Piwik Pro provides a list of the events on the right that can be added to a custom report. This way, site owners or managers can adapt the event to their specific purpose.
C: Conversion Conversions are the goals that have been set for visitors to reach. I like to define conversion as getting the visitor to do what you want them to do! Conversions encompass many actions, and they are based on what you define for your business. You'll find that the terms conversions and goals get used interchangeably. Google Analytics attempts to make a differentiation by labeling conversion as the main category, which is made up of ecommerce and goals. In Google Analytics, ecommerce conversions are tracked when integrating your ecommerce website and the Google Analytics ecommerce tracking code. All other conversions in Google Analytics are considered goals. Conversion reporting provides the goal‐based conversions such as Total Conversions, Conversion Rates, Conversion Value, and Revenue Reporting.
Establish Goal Values A goal here can be an ecommerce checkout. Google Analytics won't track a checkout action as a goal unless it is set up manually. In fact, all goals are set up manually in the Admin section. In some cases, you may find that your ecommerce software or customer relationship management (CRM) software are tracking the same information. Both types of systems are including more analytics into their tracking, which might reduce dependence on Google Analytics in the coming years.
Goal completions are the manually created goals for your business website. These are based on important tasks that you decide are worth tracking, as they show a contribution toward business value. These include email subscribers, form completions, video views, contact forms, downloads, etc. Anything that shows or can be tracked to business value can and should be tracked as a goal.
What's the Impact of the Goal Completion Value? Finally, goal value. This is one of the more difficult functions to define, and it is typically neglected by most companies—at their own loss. Here is why this column is so valuable.
As an example, how much is a new email subscriber worth to your organization? There are a few methods that you could use to determine this.
First, what would it cost you to purchase a list of emails? (Not that I would ever recommend this.) Of course, any purchased list would be trouble. Those names have not opted‐in to receive emails from you, and they most likely do not know your brand or business. But buying a low‐quality list like this might run you about $0.10 per email.
Second, what is the average value of a subscriber? This is easier to figure out because it is information that should be measured and calculated within your organization. When sending your emails, do you track the revenue produced? If so, then you should have an average revenue per subscriber calculation, and it should be well known!
Third, start somewhere! For many in the industry, they recommend a value for a new subscriber somewhere around $20 or more.
What this goal value reflects is the economic value to an organization when a visitor completes a task‐based action. It does not mean realized revenue, as an ecommerce report would; rather, it is the estimated value produced. B2B organizations track leads, and they usually have the estimated value of a lead in their calculations. When a visitor completes a lead form on the website, they can attribute a value to that lead. To use this example, if you have an estimated value of $10 of revenue per lead, it will accumulate a running total in the Goal Value column.
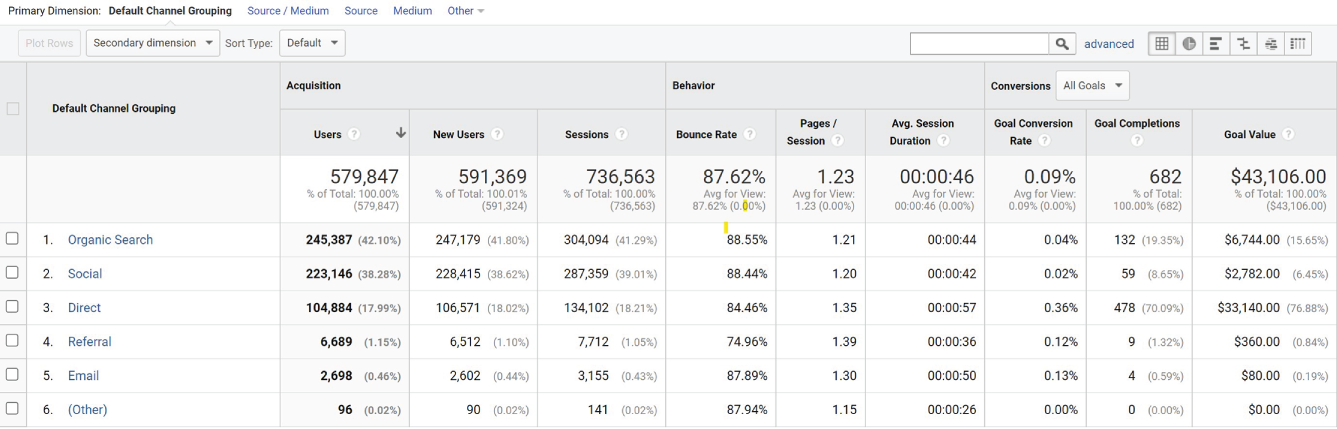
FIGURE 2.6 Google Universal Analytics, Acquisition Channels (https://Analytics.Google.com)
Referring to Figure 2.6, the source of Organic Search has generated 132 goal completions. This is the sum of all goals defined by the organization, each of which may have a different estimated value. For example, Organic Search generated $6,744.00 of Goal Value from 132 goal completions, while Direct generated $33,140.00 from 478 goal completions.
Viewing goal value or the revenue created enables a complete view. Rather than basing judgments on the number of visitors, the conversion rate, or numbers of conversions, value provides feedback about the impact of the conversion because not all goals may have the same value. For example, gaining a subscriber may have a value of $20, whereas a visitor who completes a lead form may have a value of $150 per lead. While these are reported as two goal conversions, they have very different values to the organization.
Segmentation Is the Key
Using the ABCs gently brings you into the application of segmentation. Why? Because your visitors are not a herd of cattle. They don't all enter at the same page, they don't all visit the same pages, and they don't all want the same things. Looking at the big numbers, such as the number of visits or the number of sessions views your visitors as a large herd of cattle because it simply lumps those distinguishing factors into one number. What you need is segmentation.
Segmentation is the separation of your visitors based on common factors. For example, where did they come from? Google? Bing? Email? Facebook? Another website? Did they type the site into their browser? Simply breaking down how people came to your website is one of the first levels of segmentation. By breaking apart the sources of visits, you can start to develop an understanding of how people find the website.
Another method of segmentation is evaluating the landing page—or entry page of the visitor. This is where you really learn that people are looking for very different information, as they land on the page that they hope answers their question. You can also segment by new visitors or returning visitors, customers or noncustomers. Basically, any distinguishing factor can be used to segment people so that you can examine those factors to find insights into that group, your marketing, or your processes. See Figure 2.7.
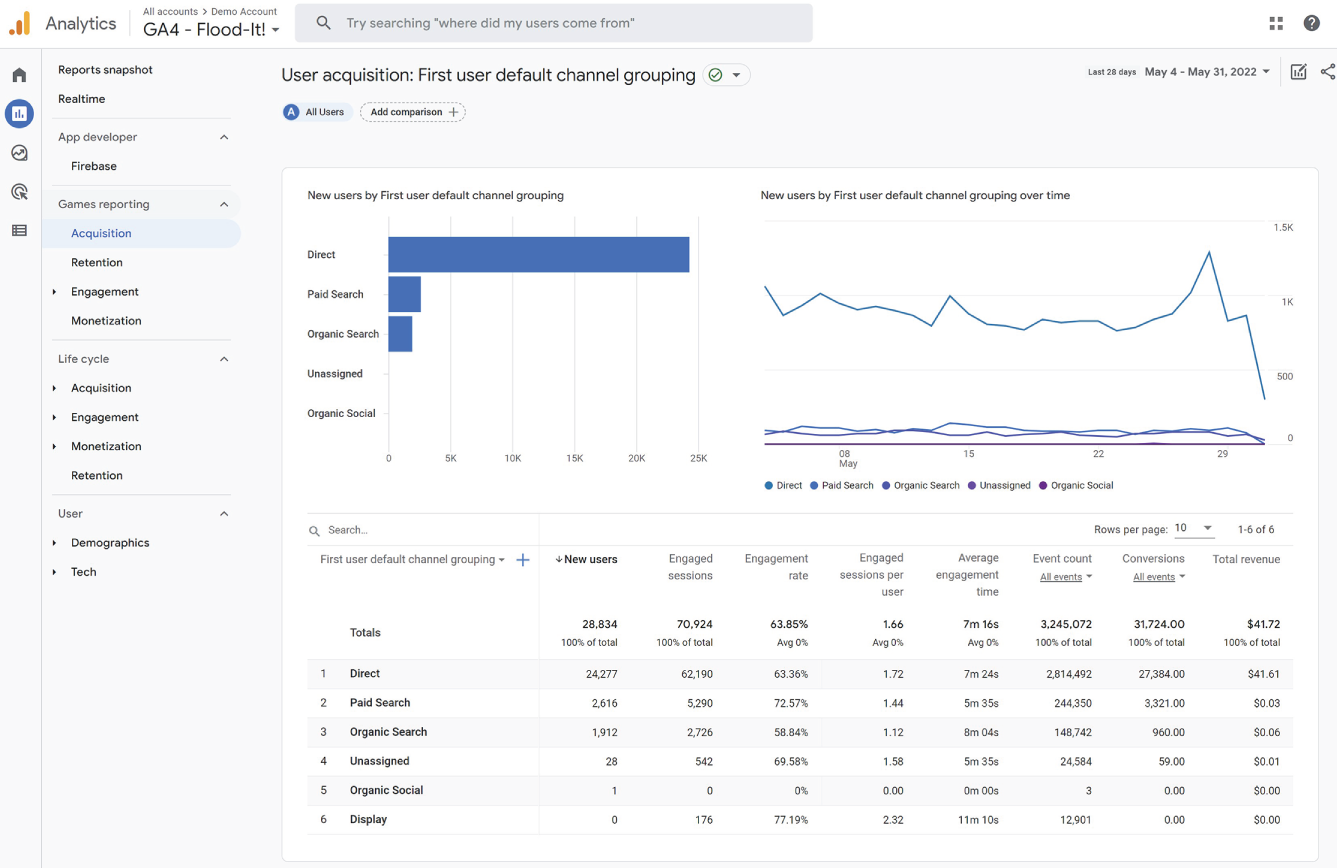
FIGURE 2.7 Google G4 Analytics, New Users by First User Default Channel (https://Analytics.Google.com)
This report automatically segments visitors by how they first found the website. Rather than simply looking at reports of aggregate data, you can find more value by separating visitors. You can explore this even further by adding more dimensions.
A dimension is simply adding another segmentation factor. How would you narrow down the segment of organic search? By the source of that search—the search engine that brought those visitors. By adding Source, you will see the segmentation progress to a secondary level of detailed information. The Primary dimension is Channel, and the Secondary Dimension is Source. You can now see which search engines generated visitors to the website and which contributed to conversions. You can measurably count which search engines are sending valuable visitors that act and contribute to the goals of your business.
KPIs and Metrics
One of the most misunderstood terms in analytics is the key performance indicator, or KPI. I've found this in almost every organization, regardless of size.
A KPI is the measurement that influences the next step in the process, or tracks toward the outcome. It is not a final measurement, as it indirectly influences the outcome. For example, click‐through rate is a great KPI. Click‐through rate measures the percentage of people who see an ad and click on it to go to the landing page, giving you a quick measurement of the appeal of the content you've published and its influence in moving people to the next stage. It does not directly impact the conversion rate or the conversion itself; it only measures the rate that people are clicking on an ad to a landing page. It is a measurement along the pathway and holds indirect influence on the outcomes.
A metric is a number without context, or without a story. If I talk about having 2,000 visits to a website, that's a metric. When a number is used without the context of segment, source, behavior, outcome, or influence, then it is a metric. A metric is a measurement that is independent of an actionable outcome. The difference between these terms is the action that you can take to influence the outcome.
Analytics in Context
Instead of a list of terms and definitions, I find it easier to present them in context of a campaign. For this context, I am going to use a typical sales funnel, which provides a visual progression from one stage to the next.
In the diagram shown in Figures 2.8 through 2.13, you'll see the progression of a typical campaign or account on the left. The funnel itself is divided into two types of measurements: Performance and Financial. Finally, on the right are the action or causal factors related to that phase of the campaign.
Stage 1: Impressions
At the top of the funnel is the method of acquiring visitors to a website (see Figure 2.8). In this case, it could be any type of paid media campaign. In most cases, when starting a campaign, you have to decide on the size and type of audience you will target, along with a corresponding budget to reach that audience.
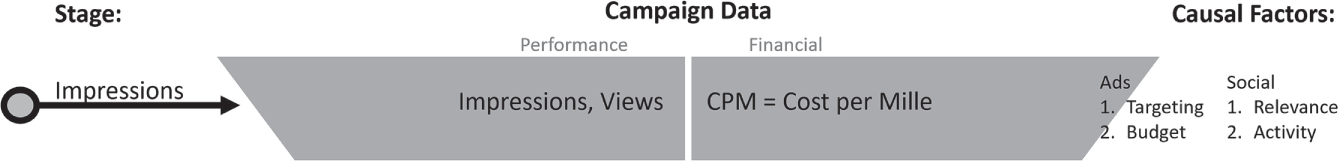
FIGURE 2.8 Analytics in Context: Impressions
CPM, or cost per mille (mille is Latin for 1,000), is the standard method of buying “impressions” or “views.”
When you see a campaign that is marked as $40 CPM, that means that you will be paying $40 for every 1,000 impressions or views. If a campaign reaches 100,000 impressions, you will be charged $4,000.
Now is also when I stress the importance of a baseline, average, or a comparative metric: 100,000 impressions and $40 CPM might look okay, but you need to have a comparison to know for sure!
When you have a baseline to compare with, you'll immediately know if a campaign is on track. By asking how many impressions are expected or what a typical campaign averages, you might be able to catch if the impressions are significantly higher or lower than expected. If you do find that the expected number of impressions is very different than the actual performance, what can you do?
Causal Factors There are two causal or influencing factors at the impression level for paid advertising:
- Targeting parameters: If you are using too many targeting parameters, then the size of the available audience may be restricted. A smaller audience means fewer impressions. Similarly, without targeting parameters, you could be targeting a wider audience than intended, causing more impressions.
- Targeting: The audience you are targeting could be a high‐value or high‐demand audience with a lot of competition. To reach your target audience, you may have to increase your CPM to compete with the other advertisers.
There are also causal factors influencing the impressions for organic social media marketing:
- Activity: How frequently do you post on this social platform? Infrequent posting will result in lower impressions on your content.
- Relevance: Is the content you are posting relevant to the channel or audience? Are you using relevant hashtags, and are followers interacting with your content, which would increase its reach?
This applies to any top of funnel or traffic driver. Identify the key factors that influence the goal for each stage. This enables you to catch anything that departs from the expected performance and suggested actions that could correct the campaign in its early stages.
Stage 2: Engagement
I don't like the word engagement. It has become a meaningless, catch‐all term for rationalizing campaign activity, and it rarely provides any insight into actual economic benefit to an organization. It is made even worse by the so‐called engagement metrics that lump separate actions into one measurement that is supposed to provide meaning, which it doesn't. It actually obscures meaning. See Figure 2.9.
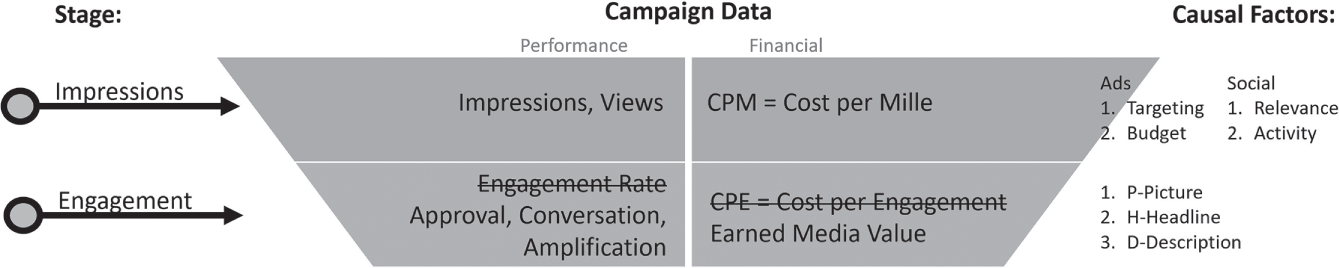
FIGURE 2.9 Analytics in Context: Engagement
The problem with engagement and engagement rate is that it combines multiple metrics into a single metric, thereby stripping it of any meaning. Typically, engagement rate measures the number of likes, comments, and shares and any other trackable action into a single measurement. Even worse is when a cost per engagement is applied, making an even more meaningless metric.
The issue is that these actions are not equal! Given a choice, I am sure that any marketer would choose to have more shares than likes or comments. Shares mean that people are presenting your content to their network, friends, and followers. Likes simply show that someone took the least committal action to support the post—you don't know why; you only know that they did. A share shows loyalty, enthusiasm, and an active recommendation of your content and your business. Plus, it has economic value!
Rather than relying on the deceptive “engagement rate,” focus on each individual metric and learn from it.
Applause Rate Starting with likes or approvals, this is called the applause rate. First, get your benchmark or average. Look at all the posts you've made over the past week, month, or quarter. Divide the number of approval actions gained by the number of posts made in that time frame. You now have an average.
For example, if you made 40 posts in a month and received 763 approvals (likes) on those posts, you are averaging 19 approval actions per post. Here's what you can do with this information now that you have an average. You can evaluate those 40 posts and group them by how many generated 25 or more approvals and how many generated 10 or fewer approvals. (Use whatever numbers make sense to contrast the performance.) You can now evaluate the common factors in the highly performing content, and you can evaluate common factors in poorly performing content. Common factors could be images used, the types of images, content, offers, time of day, events, etc. As you can see, it's not always a simple answer. As an example, with one client we found a consistent correlation of custom vector graphics gaining more approvals than stock photography.
Conversation Rate The conversation rate does a similar measurement for comments. Do the same math by dividing the number of comments generated by the number of posts made in that time frame. Get your average and then analyze the high‐performing posts against to the average, and the low‐performing posts against the average. Find the common factors—typically the common factor might be the content you are sharing, especially if it has any controversial or opinionated element attached to it.
Amplification Rate My favorite of the engagement metrics is amplification rate. This is because engagement rate ties directly to an economic impact. First, do the math, dividing the number of shares generated by the number of posts made in that time frame. Get your average, analyze the highly shared posts against the average, and find the common factors.
Next, calculate the added bonus of economic impact. Some platforms make this easier than others but track the shares of your content and see if you can find the impressions or views generated from each of the shares. Once you have the total amount of impressions or views generated by the shares, apply this to your average CPM. If you know the average cost to reach 1,000 impressions or views in a campaign, or even specifically to that platform, you'll be able to show an economic value of those shares! This is the value of earned media.
Causal Factors What are the causal factors for this thing called engagement? At this stage it is simply the ability to capture someone's attention and move them to interact. What are the factors of a typical ad or post that gets a viewer's attention as they scroll through a feed or a page? It is the combination of the PHD: Picture, Headline, and Description—the three elements of nearly all social and ad content you'll find. If your ad is not attracting likes, comments, or shares, then you can bet that it suffers from a single issue: it is boring. No one interacts with boring posts or ads. Nothing has captured their attention or was worth their time to stop as they scrolled the page.
Primarily, it is the image and headline that get noticed. If you are producing content that isn't getting noticed, then change your approach to images and headlines. Those are the primary factors that people will view and decide to pause and look further.
Stage 3: The Click
This is where you finally reach a trackable clickable action with direct impact on a business objective (see Figure 2.10). The click‐through on an ad, a post, or link is not only a KPI for the campaign, but also the measurement of the effectiveness of the ad or post in influencing someone to act! This is the summary measurement of the campaign's ability to persuade action and movement to the next stage.
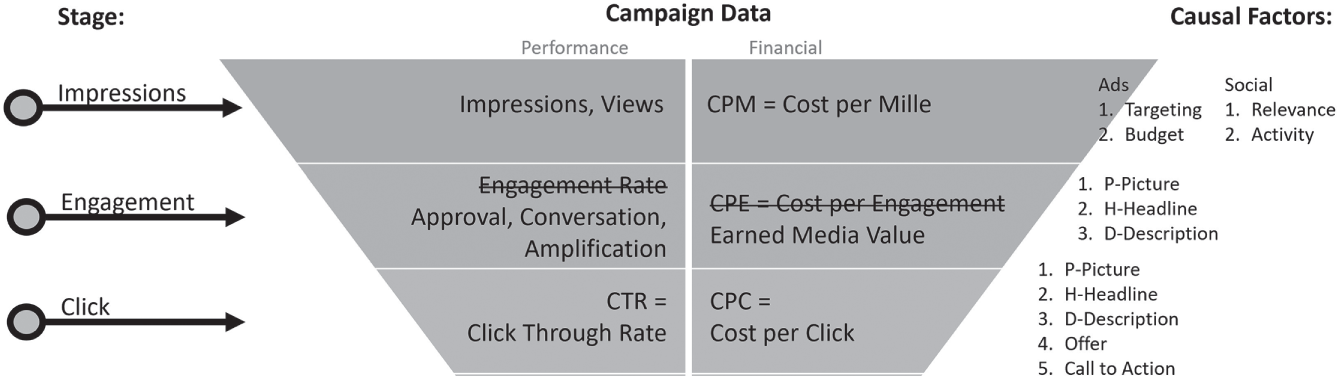
FIGURE 2.10 Analytics in Context, Click
The performance side of this stage is the click‐through rate, which is self‐explanatory. It is the rate at which people click the ad compared to the number of impressions or views. To reach this number, you divide the number of clicks by impressions and multiply by 100. This gives you the rate of clicks. If you have a 2 percent click‐through rate, then it means that about 2 out of 100 people who see the ad or post click‐through.
The causal factors provide immediate feedback for a lower than average click‐through rate. If people are seeing the ad, interacting with it, and not clicking on it, then it is simply entertainment. You've not provided a compelling need or reason for them to act. This culprit is your offer and call to action, but it may also go back to the picture and headline. Evaluate the message of the ad or post. Is it clear? Are you presenting a clear solution to the audience's need? If not, the click‐through rate will suffer.
The financial side of the click provides another layer of feedback. The cost‐per‐click (CPC) is found by dividing the number of clicks by the campaign cost. For example, if you spend $10,000 on a campaign that generates 1,200 clicks, then your average cost‐per‐click is $8.33. Most times, this number ends up on a report right next to the click‐through rate and is not applied properly. To apply the CPC properly, it needs to be compared to another CPC calculation, the CPC generated by other channels.
Take the average CPC and compare it to the average CPC of similar campaigns on other channels. It may look like this example:
| Google Ads | $3.25 CPC |
| $5.75 CPC | |
| $4.50 CPC | |
| $8.95 CPC |
By comparing the average CPC generated by other campaigns, you can start to see the trend and effectiveness of your campaign. If maximizing the efficiency of your spend is an important part of the campaign or objective, then this measurement is a critical factor in how you may decide to spend your budget. The CPC is a comparative measurement for the financial aspects of a campaign, allowing a quick assessment of the efficiency of the campaign. However, it is not the ultimate measurement of success! It is a KPI. This KPI is a step along the way to the goal of the campaign—the conversion. It only informs you of the factors that influence this stage and this milestone.
Stage 4: Conversion
This is where the sales pitch is made—on the landing page. It is also where the causal factors multiply exponentially. You've probably noticed that the closer that the visitor gets to a decision point, the causal factors that influence each stage increase. The landing page is no exception. Of course, if you need to improve the conversion rate of the landing page, you'll see that I've only listed a dozen factors that influence the conversion. There are many other factors, which is why conversion rate optimization is a skill unto itself and addressed in another chapter of this book. See Figure 2.11.
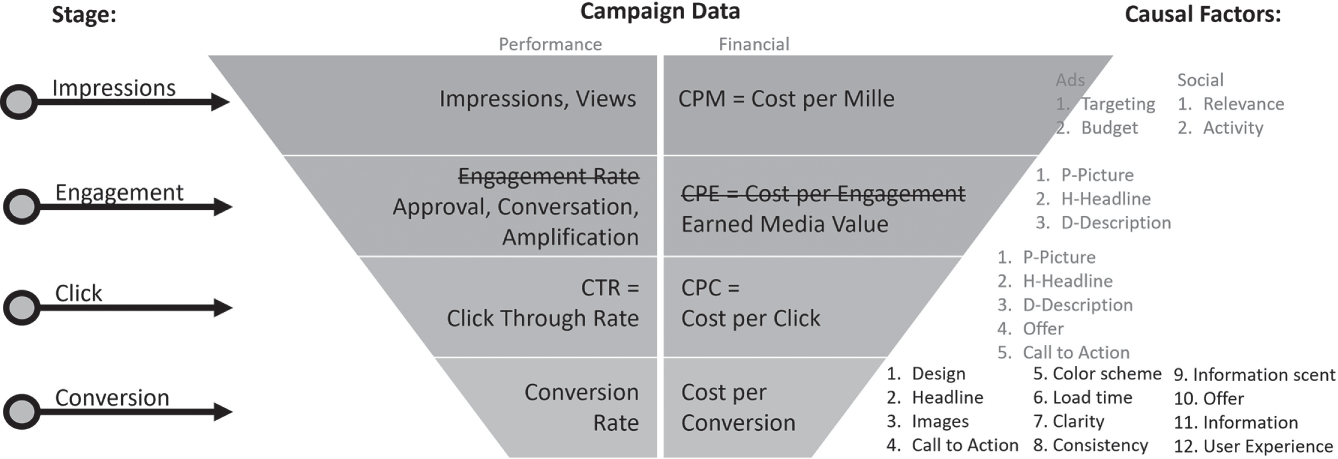
FIGURE 2.11 Analytics in Context, Conversion
The click was simply getting them to the page that does the heavy lifting of persuasion. The conversion is the intended action for the visitor, a registration, subscription, account creation, lead form, or a sale. All your work to this point was simply getting people's attention and arousing their curiosity and interest. Now you make the case for commitment.
The conversion rate is the overall judgment of your campaign's ability to attract and convert leads, subscribers, or customers. Divide the number of conversions from the amount of clicks or page visits and multiply by 100. For example, 100 conversions generated by 2,000 clicks yields a 5 percent conversion rate. About 5 people out of 100 decide to convert. But is that good or bad? It depends. You might find some industry trends or averages, but these numbers are so unique to your company and your approach that it is difficult to find a reliable comparison. The best conversion rate comparison is your own. Are you doing better today than yesterday? This quarter compared to the same quarter last year? This campaign compared to another campaign? There you go!
Comparing your campaign to other campaigns is a great way to apply this measurement to compare your effectiveness across a variety of channels. It becomes even more compelling when you factor in the average cost per conversion, be it a registration, lead, or sale. This now provides you with tangible monetary evidence of the campaign, and it is most effective when measuring the cost of the conversion against the other channels you are using.
You can compare your cost per conversion to previous campaigns, and you can compare it to other campaign sources:
| Google Ads | $10 Cost per conversion |
| $25 Cost per conversion | |
| $14 Cost per conversion | |
| $18 Cost per conversion |
Your analysis and decisions of this comparison would be based on your business objectives.
This is vitally important if you are tracking the efficiency of a campaign. If your goal is to maximize your budget, then these numbers are important because they show you how you can adjust your budget to accommodate a lower cost per conversion. However, if you are only concerned with generating leads or customers, and budget or cost per lead is not a concern, then you would be primarily concerned with the numbers of leads or conversions produced by each channel and make your decision based on the production of the channel, not the economic efficiency. The data you need and how you will use it ties back to the organizational objectives and goals for the campaign.
Stage 5: Nurture
Regardless of capturing leads or making sales, nurturing is process of building and encouraging a relationship. Either you are persuading a new customer to be a regular customer or qualifying a lead through additional communications. The nurture process is very similar, and of course, hundreds of factors now influence this relationship‐building or lead vetting process.
This stage measures the follow‐up and development of the new conversion (see Figure 2.12). Depending on your organization, it will look different from others and is unique to your process. Creating measurements, associating them with action, and showing the economic impact are all vitally important at this stage.
Unfortunately, this is where I find many B2B marketers stretched to their limit and being asked to measure things that don't exist. For many B2B marketers, their primary task is to gain leads. For them, the financial metrics don't come into play because they are simply generating leads and handing them off to the sales team. They can track the source of the lead, but once it is handed off, the lead enters another system that the marketer will never see, and the tracking ends.
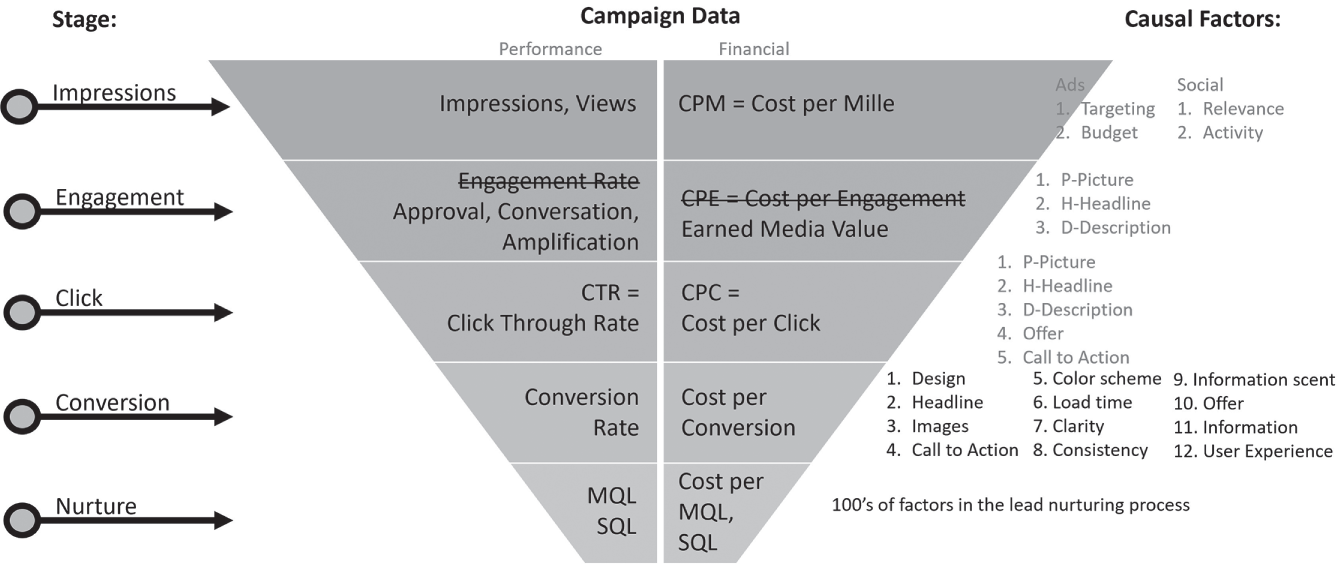
FIGURE 2.12 Analytics in Context, Nurture
What puts these marketers in a bind is when management wants them to start measuring the quality of the leads rather than just the number of leads generated, and that's a big problem. First, no one typically defines quality—they just want it measured. Second, the conversion trail was broken. If an organization has multiple data silos that do not communicate—there is no centralized data source—then that question is impossible to answer. For B2B marketers to be able to measure the quality of a lead (according to the source or campaign that generated the lead), the marketer must be able to track that lead through the nurturing and qualification process (Market Qualified Lead—MQL, Sales Qualified Lead—SQL), all the way to the ultimate sales and agreement and the value of the sale produced. If marketers are not able to see that information, then they cannot produce a simple quality measurement.
Tracking at this level also poses an issue of the “chain of custody.” If you watch any crime dramas, then this term will be familiar to you. For the B2B marketer who hands off the lead, the custody of that lead and the associated data now belong to the sales department. Any assessment of “quality” must include the quality of the sales content, the frequency of contact, the salesperson responsible for follow‐up, and any other interactions. This leads down a path that many people don't want to deal with! However, CRM systems are answering this data dilemma as they become implemented across organizations and unify the data.
The Final Stage: Customer Lifetime Value or Lifetime Customer Value
Regardless of what you call it, customer lifetime value (CLV) or lifetime customer value (LCV), this measurement is the sum of the customer experience with your company. It is based on three primary customer measurements (see Figure 2.13):
- The average value of a purchase
- The number of purchases per year
- The average length (years) of customer retention
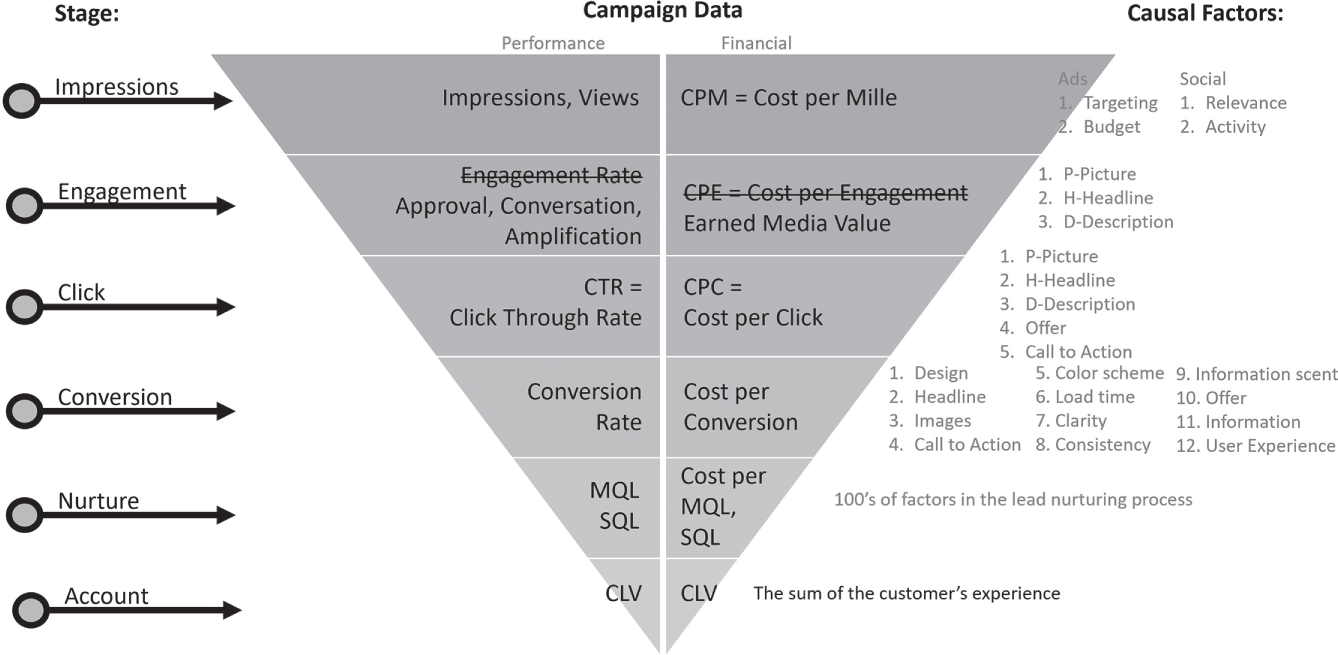
FIGURE 2.13 Analytics in Context, CLV
Capturing this number and the data involved provides a complete end‐to‐end view of the life cycle of the customer. As CRM systems are able to capture more and more data, the connection from account‐level analysis all the way back to the acquisition, campaign, or other attributable sources is becoming easier. This provides the data necessary to close the loop on the true value and efficiency of channels and campaigns. If tracking to this level is the desired objective of your organization, then utilizing the analytics combined with a CRM enables a clearer picture of the efficiency and profitability of campaigns, channels, and offers.