
Intrusion detection systems (IDSs) provide an additional level of security for your network. It is worth noting that unlike firewalls and VPNs, which attempt to prevent attacks, IDSs provide security by arming you with critical information about attacks. Thus, an IDS can satisfy your demand for extra security by notifying you of suspected attacks (and, sometimes, of perfectly normal events, through “false positives”).
IDSs, in general, do not actively block attacks or prevent exploits from succeeding; however, the newest outgrowth from network IDSs—the intrusion prevention systems (an unfortunate marketing term)—strive to play a more active role and to block attacks as they happen.
Defining an IDS is harder than it sounds. Early on, IDSs were viewed as burglar alarms that told you when you were being hacked. However, the modern IDS world is much more complex, and few would agree that IDSs (at least, network IDSs) are at the same level of reliability as conventional burglar alarms. If improper analogies are to be employed, network IDSs are more akin to security cameras than to alarms—a competent human being should watch them and respond to incoming threats.
Indeed, IDSs sometimes might only tell you that your network has just been trashed. The important thing to realize is that few hacked networks get this luxury in the absence of an IDS. As we have seen, a network might become a haven for hackers for years without the owners knowing about it.
The main value of an IDS, in our opinion, is in knowing what is really going on. Yes, an IDS also helps with post-incident forensics, provides network and host troubleshooting, and even serves as a burglar alarm (with the corresponding limitations). However, its primary function is telling you what security-relevant activities are going on inside the network and systems you control.
This chapter gives an overview of IDSs, including their strengths and weaknesses. We will cover network IDSs (sometimes referred to as “sniffers”) and host IDSs (log analyzers, integrity checkers, and others).
The main difference between host and network intrusion detection systems is in where they look for data to detect. A network IDS (NIDS) looks at the network traffic, while a host IDS looks at various host, OS, and application activities. Indeed, there are certain areas where those intersect, such as a host IDS blocking malicious network accesses and a network IDS trying to guess what is going on inside the host. Some of these boundaries blur as the technology continues to develop.
What are some of the advantages of host-based intrusion detection products? The key difference is that while a network IDS detects potential attacks (which are being sent to the target), a host IDS detects attacks that succeeded, resulting in a lower false-positive rate. Some might say that a network IDS is thus more “proactive.” However, a host IDS will be effective in the switched, encrypted, and high-traffic environment, which presents certain difficulties to NIDSs. Host IDSs are challenged by scalability issues, higher exposure to attackers’ actions, and host performance overhead.
On the other hand, network IDSs see a greater part of the total environment—i.e., the entire network. Thus, NIDSs can make meaningful observations about attack patterns involving multiple hosts. They are challenged with high-speed switched networks, end-to-end encryption, and the complexities of modern application protocols, thus resulting in “false alarms” of various kinds.
We therefore provide some novel suggestions for choosing an IDS technology and implementing it into your network with a statistical concept known as Bayesian analysis. We also take a look at what future changes in IDS technology may bring. Finally, we describe a complete open source implementation on Linux.
This section describes some different IDSs, including logfile monitors, integrity monitors, signature scanners, and anomaly detectors.
Host-based network IDSs may be loosely categorized into log monitors, integrity checkers, and kernel modules. The following section will briefly describe each, with examples.
The simplest of IDSs, logfile monitors , attempt to detect intrusions by parsing system event logs. For example, a basic logfile monitor might grep (search) an Apache access.log file for characteristic /cgi-bin/ requests. This technology is limited in that it only detects logged events, which attackers can easily alter. In addition, such a system misses low-level system events, since event logging is a relatively high-level operation. For example, such a host IDS will likely miss an attacker reading a confidential file such as /etc/passwd. This will happen unless you mark the file as such and the intrusion detection system has the ability to monitor read operations.
Logfile monitors are a prime example of host-based IDSs, since they primarily lend themselves to monitoring only one machine. However, it is entirely possible to have a host IDS monitor multiple host logs, aggregated to a logging server. The host-based deployment offers some advantages over monitoring with built-in system tools, since host IDSs often have a secure audit transfer channel to a central server, unlike the regular syslog. Also, they allow aggregation of logs that cannot normally be combined on a single machine (such as Windows event logs).
In contrast, network-based IDSs typically scan the network at the packet level, directly off the wire, like sniffers. Network IDSs can coordinate data across multiple hosts. As we will see in this chapter, each type is advantageous in different situations.
One well-known logfile monitor is swatch (http://www.oit.ucsb.edu/~eta/swatch/), short for “Simple Watcher.” Whereas most log analysis software only scans logs periodically, swatch actively scans log entries and reports alerts in real time. Other tools, such as logwatch (included with Red Hat Linux), are better suited for out-of-the-box operation. However, although swatch comes with a relatively steep learning curve, it offers flexibility and configurability not found in other tools.
The following describes the swatch installation. This tool is fairly stable, so these directions are not likely to change in the future. Before installing swatch, you may have to download and install Perl modules that are required for swatch. To install the modules, first download the latest version of swatch, then run the following:
perl Makefile.PL
make
make test
make install
make realclean
swatch uses regular expressions to find lines of interest. Once swatch finds a line that matches a pattern, it takes an action, such as printing it to the screen, emailing an alert, or taking a user-defined action.
The following is an excerpt from a sample swatch configuration script.
watchfor   /[dD]enied|/DEN.*ED/
echo bold
bell 3
mail
exec "/etc/call_pager 5551234 08"
In this example, swatch looks for a line that contains the word “denied”, “Denied”, or anything that starts with “den” and ends with “ed”. When swatch finds a line that contains one of the these strings, it echoes the line in bold to the terminal and makes a bell sound (^G) three times. Then, swatch emails the user running swatch (who should have permission to access the monitored logfiles—this often limits the choice to root) with the alert and executes the /etc/call_pager program with the given options.
Logfile monitors can justly be considered intrusion detection systems, albeit a special kind. Logs contain a lot of information not directly related to intrusions (just as network traffic sniffed by the network IDS does). Logs may be considered a vast pool of information—some normal (authorized user connected, daemon reconfigured, etc.), some suspicious (connection from remote IP address, strange root access, etc.), and some malicious (such as the RPC buffer overflow logged by the crashing rpc.statd). Sifting through all the information is only a little easier than sniffing traffic looking for web attacks or malformed packets.
If every application had a nice security log where all “bad” events were recorded and categorized, log analyzers would not be considered intrusion detection systems. In fact, if an event were to show up in this magical log, it would be an intrusion. In real life, however, pattern searches in logs are often just as valuable—if not more so—as looking for patterns on the wire.
In fact, analyzing system logs together with network IDS logs is a useful feature in a log analyzer. The log analyzer sees more than just the wire and creates a meta-IDS functionality. For example, management solutions such as netForensics enable cross-device log analysis, normalization and correlation (rule-based log pattern matching), and statistical (algorithmic) event analysis.
An integrity monitor watches key system structures for change. For example, a basic integrity monitor uses system files or registry keys as “bait” to track changes by an intruder. Although they are limited, integrity monitors can add an additional layer of protection to other forms of intrusion detection.
The most popular integrity monitor is Tripwire (http://www.tripwire.com). Tripwire is available for Windows and Unix, and it can monitor a number of attributes, including the following:
File additions, deletions, or modifications
File flags (i.e., hidden, read-only, archive, etc.)
Last access time
Last write time
Change time
File size
Hash checking
Tripwire’s capabilities vary on Unix and Windows due to differing filesystem attributes. Tripwire can be customized to your network’s individual characteristics, and multiple Tripwire agents can securely centralize the data. In fact, you can use Tripwire to monitor any change to your system. Thus, it can be a powerful tool in your IDS arsenal. Many other tools (most are free and open source) are written to accomplish the same task. For example, AIDE (http://www.cs.tut.fi/~rammer/aide.html) is a well-known Tripwire clone.
The key to using integrity checkers for intrusion detection is recording a “known safe” baseline. Establishing such a baseline can only be accomplished before the system is connected to the network. Not having a “known safe” state severely limits the utility of such tools, since the attacker might have already introduced her changes to the system before the integrity-checking tool was run the first time.
While most such tools require a baseline pre-attack state, some use their own knowledge of what constitutes malicious. An example is the chkrootkit tool (available at http://www.chkrootkit.org). It looks for multiple generic intrusion clues, which are often present on the compromised system.
Integrity checkers provide maximum value if some simple guidelines are met. First and foremost, they should be deployed on a clean system, so they have no chance of recording a broken or compromised state as normal. For example, Tripwire should be installed on a system from the original vendor media with all the needed applications deployed, before it is connected to a production network.
Also, storing “known good” databases of recorded parameters on read-only media, such as CDROMs, is a very good idea. Knowing that there is one true copy for comparison helps greatly during incident resolution. Despite all of these precautions, however, hackers still might be able to disable such systems.
Network IDSs may be categorized into signature-based and anomaly-based systems. Unlike the former, more well-defined category, the latter are a mix of different technologies and approaches. Additionally, hybrid NIDSs aim to bridge the gap by using some of the tricks employed by each of the above types of NIDSs. In fact, most modern commercial NIDSs use some of the anomaly-based techniques to enhance the main signature-based engines. Examples included ISS RealSecure, Cisco IDS, and Enterasys Dragon.
Like traditional hex-signature virus scanners, the majority of IDSs attempt to detect attacks based on a database of known attack signatures. When a hacker attempts a known exploit, the IDS attempts to match the exploit against its database. For example, Snort (http://www.Snort.org), a freeware signature-based IDS that runs on both Unix and Windows.
Because it is open source, Snort has the potential to grow its signature database faster than any proprietary tool. Snort signatures are used in everything from commercial firewalls to middleware such as Hogwash. Snort consists of a packet decoder, a detection engine, and a logging and alerting subsystem. Snort is a stateful IDS, which means that it can reassemble and track fragmented TCP attacks.
Some readers might be more used to a concept of stateful and stateless firewalls rather than network intrusion detection systems. However, the principle is the same. Stateless firewalls (and NIDSs) deal with individual packets in isolation, while stateful ones consider the state of the actual connection. The simplest example is as follows: if an attack is split across multiple packets, it will be missed by the stateless IDS (since the overall malicious patterns will never be seen in one packet). It will, however, be picked up by a stateful one, which attempts to match the pattern not in any single packet, but rather in the flow of the whole connection.
However, even stateful NIDSs can be evaded. We provide some examples of this later in the chapter.
A classic example of a signature that an IDSs detects involves web attacks, such as on vulnerable CGI scripts. A hacker’s exploit scanning tools usually include a CGI scanner that probes the target web server for known CGI bugs. For example, the well-known phf exploit allowed an attacker to return any file instead of the proper HTML document. This attack will use a poorly written CGI script to access the files outside the allowed web server directory. To detect a phf attack, a network IDS scanner would search packets for part of the following string:
GET /cgi-bin/phf?
Network IDSs will look at existing signatures, trying to match the above string detected in a network packet. For example, the following Snort signature will match with the above:
alert tcp $EXTERNAL_NET any -> $HTTP_SERVERS $HTTP_PORTS (msg:"WEB-CGI phf
access";flow:to_server,established; uricontent:"/phf"; nocase; reference:bugtraq,629;
reference:arachnids,128; reference:cve,CVE-1999-0067; classtype:web-application-
activity; sid:886; rev:8;)
and the alert will be sent.
We provide a full Snort NIDS deployment example later in this chapter.
Anomaly detection involves establishing a baseline of “normal” system or network activity, and then sounding an alert when a deviation occurs. Since network traffic is constantly changing, such a design lends itself more to host-based IDSs, rather than network IDS. However, some networks (especially some in the military and the intelligence community) might be extremely uniform. In contrast, the activity on a large university shell server might be incredibly diverse, so that the network is much more chaotic. It should also be noted that sometimes people try to separate the anomaly-based NIDSs into traffic anomalies (deviations from a known traffic profile) and protocol anomalies (deviations from network protocol standards).
As we will see later in this chapter, anomaly detection provides high sensitivity but low specificity. Later, we will discuss where such a tool would be most useful.
Because of the nature of IDSs, they are always at a disadvantage. Hackers can always engineer new exploits that will not be detected by existing signature databases. In addition, as with virus scanners, keeping signatures up to date is a major problem. Furthermore, network IDSs are expected to cope with massive bandwidth. Maintaining state in a high-traffic network becomes prohibitive in terms of memory and processing cost.
Moreover, monitoring “switched networks” is problematic because switches curtail the IDS’s sensors. There have been attempts to compensate for this by embedding the IDS in the switch or attaching the IDS to the switch monitor port. However, such solutions have multiple unresolved challenges. For example, mirroring a set of gigabit links requires deploying multiple IDSs in a complicated load-balancing configuration, since no single IDS is able to cope with the load.
Another limitation of IDSs is that they are extremely vulnerable to attack or evasion. For example, denial-of-service attacks such as SYN floods or smurf attacks can often take down an IDS with ease. Similarly, slow scans or IP address spoofing frustrate many IDSs.
This section introduces the statistical properties of diagnostic tests and their implications for interpreting test results. We use a principle from statistics known as the Bayes’s theorem , which describes the relationships that exist within an array of simple and conditional probabilities. Rather than covering the mathematical details, which can be obtained from any of hundreds of statistics books, we instead focus on a practical implementation of “Bayesian analysis” as applied to IDSs. Understanding these concepts and their practical implementation will enable you to make better judgments about how to place different flavors of IDS at different points in your network.[1]
Consider a typical IDS report monitor as represented by the 2 x 2 table in Figure 19-1. One axis, called “Intrusion,” represents whether an intrusion has really occurred—the “+” means there really was an intrusion, while the “-” means there was no intrusion. The other axis, called “IDS Response,” represents whether the IDS thinks it has detected an intrusion—the “+” means the IDS thinks there was an intrusion, while the “-” means the IDS thinks there was no intrusion. As in the real world, this model shows that the IDS is not always correct. We can use the incidence of each quadrant of the 2 x 2 table to help us understand the statistical properties of an IDS.
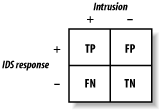
Here’s what the initials in the table represent:
| TP = true positive (intrusion correctly detected) |
| FP = false positive (false alarm) |
| FN = false negative (intrusion missed) |
| TN = true negative (integrity correctly detected) |
Sensitivity is defined as the true-positive rate (i.e., the fraction of intrusions that are detected by the IDS). Mathematically, sensitivity is expressed as follows:
| True positives / (true positives + false negatives) |
The false-negative rate is equal to 1 minus the sensitivity. The more sensitive an IDS is, the less likely it is to miss actual intrusions.
Sensitive IDSs are useful for identifying attacks on areas of the network that are easy to fix or should never be missed. Sensitive tests are more useful for “screening”—i.e., when you need to rule out anything that might even remotely possibly represent an intrusion. Among sensitive IDSs, negative results have more inherent value than positive results.
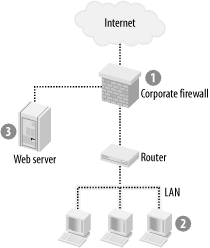
For example, you need a sensitive IDS to monitor host machines sitting deep in the corporate LAN, shielded by firewalls and routers. In Figure 19-2, Area 2 represents this kind of machine. At this heavily buffered point in the network, we should not have any intrusions whatsoever. It is important to have a high level of sensitivity in order to screen for anything amiss. Specificity is less important because at this point in the network, all anomalous behavior should be investigated. The IDS does not need to discriminate, since a human operator is obligated to investigate each alarm by hand.
Mathematically, specificity is expressed as follows:
| True negatives / (true negatives + false positives) |
True negatives represent occasions when the IDS is correctly reporting no intrusions. False positives occur when an IDS mistakenly reports an intrusion when there actually is none. The false-positive rate is equal to 1 minus the specificity.
Specific IDSs have the greatest utility to the network administrator. For these programs, positive results are more useful than negative results. Specific tests are useful when consequences for false-positive results are serious.
Choose an IDS with high specificity for an area of the network in which automatic diagnosis is critical. For example, Area 1 in Figure 19-2 represents a corporate firewall that faces the Internet. In this case, we need an IDS that has a high specificity to detect denial-of-service attacks, since these attacks can be fatal if not detected early. At this point in the network, we care less about overall sensitivity, since we are “ruling in” an attack, rather than screening the mass of normal Internet traffic for any anomalies.
Often, the trade-off between sensitivity and specificity varies on a continuum that depends on an arbitrary cutoff point. A cutoff for abnormality may be chosen liberally or conservatively. However, there are situations when we need to spend the extra money to achieve high sensitivity and high specificity. Accuracy is a term that encompasses both specificity and sensitivity. Accuracy is the proportion of all IDS results (positive and negative) that are correct.
For example, we might need high accuracy in an area of the network such as Area 3 in Figure 19-2. In this case, our web server is under constant attack, and it would cause us immediate embarrassment and financial loss if compromised. We need to process any slight anomaly, and we need to do it automatically because of the high traffic volume. In fact, to achieve the highest sensitivity and specificity, we might need to combine layers of different IDSs.
The receiver operating characteristic (ROC) curve is a method of graphically demonstrating the relationship between sensitivity and specificity. An ROC curve plots the true-positive rate (sensitivity) against the false-positive rate (1 minus specificity). This graph serves as a nomogram (Figure 19-3), which is a graphical representation (from the field of statistics) that helps you to quickly compare the quality of two systems.
After choosing a desired cutoff point, the IDS’s sensitivity and specificity can be determined from the graph. The curve’s shape correlates with the accuracy or overall quality of the IDS. A straight line moving up and to the right at 45 degrees indicates a useless IDS. In contrast, an IDS in which the ROC curve is tucked into the upper left-hand corner of the plot offers the best information. Quantitatively, the area under the curve is correlated directly with the accuracy of the IDS.
In Figure 19-3, the IDS labeled B is more accurate than IDS C. The IDS labeled A has the highest accuracy of all.

Theoretically, sensitivity and specificity are properties of the IDS itself; these properties are independent of the network being monitored. Thus, sensitivity and specificity tell us how well the IDS itself performs, but they do not show how well it performs in the context of a particular network. In contrast, predictive value accounts for variations in underlying networks and is more useful in practice.
Predictive values are real-world predictions derived from all available data. Predictive value combines prior probability with IDS results to yield post-test probability, expressed as positive and negative predictive values. This combination constitutes a practical application of Bayes’s theorem, which is a formula used in classic probability theory.
Information based on attack prevalence in your network is adjusted by the IDS result to generate a prediction. Most network administrators already perform this analysis intuitively but imprecisely. For example, if you know that slow ping sweeps have recently become prevalent against your network, you use that information to evaluate data from your IDS.
When various predictors are linked mathematically, they must be transformed from probabilities to odds. Then, they are referred to as likelihood ratios (LRs) or odds ratios (ORs) and can be combined through simple multiplication.
Sensitivity, specificity, and predictive values are all stated in terms of probability: the estimated proportion of time that intrusions occur. Another useful term is odds (i.e., the ratio of two probabilities, ranging from zero [never] to infinity [always]). For example, the odds of 1 are equivalent to a 50% probability of an intrusion (i.e., just as likely to have occurred as not to have occurred). The mathematical relation between these concepts can be expressed as follows:
| Odds = probability / (1 - probability) |
| Probability = odds / (1 + odds) |
LRs and ORs are examples of odds. LRs yield a more sophisticated prediction because they employ all available data.
The LR for a positive IDS result is defined as the probability of a positive result in the presence of a true attack, divided by the probability of a positive result in a network not under attack (true-positive rate/false-positive rate). The LR for a negative IDS result is defined as the probability of a negative result in the absence of a true attack, divided by the probability of a negative result in a network that is under attack (true-negative rate/false-negative rate).
LRs enable more information to be extracted from a test than is allowed by simple sensitivity and specificity. When working with LRs and other odds, the post-test probability is obtained by multiplying together all the LRs. The final ratio can also be converted from odds to probability to yield a post-test probability.
By applying these statistical methods, we can make informed choices about deploying IDSs throughout a network. Although currently fraught with inaccuracy, the field of intrusion detection is still nascent, and new and exciting developments are happening every day. As time goes on, use of the scientific method will improve this inexact and complex technology. By understanding the sensitivity and specificity of an IDS, we can learn its value and when to utilize it. In addition, increasing the use of likelihood ratios makes the data that we receive from our IDSs more meaningful.
In order to help you plan your security strategy, this section shows how hackers commonly exploit vulnerabilities in IDSs.
Fragmentation or packet splitting is the most common attack against network IDSs, and it used to stump all commercial NIDSs designed several years ago. By splitting packets into smaller pieces, hackers can often fool the IDS. A stateful IDS reassembles fragmented packets for analysis, but as throughput increases, this process consumes more resources and becomes less accurate. There is a seemingly infinite number of fragmentation tricks that one can employ, leading either to evasion or to overloading the NIDS’s anti-evasion capabilities.
In addition to fragmenting data, it is also possible to spoof the TCP sequence number that the network IDS sees. For example, if a post-connection SYN packet with a forged sequence number is sent, the IDS becomes desynchronized from the host because the host drops the unexpected and inappropriate SYN, whereas the IDS resets itself to the new sequence number. Thus, the IDS ignores the true data stream, since it is waiting for a new sequence number that does not exist. Sending an RST packet with a forged address that corresponds to the forged SYN can close this new connection to the IDS.
Overall, network IDSs do not know how the target host will interpret the incoming traffic. Thus, malicious network communication may be designed to be seen differently by the IDS than by the target host. Only the real target’s awareness will allow most of the NIDS’s problems to be solved.
Whisker by RFP (available from http://www.wiretrip.net) is a software tool designed to hack web servers by sneaking carefully deformed HTTP requests past the IDS. For example, a typical CGI-bin request has the following standard HTTP format:
GET /cgi-bin/script.cgi HTTP/1.0
Obfuscated HTTP requests can often fool IDSs that parse web traffic. For example, if an IDS scans for the classic phf exploit:
/cgi-bin/phf
we can often fool it by adding extra data to our request. We could issue this request:
GET /cgi-bin/subdirectory/../script.cgi HTTP/1.0
In this case, we request a subdirectory and then use /../ to move to the parent directory and
execute the target script. This way of sneaking in the back door is
referred to as directory traversal , and it is one of the most well-known exploits of all
time.
Whisker automates a variety of such anti-IDS attacks. As a result, Whisker is known as an anti-IDS (AIDS) tool. Whisker has split into two projects, whisker (the scanner) and libwhisker (the Perl module used by whisker).
Modern IDSs (such as Snort) attempt to normalize traffic before analysis through the use of various preprocessors. The normalization techniques seek to make the traffic look more uniform—for example, by removing ambiguities in packet headers and payloads and by presenting a simple flow to match with intrusion patterns. However, the number of possible mutations is a few bits short of infinite. Thus, the arms race continues.
As outlined earlier, the typical integrity checker host IDS computes the checksum and collects information about files (“initialize mode”). Then, the program periodically checks for changes (using the “check mode”). In addition, the system administrator can update the file signature after reconfiguring the system (“update mode”). Depending on the implementation of the host IDS, each of those modes can be attacked.
An attacker can modify the host IDS software itself, can send the wrong information to a host IDS central console, or can compromise the system between scheduled integrity checks. Also, some kernel-based attack programs will be missed by such an IDS because they will “correct” the system itself, making it effectively “lie” to the IDS. For detailed analysis of host IDS attacks, refer to the paper “Ups and Downs of UNIX/Linux Host-Based Security Solutions” (listed in Section 19.7).
The field of intrusion detection is still in its infancy. As hackers evolve, IDSs must attempt to keep pace. Table 19-1 lists future trends that pose threats to IDSs, and potential solutions.
Table 19-1. Potential solutions to future difficulties in IDS
Problem | Solution |
|---|---|
Encrypted traffic (IPSec) | Embed IDS throughout host stack |
Increasing speed and complexity of attacks | Strict anomaly detection, heavily optimized NIDS engines, and intelligent pattern matching |
Switched networks | Monitor each host individually; embed NIDSs in switches |
Increasing burden of data to interpret | Visual display of data, automated alert suppression and correlation |
New evasion techniques | New traffic normalization techniques and deeper target host awareness |
New kernel-based attack techniques | New kernel security mechanisms |
The following sections examine each of these growing problems and propose potential solutions.
IPSec (short for IP Security) is becoming a popular standard for securing data over a network. IPSec is a set of security standards designed by the Internet Engineering Task Force (IETF) to provide end-to-end protection of private data. Implementing this standard allows an enterprise to transport data across an untrustworthy network such as the Internet while preventing hackers from corrupting, stealing, or spoofing private communication.
By securing packets at the network layer, IPSec provides application-transparent encryption services for IP network traffic, as well as other access protections for secure networking. For example, IPSec can provide for end-to-end security for client-to-server, server-to-server, and client-to-client configurations.
Unfortunately, IPSec is a double-edged sword for IDSs. On the one hand, IPSec allows users to securely log into their corporate networks from home using a VPN. On the other hand, IPSec encrypts traffic, thus rendering promiscuous-mode sniffing network IDSs less effective. If a hacker compromises a remote user’s machine, he will have a secure tunnel through which to hack the corporate network! In order to correct for IPSec, future IDSs need to be embedded throughout each level of a host’s TCP/IP stack. This will allow the IDS to watch data as it is unencapsulated and processed through each layer of the stack and analyze the decrypted payload at higher levels.
As the speed and complexity of attacks continue to increase, IDSs are less able to keep pace. One answer to this dilemma is strict anomaly detection: every abnormality, no matter how minor, is considered a true positive alarm. Such a method requires that the IDSs move onto individual hosts, rather than the network as a whole. An individual host should have a more predictable traffic pattern than the entire network. Each critical host would have an IDS that detects every anomaly. Then the administrator can make rules (exceptions) for acceptable variations in behavior. In this way, IDSs monitor behavior in much the same way that firewalls monitor traffic.
How would we design an IDS that performs host-based, strict anonmaly detection? We are dealing with individual hosts that are somewhat isolated by firewalls and routers, so we can customize our IDS for each unique host. Since we are dealing with the host only, we know that any packets received are destined for that specific host. We can then set our sensitivity very high to look for any abnormality.
For example, at the packet level, our host-based anomaly detector would scan packets as they are processed up the stack. We ask the IDS to monitor any of the following:
Unexpected signatures
TCP/IP violations
Packets of unusual size
Low TTL values
Invalid checksums
Other protocol violations
Similarly, at the application level, we can ask our anomaly detector to scan for unusual fluctuations in the following system characteristics:
CPU utilization
Disk activity
User logins
File activity
Number of running services
Number of running applications
Number of open ports
Logfile size
Once an abnormality is detected, an alert is sent to the central console. This method has a high sensitivity, but unfortunately it generates a great deal of data. We deal with this problem below.
The increasing use of switched networks hinders an IDSs that monitors the network using promiscuous-mode, passive protocol analysis. It is becoming more difficult to monitor multiple hosts simultaneously due to increased bandwidth, virtual networks and other complications. In addition, the growing use of encrypted traffic foils passive analysis off the wire. Thus, IDSs are moving toward host-based monitoring.
As bandwidth and attack complexity increase, it is becoming more difficult to generate meaningful alerts. The amount of alert data generated by an IDS can quickly overwhelm its human operators. Unfortunately, excessive filtering of data for human use severely limits its effectiveness.
One solution to this problem involves advanced visualization techniques, also called geometric display of data . Humans understand geometric shapes intuitively, so this kind of display is often the easiest way to present massive amounts of data. When an operator senses an anomaly in the graphical display, she can later drill down manually to investigate the problem. For example, for its own internal use, Airscanner Corporation coded a flexible ActiveX control that mimics a real-time human electrocardiogram (EKG). The rate and rhythm (and color or sound) of the “heartbeat” fluctuates on screen in response to network changes. Just as a hospital nurse monitors a cardiac telemetry floor, the Airscanner network administrator can easily monitor her LAN by keeping an eye on this display.
This section presents an example deployment of the Snort IDS (http://www.Snort.org). Snort used to be called a “lightweight IDS,” but it has since progressed way beyond that stage, and there is nothing lightweight about it anymore. Snort might only be called lightweight if we’re referring to the high efficiency of its detection engine and its small memory footprint. It is a full enterprise IDS that can be deployed in high-performance and distributed configurations that reach gigabit speeds.
The intrusion detection platform discussed in this section is based on a Linux OS, a Snort network IDS, a MySQL database, and an ACID analysis console. Any Linux distribution, such as Red Hat or Debian can be used. While ideally you should build a minimum Linux system from scratch (as is done by the commercial IDS vendors selling Unix-based IDSs), for small network deployment you might be able to get away with a “canned” Linux variant. The system has to be minimized (i.e., all unneeded software removed) and hardened.
You should have at least two network cards on the computer where
Snort is deployed, since the sniffing interface (which picks up
attacks) and the management interface (used for sensor event data
management, rule updates, and configuration changes) must be separate.
The main reason is that the sniffing interface has no IP address
assigned to it. In Linux, it is easy to activate a network interface
with no IP address by using a command such as ifconfig eth1 up.
While not providing total security (impossible by definition), this
solution is much better than having a regular interface for
detection.
While Snort and the database can be installed on one machine, in case of higher traffic load you might want to install the database, Snort, and a web server each on a different computer. The intermediate variant of this is Snort on one machine and the database and web server on a second computer.
In the case of a multi-machine setup, the components of the IDS are connected via a network and several security measures must be implemented. To protect traffic between the analyst workstation and a database, we’ll use an SSL connection. To restrict access to the ACID-based console, we’ll use a standard feature of the Apache web server, basic HTTP authentication via .htpasswd. The traffic between the Snort sensor and the database can also be tunneled over SSL or SSH.
First, you should build a hardened Linux machine. For Red Hat Linux, either choose a Custom Install from the official (or unofficial!) CD set or minimize their existing workstation setup variant by removing all the GUI components (for remotely managed IDS boxes). Make sure that all the MySQL server packages (included on Red Hat CDs) are installed. The command:
# rpm -U /mnt/cdrom/RedHat/RPMS/mysql*rpm
will take care of it, provided the appropriate Linux CD is mounted in the CD-ROM drive.
In the case of Red Hat, several Snort RPM (Red Hat Package Manager) software packages can be downloaded from the Snort.org web site. You need Snort and the Snort-mysql packages for the described setup. Install the packages on your hardened system. If the RPM installed complains about dependencies, satisfy them by downloading the appropriate packages (the libpcap network packet library might be needed).
Add the ACID-IDS event viewing software to the machine. The ACID home page contains the software and the installation instructions (http://acidlab.sourceforge.net). ACID requires a web-graphing library for visual display of Snort alerts. The ACID package should be unpacked in a directory visible to the web server (on Red Hat, /var/www/html). ACID can thus be deployed into /var/www/html/acid. The configuration file acid_conf.php is where all the configuration settings reside. No access control is built in, so you might need the standard .htpasswd to be created in /var/www/html/acid.
If the deployment option (such as Red Hat’s workstation setup) did not include a web server, an Apache web server should be installed off the distribution CDs via:
#rpm -U /mnt/cdrom/RedHat/RPMS/apache*rpmAfter all the components are installed, it’s time to configure the IDS. First, Snort must be configured to log to a database. Here is the list of instructions to do just that:
Start the MySQL database service via:
#
/etc/init.d/mysql startCreate the Snort database:
#
echo "CREATE DATABASE Snort_db;" | mysql -u root -pAdd the user to be used for database operations:
#
adduser SnortGrant this user privileges to insert alert data into the database:
#
echo "grant INSERT,SELECT on Snort_db.* to Snort@localhost;" | mysql -u root -pUsing the script included with the Snort source distribution (not with the binary RPM package), create the database data structures:
#
cat ./contrib/create_mysql | mysql Snort_dbEdit the Snort config files to log to a database. Namely, edit /etc/Snort.conf to contain:
output database: log, mysql, user=Snort dbname=Snort_db host=localhost
Edit the Snort startup script (/etc/init.d/Snortd) to have the following command to launch the Snort process:
/usr/sbin/Snort -D -l /var/log/Snort -i $INTERFACE -c /etc/Snort/Snort.conf
Locations for Snort logs can be adjusted here.
Snort can now be started by the command:
#/etc/rc.d/init.d/Snortd startYour IDS is now configured and logging to a database. Test it as follows:
Test that Snort detects the attacks on lynx http://www.someLOCALwebserver.com/cmd.exe and then run:
#
tail /var/log/Snort/alertIf you get a positive result, you will see an alert message indicating an IIS web attack. Please, do not run this test using a remote server URL, but rather one of your own local machines. Make sure that the sensor can “see” the attack (i.e., that the connection takes place via a network monitored by Snort).
Now, it is time to configure alert viewing via ACID. ACID (Analysis Console for Intrusion Databases) is a PHP application that allows the analysis of Snort data stored in a database.
ACID must be allowed to access the database. Run the following command to enable it:
#echo "grant CREATE,INSERT,SELECT,UPDATE,DELETE on Snort_db.* to acid@localhost;" |
mysql -u root -p
For higher security, it is suggested that SSL be used for alert viewing. Deploy the appropriate SSL package from the Red Hat CDs via:
#rpm -U /mnt/cdrom/RedHat/RPMS/mod-ssl*rpmand restart Apache via /etc/init.d/httpd restart.
For even higher security, only the SSL connection should be allowed to the machine. A host firewall script for the iptables Linux firewall can be used to allow only TCP port 443 (HTTPS) and not TCP port 80 (HTTP).
Now, start the Apache web server and point your browser to the machine’s IP management interface (or the localhost 127.0.0.1 address, if running the browser locally). The correct URL is http://www.yourSnortServer.com/acid. The ACID software will guide you through the initial setup options, provided you followed the above instructions. ACID can be used to view Snort IDS alerts in many different modes, perform searches, and access full packet payloads.
If a database setup is not desirable, you can simply forward all the alerts to syslog and then use log-analysis tools to comb through them. Several tools (such as Snortsnarf) exist to summarize and view Snort events.
A full discussion of IDS rule tuning is beyond the scope of this chapter. However, one approach is to enable all rules and spend several days flooded with alerts, analyzing them and reducing the ruleset accordingly. This route is more appropriate for internal network IDS deployment and small networks. Another solution is to narrow the ruleset to watch only “risky” services. This works better in a highly secure DMZ setup in which all machines are carefully audited and hardened. In this case, a CodeRed alert should raise absolutely no concern, since your Unix web server will not be vulnerable to such a trivial threat.
The following simple Snort site customization is a must before deploying on a production network: Snort’s HOME_NET variable should be set to the IP range of the protected network. Taking this step increases performance dramatically, since Snort will only look at relevant parts of network traffic.
Network intrusion detection systems are becoming a required information security safeguard. Together with firewalls and vulnerability scanners, IDSs can form one of the pillars of modern computer security. In this section, we examine five mistakes organizations commonly make while planning and deploying their IDSs. In addition to the obvious mistake of not evaluating the IDS technology at all, these mistakes decrease or eliminate the added value that companies would derive from running an IDS.
While the IDS field is still in motion, several classes of products have formed. Most IDS products loosely fall into the category of network IDSs. A network IDS monitors the entire subnet for network attacks against machines connected to it, using a database of attack signatures or a set of algorithms to detect anomalies in network traffic. Alerts and attack analysis are handled by a different machine that collects the information from several sensors.
Signature-based network IDSs are the most widely deployed type of intrusion detection system. Simplified management and the availability of inexpensive network IDS appliances, together with the dominance of network-based attacks, are believed to be the primary reasons.
Now let’s take a look at the top five IDS mistakes and what can be done to avoid them.
The IDS cannot see all the network traffic. The problem here is deploying the network IDS without sufficient infrastructure planning. A network IDS should be deployed on the network choke point (such as right inside or outside the firewall), on the appropriate internal network segment, or in the DMZ. On shared Ethernet-based networks, the IDS should see all network traffic within the Ethernet collision domain or subnet and traffic destined to and from the subnet, but no more. For switched networks, there are several IDS deployment scenarios that use special switch capabilities, such as port mirroring or spanning.
The IDS is deployed appropriately, but nobody looks at the alerts it generates. It’s well known that the IDS is a detection technology and it never promised to be a shoot-and-forget means of thwarting attacks. While in some cases the organization might get away with dropping the firewall in place and configuring the policy, such a deployment scenario never works for intrusion detection. If IDS alerts are reviewed only after a successful compromise, the system turns into an overpriced incident response helper tool—clearly, not what the technology designers had in mind.
There is no IDS response policy. The network IDS is deployed, it sees all the traffic, and there is somebody reviewing the alert stream. But what is the response for each event type? Does the person viewing the alerts know the best course of action for each event? How do you tell normal events from anomalous and malicious events? What events are typically false positives (alerts being triggered on benign activity) and false alarms (alerts being triggered on attacks that cannot harm the target systems) in the protected environment? Unless these questions are answered, it is likely that no intelligent action is being taken based on IDS alerts.
The IDS isn’t tuned to its environment. All the previous pitfalls have been avoided, and your network IDS is humming along nicely. However, the staff monitoring the IDS starts to get flooded with alerts. They know what to do for each alert, but how quickly can they take action after receiving the ten-thousandth alert on a given day? Current network IDSs have to be tuned for the environment. While a detailed guide for IDS tuning is beyond the scope of this chapter, two general approaches are commonly used. The first approach is to enable all possible IDS rules and to spend several days flooded with alerts, analyzing them and reducing the ruleset accordingly. This route is more appropriate for internal network IDS deployment. Another solution is to reduce the ruleset to only watch the risky services. This works better in a highly secure DMZ setup where all machines are carefully audited and hardened.
The inherent limitations of network IDS technology aren’t recognized. While anomaly-based IDSs might detect an unknown attack, most signature-based IDSs miss a new exploit if there is no rule written for it. IDSs must frequently receive vendor signature updates. Even if updates are applied on a schedule, exploits that are unknown to the IDS vendor will probably not be caught by the signature-based system. Attackers may also try to blind or evade the network IDS by using many tools available for download. There is a constant battle between the IDS developers and those who want to escape detection. IDSs are becoming more sophisticated and are able to see through old evasion methods, but attackers are constantly developing new approaches. Those deploying network IDS technology should be aware of its limitations and practice “defense-in-depth” by deploying multiple and diverse security solutions.
IDS technology matures every day, and new advances (including for Snort) are coming soon. Hybrid IDSs combining anomaly and signature coverage appear to be poised for market dominance, at least for the near future. To help improve the state of the art, we also encourage researchers to develop Bayesian deployment schemes and graphical displays of data, as we have described in this chapter.
“Insertion, Evasion, and Denial of Service: Eluding Network Intrusion Detection,” by Thomas Ptacek and Timothy Newsham. (http://downloads.securityfocus.com/library/ids.ps)
“FAQ: Network Intrusion Detection Systems,” by Robert Graham. (http://www.robertgraham.com)
“Defeating Sniffers and Intrusion Detection Systems,” by Horizon. Phrack Magazine, December 1998.
“Ups and Downs of UNIX/Linux Host-Based Security Solutions,” by Anton Chuvakin. (http://www.usenix.org/publications/login/2003-04/pdfs/chuvakin.pdf)
“Network State Monitoring: A Network Security Assessment Concept,” by Andrew Stewart and Andrew Kennedy. (http://www.packetfactory.net/papers/nsm/network_state_monitoring.txt)
“A Look at Whisker’s Anti-IDS Tactics,” by Rain Forest Puppy. (http://www.wiretrip.net/rfp/)
“A Strict Anomaly Detection Model for IDS,” by Sasha/beetle. Phrack Magazine, May 2000.
“NIDS on Mass Parallel Processing Architecture,” by Abreu J. Wanderly, Jr. Phrack Magazine, August 2001.
“A Visual Model for Intrusion Detection,” by Greg Vert, et al. Center for Secure and Dependable Software, Department of Computer Science, University of Idaho, Moscow.
“Complete Snort-Based IDS Architecture,” by Anton Chuvakin and Vladislav V. Myasnyankin. (http://www.securityfocus.com)
[1] This approach to sensor placement evolved from a course on Bayesian diagnosis, taught to medical students by one of the authors.