
Chapter 6. Report Designer
In This Chapter
• Two Main Report Designers from Microsoft
• Visual Studio Haves Versus Have Nots
• Solution, Project, File Hierarchy
• Generating Reports with Visual Studio
Report Designer is the main tool Microsoft provides for developers and tech-savvy information analysts to design and develop reports. This chapter begins by discussing Report Designer and how it gets installed either through Visual Studio or SQL Server Business Development Studio. Then, you use Report Designer to author your first report.
Two Main Report Designers from Microsoft
Microsoft offers two main report designers. The first one is Microsoft SQL Server Report Designer, or simply Report Designer, integrated with Visual Studio. Starting in SQL Server 2005, if you do not have Visual Studio installed, SQL Server setup installs the Visual Studio shell and labels it SQL Server Business Intelligence Developer Studio.
The second report designer is a standalone application called Report Builder. Report Builder is also new for SSRS in 2005. As covered in Chapter 3, “Reporting Services Architecture,” Report Builder provides end users the ability to create their own reports knowing little to no SQL.
The largest difference between the two designers is the target audience, and how they access the designer itself. Visual Studio/SQL Server Business Intelligence Developer Studio is targeted at the developer community in general. To enable end-user reporting, the Report Builder is launched within a browser window from the SSRS Report Manager application. Although it is launched over the web, it is a Windows forms application. To use Report Builder, the end user must have access to a report model. The model contains metadata about the report data source, and it must be created using Visual Studio or Business Intelligence Developer Studio.
Visual Studio Haves Versus Have Nots
At this point, you might be wondering what the difference is between Visual Studio and Business Intelligence Developer Studio. In truth, there is not much difference.
In the first version of SSRS, the only report development tool available was Visual Studio. Many report development shops wanted the ability to use SSRS without having to purchase Visual Studio. In response to this, Microsoft bundled SQL Server Business Intelligence Developer Studio with SSRS 2005. Effectively, SQL Server Business Developer Intelligence Studio is simply a shell of Visual Studio with the ability to develop reports. In fact, throughout the rest of the book, we will use the terms interchangeably.
During the installation, the setup program detects if you have Visual Studio. If you do, the program simply installs the files needed to create reports. If you do not have Visual Studio, setup installs SQL Server Business Intelligence Developer Studio.
Solution, Project, File Hierarchy
As with anything else developed with Visual Studio, it helps to understand some of the basics of how Visual Studio handles files.
If you are developing reports, the developer’s basic unit of work will be the Report Definition Language (RDL) files and associated data sources. Developers can also include the shared data sources, which have an .rds extension. Likewise, if you are working with report models, the default file extension is .smdl (SMDL abbreviates the term Semantic Data Modeling Language).
The files will be contained in a type of project called a “Report Server Project.” If you are creating a SMDL file for use in the client-side Report Builder, the project type is called Report Model Project. A model project will likely also have Data Source View (DSV) and Data Sources (DS). All SSRS-related files (RDL, SMDL, DSV, and DS) are plaintext XML files.
Each of these files gets included into a project. A project has folders to organize the different components. A solution contains many projects. Combined, solutions and projects create a management hierarchy. A solution has multiple projects; a project has multiple files. The solution is nothing more than a container for related projects that might or might not be of the same type.
Generating Reports with Visual Studio
The easy way to get an overview of Visual Studio is to use it to develop a simple report. The following steps are the steps necessary to start Visual Studio and create a report project.
1. Click Start, point to All Programs, point to Microsoft SQL Server 2005, and then click SQL Server Business Intelligence Developer Studio.
2. Click the File menu, click New, and then click Project. The New Project dialog box opens.
3. In the Project Types section on the left, click Business Intelligence Projects.
4. In the Templates section on the right, click Report Server Project, as shown in Figure 6.1.
Figure 6.1. Creating a new report server project.
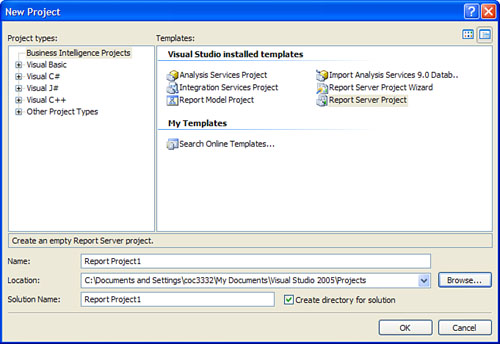
The Templates section should contain a number of options. You might notice that the Name (project name) and the Solution Name keep changing with each option. (These fields are located at the bottom of the dialog box.) You should also make note of the Location, as this is where the project and solution files are stored. For now, simply type AdventureWorksReports in the Name text box because you will be dealing with the AdventureWorks sample database. Your New Project dialog box should look similar to Figure 6.1.
5. Click OK to accept your changes and close the New Project dialog box.
At this point, you should have an empty shell of a project ready to accept new reports and data sources. The project should be contained in a solution called AdventureWorksReports. This will serve as the basis for moving forward. Your screen should look similar to Figure 6.2.
Figure 6.2. Empty project and solution.

Choosing a data source(s) for the report is probably the most crucial step in the report developing process, albeit one of the easiest. The difficulty involves judging the quality of the data presented to the analyst. As the saying goes: “Garbage in—garbage out.”
Having said that, it is a fairly straightforward task to connect Reporting Services to a data source. Using .NET technologies, it is possible to connect to SQL Server, Oracle, and Analysis Services natively. Other possible data sources include using XML either from web services or flat files, and a ODBC- or OLEDB-compliant data source. You can also create reports using data from an SSIS package.
Developers can also use ODBC and OLEDB to connect to a database that does not have native .NET data providers.
This opens Reporting Services up to any number of third-party databases. As if this were not enough, it is possible to write your own adapter using the interfaces provided by Microsoft. This way, report developers could report against any internal or proprietary data source.
Remember that a report data set can contain an embedded data source or it can be pointed to a shared data source. The following steps create a shared data source as the building block for your reports.
1. To open Solution Explorer, click the View menu, and then click Solution Explorer. Right-click Shared Data Sources, and then select Add New Data Source.
2. Name is used to enter the unique name of the data source. Enter AdventureWorks in the text box.
3. Type is a list of all native data sources. At this point, if you want to connect to other types of data sources, such as Oracle or Microsoft SQL Server Analysis Services, you could choose them here. For simplicity’s sake, leave this as Microsoft SQL Server for now.
4. The next major step in setting up a data source is to set the connection string. To get the options, click the Edit button.
At this point, the Connection Properties dialog box should be open. From here, developers can set the properties of the connection and it will develop the connection string. The resulting connection string is nothing more than a .NET style connection string for the data source.
5. Enter localhost (or the name or Report Server you have installed) in the Server Name drop-down list.
6. Because you are working with SQL Server, Use Windows Authentication is already selected by default in the Log On to the Server section.
7. Select AdventureWorks from the list box under Select or Enter a Database Name. The Connection Properties dialog box should look similar to Figure 6.3.
Figure 6.3. Connection Properties dialog box.

8. Test the connection by clicking the Test Connection button. If everything checks out, a pop-up should appear that says Test Connection Succeeded. Click OK on the pop-up box, and then click OK in the Connection Properties dialog box.
9. The connection string box should have a line in it that says Data Source=localhost;Initial Catalog=AdventureWorks.
10. Click the Credentials tab. You should see a window similar to Figure 6.4. Because you are using SQL Server with Windows authentication, the default settings should suffice.
Figure 6.4. Shared data source credentials.
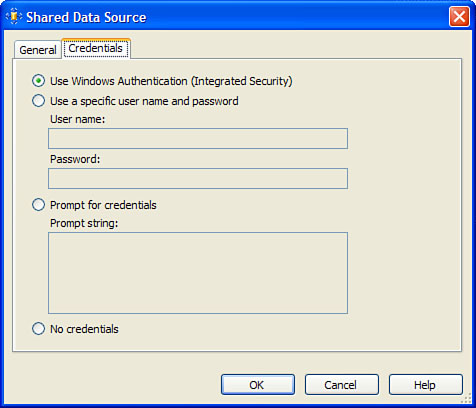
If you were using SQL Server authentication, or another data source type that required a specialized user ID and password, you could enter it here or have Reporting Services prompt you for it. In special cases such as XML files or web services where no authentication is required, developers could use the No credentials option.
11. Click OK for the Shared Data Source dialog box to close.
Now that you have the data source, you can create the report. The following steps create an empty report on which to build on.
1. In Solution Explorer (View, Solution Explorer), right-click on Reports, and then hover over Add and when new options appear, click New Item. see Figure 6.5 as a reference.
Figure 6.5. Adding a new item.

Note
If you selected Add New Report, the Report Wizard appears. Click Cancel to exit the wizard.
2. The Add New Item dialog box opens. From this dialog box, select Report from the Templates menu.
3. Enter the Name of the report Sales by Territory by Salesperson in the Name text box. The screen should look similar to Figure 6.6. When you are finished, click Add.
Figure 6.6. Add New Item dialog box.

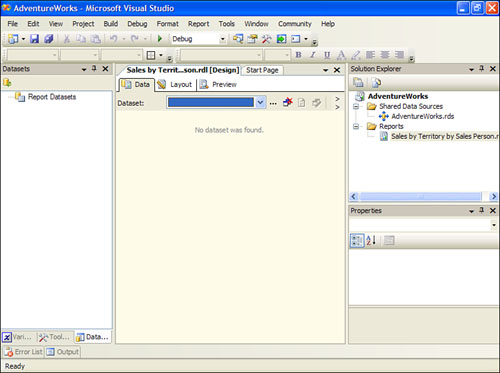
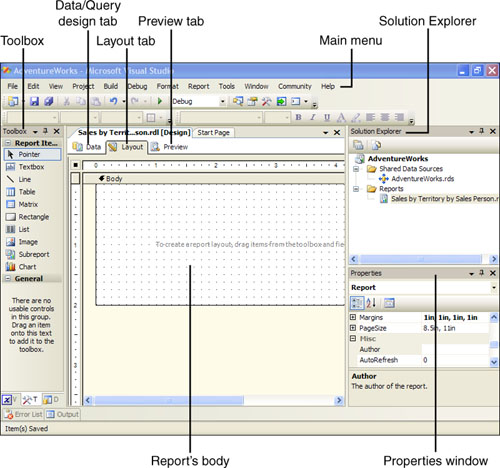
At this point, you should have a new solution, project, and an empty report file. Figure 6.7 show the empty report created inside the project. From here, all that is needed to make a simple report is to collect data from the data source, choose a layout, and preview the report. Note that Report Designer conveniently lays out this process with the tabs across the Report—Data, Layout, and Preview.
SSRS reports collect data into an object called a data set. The results of the query, the SQL statement used for the query, and a pointer to the data source are all stored in the data set. In fact with a little work, you can make Reporting Services read from a System.Data.DataSet object over a web service. The SQL Server Business Intelligence Developer Studio contains a Graphical Query Builder to help write queries. It also allows for free-form queries to be specified by the developer. As we continue, we will see both views.
To continue the life cycle of your report, let’s continue by adding a data set to collect and store your data. The data set you create will use the shared data source to execute a SQL statement and return a resultset. The following steps list how to proceed:
1. From the Data tab, select New Dataset. see Figure 6.8. The Dataset dialog box opens.
Figure 6.8. New Dataset option.

2. The first thing to do is to name the data set. Enter the AdventureWorksDataSet in the Name text box. This uniquely identifies the data set throughout the course of a report. At this point, there are also other text boxes, such as the Query, Command type, and Timeout. The Query text box contains the text of the actual query. Command type has the ADO.NET command type, and Timeout specifies the command timeout value. No value in the command Timeout text box lets the query run indefinitely. Some of the other tabs contain the more advanced options in the data set. The Fields tab contains the list of fields returned by the data set, and is also the place where report developers can enter calculated fields. The Data Options tab contains connection options for the underlying database connection. The Parameters tab contains a list of parameters to be passed onto the query. The most common use of the Parameters tab is to store stored procedure parameters. Lastly, the Filters tab is used to filter the data from the resultset.
3. The dialog box should now look similar to Figure 6.9. At this point, click the OK button to close the dialog box.
Figure 6.9. Dataset dialog box.

Now, you are ready to enter your query. Two main views are available for creating queries. The first one is the Generic Query Designer. This provides an open-ended text view for inputting the query. Basically, it assumes you know what you are doing as a developer. Figure 6.10 shows the Generic Query Designer.
Figure 6.10. Generic Query Designer.
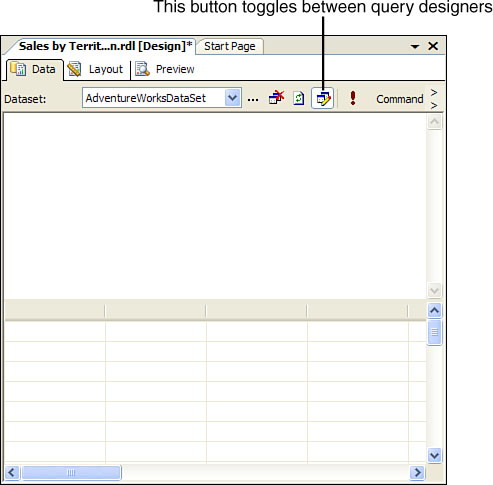
After clicking the OK button in step 3, you should be at the Generic Query Designer. If not, click on the button and you will get there.
4. Enter the following query into the Generic Query Designer:
SELECT
c.[FirstName]+ ' '+ c.[LastName]as SalesPersonName
,[CountryRegionName] = cr.[Name]
,[TerritoryName] = st.[Name]
,[TerritoryGroup] = st.[Group]
,s.[SalesQuota]
,s.[SalesYTD]
,s.[SalesLastYear]
FROM [Sales].[SalesPerson] s
INNER JOIN [HumanResources].[Employee] e
ON e.[EmployeeID] = s.[SalesPersonID]
LEFT OUTER JOIN [Sales].[SalesTerritory] st
ON st.[TerritoryID] = s.[TerritoryID]
INNER JOIN [Person].[Contact] c
ON c.[ContactID] = e.[ContactID]
INNER JOIN [HumanResources].[EmployeeAddress] ea
ON e.[EmployeeID] = ea.[EmployeeID]
INNER JOIN [Person].[Address] a
ON ea.[AddressID] = a.[AddressID]
INNER JOIN [Person].[StateProvince] sp
ON sp.[StateProvinceID] = a.[StateProvinceID]
INNER JOIN [Person].[CountryRegion] cr
ON cr.[CountryRegionCode] = sp.[CountryRegionCode];
The second view is the Graphical Query Designer. It shows the same data, but it is a graphical view. Developers can toggle between the two tools using the toolbar button shown in Figure 6.10. Experienced Visual Studio developers will recognize this as the Visual Query Builder. Figure 6.11 shows the graphical view.
Figure 6.11. Visual Query Builder.

As with any tool to make life easier, you usually have to give up some control. Some queries are too complex to be displayed graphically. For example, derived tables would not be displayed in the first release of SSRS. SSRS 2005 now has that capability, but you might run into other syntaxes that it does not know how to display graphically.
Layout Screen
After selecting your data, the next step is to lay out or present the data. Layout assistance is provided by the Toolbox, Dataset view, and Layout dockable windows.
After you are finished selecting data in the Data view, select the Layout tab in the Report Design window. This brings up a grid similar to Figure 6.12.
Figure 6.12. Report Layout view.
The toolbox (shown in Figure 6.12) is accessible by selecting the View, Toolbox menu. This has all the report item controls you might use while authoring reports. The simplest way to use them is to drag the control you want onto the layout.
Data can be inserted from the Datasets window (View, Datasets menu). In the first release of SSRS, this was called Fields. The Datasets view (see Figure 6.13) contains a treelist of available fields to use from the data sets.
Figure 6.13. Treelist with data set fields.

Use of the fields is similar to the report items; drag the field onto a report item or onto the layout itself. If you add the field onto the layout, it creates a text box to contain the field.
Any item on the report can be modified through the Properties window. The Properties window can be accessed by pressing the F4 key, or by selecting View, Properties Window from the menu. Figure 6.14 shows the Properties window for a text box.
Figure 6.14. Properties window.

At this point in the report development process, you need to take the results of your query and apply a layout and format to them. Chapter 2, “Reporting Services Capabilities: Presentation, Navigation, and Programmability,” gave an overview of the capabilities of SSRS from a report layout and design perspective. For now, let’s make a simple tabular report and add a few bells and whistles. Complete the following steps:
1. Drag a text box to the Layout view. In the Properties window (F4), select the text box (most likely the text box you just added is already selected). Continue to change the following property values to those specified for the control named
“ReportTitle.”
Name: ReportTitle
Value: My First Report
Location: Top=0, Left=0
Size: Height=.33in, Width 3.5
Color: #1c3a70
Font: FontStyle=Normal, FontFamily=Tahoma, FontSize=18pt, FontWeight=Normal
2. Drag a list onto the layout view. Set the following properties:
Location: Top=0, Left= .33in
Size: Height=1.35in, Width 6in
DatasetName:AdventureWorksDS (can be selected from the drop-down list)
3. Click the “...” button in the Properties window for the list. The Grouping and Sorting Properties dialog box should open. Change the properties on the dialog box to match those in Figure 6.15.
Figure 6.15. Grouping and sorting properties for the list.

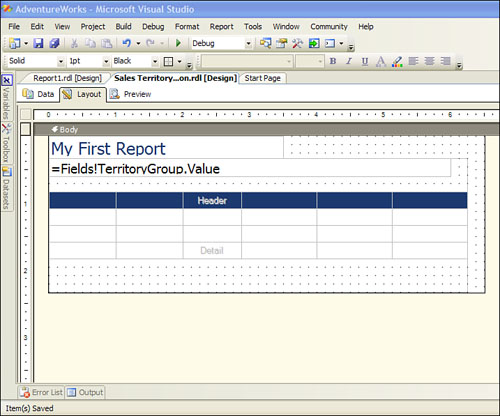
4. Drag a second text box to the layout and place it inside the list. Change the following properties
Name: TerritoryGroup
Value: =Fields!TerritoryGroup.Value (this can be dragged onto the control from the datasets toolbox, or selected from the drop-down list)
Location: Top=0, Left=0
Size: Height=.27in, Width 6
Font: FontStyle=Normal, FontFamily=Tahoma, FontSize=14pt, FontWeight=Normal
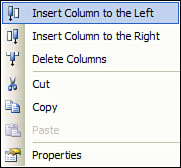
5. Drag a table and place it inside the list. By default, the table comes with three columns, which are all a little more than 2 inches. Click on the bar above each column; if selected successfully, the entire column should be selected. After a column is selected, use the Properties window and change the width property to 1in. Continue to do this for all three columns. After you are finished, select the rightmost column, right-click on the column, and select Insert Column to the Right. Refer to Figure 6.16. Repeat three times. The table should now have six columns equally spaced at 1-inch wide.
Figure 6.16. Selecting columns for a table.
6. Right-click on the button next to the table footer row. From the pop-up menu, deselect Table Footer. See Figure 6.17.

7. Click on the button next to the report header row. After the row is selected, use the Properties window to set the following properties:
BackgroundColor: #1c3a70
Color: White
Font: FontStyle=Bold, FontFamily=Tahoma, FontSize=11pt, FontWeight=Normal
8. Click the button at the upper-left corner of the table. By doing this, the entire table should now be selected. If so, right-click on the upper-left corner of the table and select Properties from the pop-up menu. The Table Properties dialog box opens.
9. Under Dataset Name, select AdventureWorksDS from the drop-down menu. Check Repeat Header Rows on Each Page from the Header/footer section.
10. Click the Groups tab. Then click the Add button. The Grouping and Sorting Properties dialog box opens. Under the Group On: section, there is a list box where you tell the table to group on one or more than one value. To illustrate, you will group on Country Region, and then Territory Name. From the drop-down menu in the list box, select the expression =Fields!CountryRegionName.Value. Under the Name text box, enter the value table1_CountryRegion_Group. Uncheck Include Group Footer. Figure 6.18 illustrates. Click OK when you are finished.
Figure 6.18. Grouping and Sorting Properties.

11. Proceed to make a second group by repeating the process described in step 10. This time, name the group table1_TerritoryName_Group and have it group on the expression =Fields!TerritoryName.Value. Click OK to exit the Grouping and Sorting Properties dialog box, and click OK again to exit the Table Properties dialog box. see Figure 6.19 for a view of the table.
Figure 6.19. Completed table layout.
12. Now that the table groups have been created, let’s add the data to the table. Start by dragging the field CountryRegionName from the Dataset field collection over to the uppermost row (labeled 1) on the left column. Be sure not to place it in the table header. Drag the TerritoryName fields to the lower-right side of the CountryRegionName field. Continue to drag the fields SalesPersonName, SalesQuota, Sales YTD, and SalesLastYear to the detail row.
13. Add SalesQuota, Sales YTD, and SalesLastYear into both of the header rows. Notice how the expression changes from the detail row. In the detail, the value is displayed by salesperson, whereas for each of the headers the value is the sum of the amount for the grouping used. Hence Group 1 is the sum of the amount for Country, and Group 2 is the sum of the amount for Terrritory.
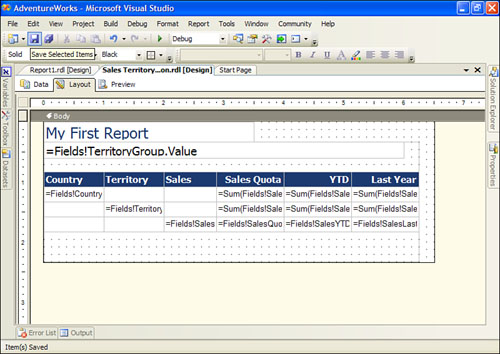
14. Select all of the text boxes used to display dollars. Using the Properties window, change the format property of all the text boxes to c2. This formats all of the dollars as currency. Adjust the table headings as appropriate. Figure 6.20 shows the completed report in Layout mode.
Figure 6.20. Completed report in Layout mode.
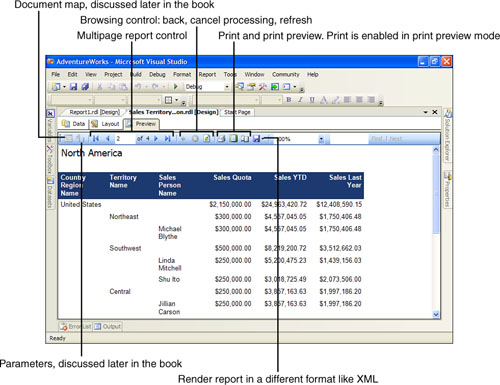
This concludes the starter report. To preview this report, click on the Preview tab in Report Designer. The Preview tab renders the report within the SQL Server Business Intelligence Studio. The tab also has the capability to preview parameters and print preview. Figure 6.21 shows the completed report in Preview mode.
Figure 6.21. Completed report in Preview mode.
Summary
SQL Server Business Intelligence Studio is nothing more than the shell of Visual Studio. Both products house the main report development tool from Microsoft—SQL Server Report Designer. Over the next several chapters, you will see how to use Report Designer to develop powerful and visually appealing reports for all kinds of end users.