


Monitoring IBM Tivoli Directory Server
This chapter will cover the monitoring of the IBM Tivoli Directory server covering various monitoring tools and operating system commands that can be used for monitoring ITDS.
17.1 Overview
Like any application, the ability for an administrator to understand what the current state of the application at any given time is critical.
The monitoring of the directory is important from the following perspectives:
1. Security issues: To track unauthorized access and take corrective measures. Let us take some example where we would like to prevent unauthorized access to the directory. There are a lot of instances, whereby the directory server may come under a Denial of Service (DOS) attack. In a DOS attack, anonymous clients send a flood of requests for the server to serve, by opening a set of connections with the server. The clients then disappear and are not available to hear back from the server. The server does not understand what is to be done with the open connection and it waits for the client to return. Thus we have some system resources allocated and kept reserved by the server for a client which is never to return. If there is a pool of such connections a lot of system resources would be wasted and a stage would come, whereby the open connections eat up all the available resources and the server is not able to serve any further requests. We are sure all of us would like to avoid such attacks on our servers. Monitoring the server would help overcoming issues like these and consequently secure our server.
2. Performance issues: To find out reasons of slow or poor performance. Performance of the directory server may be low owing to a lot many reasons:
– The DB2 buffer pools might not be tuned as per the directory requirements, though there are resources available.
– The Directory Server caches might not be tuned to the optimum.
– There might be some important indexes missing.
– There might be a database reorganization required and many more.
Out of the above, some problems might be caught or prevented using the monitoring tools. Monitoring tools help us in deriving the optimal values for a set of directory parameters after statistical analysis of the existing workload and resources.
3. Throughput measurement: To derive statistics as like how many searches have completed in a given timeframe, how many additions have completed, how many binds have occurred to the server, how many operations have completed. Keeping track of such figures helps us to calculate the throughput of the server. This throughput might be quite influential for the dependant products that are going to use the directory server.
17.2 Monitoring tools
The ITDS is provided with a set of tools which can be used to monitor the directory server against any anomalies. The ITDS monitoring can be accomplished in many ways as listed below:
•Searching against the base cn=monitor.
•Searching through the changelog database.
•Analyzing log files.
All the monitoring commands have both a GUI interface and the corresponding command line equivalent.
The GUI interface is provided by Web Administration Tool, supplied with the IBM Tivoli Directory Server.
The command-line interface is provided by the following client utilities:
•ldapsearch
•ldapexop
•ibmdirctl
The changelog database is a separate LDAP database, that stores the changes pertaining to the DIT, in LDIF format.
All the relevant log files can be read using the command-line tools or through the GUI, whichever suits one.
|
Note: Turning on any sort of logging or using a database to log the changes, would hamper the directory performance. The obvious reason is that such activities make the directory do more things than it liked to. For example, the directory server may need to write to 4 places rather than 1. Hence, it is strictly advised that such options be turned on only in the event that the directory server is doing badly and it needs to be tuned. Disable these options, once you have done with you’re the problem analysis.
|
17.2.1 Viewing server state
The first and foremost thing, prior to monitoring ibmslapd, would be to check whether it is still alive, or whether it is in a state where we can run any monitoring tools on it. The server state refers to whether the server is currently running in normal mode, safe mode or it is currently stopped. Let us see how this is accomplished.
Using Web administration tool
To use the Web administration tool:
1. Connect to the server, whose status is to be checked, through the Web administration tool.
2. Select Server administration and then click View server status in the left hand panel. The General tab is selected by default. If not, select it.
3. The current state of the server is shown in the right panel. We need to watch out for the Server status label.
|
Note: The current sate of the server can be determined by looking at the icon next to the directory server name or IP in the top of right panel.
•If the green button is enabled, the server is running.
•If the yellow button is enabled, the server is running in safe mode.
•If the red button is enabled, the sever is stopped.
|
Figure 17-1 shows the relevant portion of the panel.

Figure 17-1 Viewing the server status via Web administration tool
Using command line
The following command returns the state of the server:
ibmdirctl-D <adminDN> -w <adminPW> status
The above command does not say whether the server is running in safe mode or no. We need to confirm it by running a rootDSE search after this command and check for the attribute ibm-slapdisconfigurationmode which should be false for a normal mode.
On UNIX:
ldapsearch -D <adminDN> -w <adminPW> -s base objectclass=* | grep config
On Windows:
ldapsearch -D <adminDN> -w <adminPW> -s base objectclass=*
Search for the value against the ibm-slapdisconfigurationmode attribute.
Here is an example of how ibmdirctl would be used to get to know the server status and then the status actually verified using the root dse:
C:>ibmdirctl -D <adminDN> -w <adminPW> status
ibmslapd process is not running.
C:>ibmdirctl -D <adminDN> -w <adminPW> start
Start operation succeeded
C:>ibmdirctl -D <adminDN> -w <adminPW> status
ibmslapd process is starting.
C:>ldapsearch -s base objectclass=* | grep configuration
ibm-slapdisconfigurationmode=FALSE
If you are just interested in knowing if the server is up (irrespective of whether it is up in normal mode or in configuration mode), you can just check out if the ibmslapd process is currently running using the ps command (ps -eaf | grep ibmslapd | grep -v grep), on UNIX of course. In case of Windows, you can see if the service IBM Tivoli Directory Server V5.2 is up and running.
17.2.2 Viewing status of worker threads
This option is required when the server is not performing as expected or performing poorly. This options displays the information on the worker threads that are currently active. The state of a worker thread includes many details like thread number, information about the client it is serving, the type of work request received etc. Performing this activity suspends all the server activity until it is completed. A warning to that effect is displayed, which explains that the time to complete this operation depends on the number of connection and worker threads. Ensure that auditing is enabled before using the below tools for viewing the states of worker threads.
Using Web administration tool
To use this:
1. Connect to the relevant directory server, whose status is to be checked, via the Web administration tool.
2. Select Server administration and then click View server status server in the left hand panel. Select View worker status from the left-hand panel.
3. A warning message appears as shown in Figure 17-2.

Figure 17-2 Warning while observing the status of the worker threads
4. Click Yes to proceed.
In response to the above confirmation, we would see a screen showing us the current status of the worker threads, as seen in Figure 17-3.

Figure 17-3 The current status of the worker threads
Using command line
In order to retrieve all information related to worker threads that are currently active, issue the following command:
ldapsearch -D <adminDN> -w <adminPW> -s base -b cn=workers,cn=monitor objectclass=*
Here is the output that can be expected:
cn=workers,cn=monitor
cn=workers
objectclass=container
cn=thread2428,cn=workers,cn=monitor
thread=2428
ldapversion=V2
binddn=cn=root
clientip=127.0.0.1
clientport=2058
connectionid=1412
received=2004-02-19 08:07:41 GMT
workrequest=search
base=cn=workers,cn=monitor
scope=baseObject
derefaliases=neverDerefAliases
typesonly=false
filter=(objectclass=*)
attributes=all
This information is the same as the information displayed on the GUI. Here is what the above attributes mean:
•thread: The number of the worker thread. For example 2428.
•ldapversion: The LDAP version level, either V1 or V2.
•binddn: The DN used to bind to the server.
•clientip: The IP address of the client.
•clientport: The port used by the client.
•connectionid: The number identifying the connection.
•received: The date and time that the work request was received.
•workrequest: The type of work request received and additional information about the request. For example, if the request was a search, the following information is also provided:
base=cn=workers,cn=monitor
scope=baseObject
derefaliases=neverDerefAliases
typesonly=false
filter=(objectclass=*)
attributes=all
That is to say that worker thread 2428 had the responsibility of serving the search request for the base cn=workers, cn=monitor, through the search, which was fired to collect the above information.
17.2.3 Viewing connections information
The connections information is handy in case of problems where the server rejects client connections, for example, if many clients are trying to connect to the server and the number of connections requested is exceeding that permitted by the operating system. The information about the server connections consists of the connection id, the client ip address which requested the connection, bind dn etc. There are as expected, two ways of viewing this information.
Using Web administration tool
Expand the Server administration category in the navigation area as in the previous steps. Click Manage server connections. A table containing the following information for each connection is displayed:
•DN: Specifies the DNs of a client connection to the server.
•IP address: Specifies the IP address of the client that has a connection to the server.
•Start time: Specifies the date and time when the connection was made.
•Status: Specifies whether the connection is active or idle. A connection is considered active if it has any operations in progress.
•Ops initiated: Specifies the number of operations requested since the connection was established.
•Ops completed: Specifies the number of operations that have been completed for each connection.
•Type: Specifies whether the connection is secured by SSL or TLS. Otherwise the field is blank.
Figure 17-4 shows the relevant screenshot.

Figure 17-4 Portion of the panel showing the server’s connections
|
Note: The table shown in Figure 17-4 displays up to 20 connections at a given instant of time.
|
We can specify to have this table displayed by either DN or IP address by expanding the drop-down menu at the top of the panel and making a selection. The default selection is by DN. Similarly we can also specify whether to display the table in ascending or descending order.
Click Refresh to update the current connection information.
If you are logged in as the administrator or as a member of the administration group, you have additional selections to disconnect server connections available on the panel. This ability to disconnect server connections enables us to stop denial of service attacks and to control server access. You can disconnect a connection by expanding the drop-down menus and selecting a DN, an IP address or both and clicking Disconnect. Depending on our selections the actions shown in Table 17-1 will occur.
Table 17-1 Disconnection rules.
|
DN chosen
|
IP address chosen
|
Action
|
|
<DN Value>
|
None
|
All connections bound with the specified DN are disconnected.
|
|
None
|
<IPvalue>
|
All connections over the specified IP address are disconnected.
|
|
<DN Value>
|
<IPvalue>
|
All connections bound as the specified DN and over the specified IP address are disconnected.
|
|
None
|
None
|
This is not a valid condition. You must specify either a DN or an IP or both.
|
The default value for each of the drop-down menus is None.
To disconnect all server connections except for the one making this request click Disconnect all. A confirmation warning is displayed. Click OK to proceed with the disconnect action or click Cancel to end the action and return to the Manage server connections panel.
Using command line
We can run a search with the searchbase "cn=connections,cn=monitor" to get information about server connections:
ldapsearch -D <adminDN> -w <adminPW> -s base -b cn=connections,cn=monitor objectclass=*
This command returns information in the following format:
cn=connections,cn=monitor
connection=3 : 127.0.0.1 : 2004-02-22 06:08:10 GMT : 1 : 1 : CN=ROOT : :
|
Note: If appropriate, an SSL or a TLS indicator is added on each connection.
|
The meaning of the values delimited by “:” in the above output can be very well got by comparing it with the relevant screenshot of the Webadmin (Figure 17-4 on page 554).
To end server connections, issue one of the following commands:
# To disconnect a specific DN:
ldapexop -D<adminDN> -w <adminPW> -op unbind -dn cn=john
# To disconnect a specific IP address:
ldapexop -D <adminDN> -w <adminPW> -op unbind -ip 9.182.173.43
#To disconnect a specific DN over a specific IP address:
ldapexop -D <adminDN> -w <adminPW> -op unbind -dn cn=john -ip 9.182.173.43
#To disconnect all connections:
ldapexop -D <adminDN> -w <adminPW> -op unbind -all
Does not this option give the great advantage of killing the connections, which are seen harmful for our directory performance/stability. But as the chapter title suggests, it would need a constant monitoring to find out and disconnection unwanted, harmful connection. Do not take this statement to be contradictory to the note about performance click, when the monitoring is on. The performance click is felt only when the logging and/or the changelog database come into the picture and does not relate to the searches. The searches will not slow down a server.
17.2.4 Viewing other general information about the directory server
Except the connection and worker thread information, a lot of other general information about the server can be fetched. There is voluminous amount of attributes that can be fetched from the server. As usual we have two ways of fetching these attributes.
Using Web administration tool
To use this:
1. Connect to the required directory server, using the Web Administration tool.
2. Click View server status. This panel has nine tabs. These are:
– General tab: This tab provides the generic information pertaining to the server, as like:
• Hostname: The host name of the LDAP server.
• Server status: The server status as to whether it is currently Running, Stopped, or Running in configuration only mode. We can determine the server status at any time by viewing the three icons displayed in the upper left corner of the server status area.
• Start time: The time the server was started. The start time is in the format: year-month-day hour:minutes:seconds GMT.
• Current time: The time at the instant the General tab was clicked or the time when the Refresh button has been click. The current time is in the format: year-month-day hour:minutes:seconds GMT.
• Total threads: The number of worker threads being used by the server.
• Total threads blocked on write: The number of threads sending data back to the client.
• Total threads blocked on read: The number of threads reading data from the client.
• Number of connections: The number of connections, currently active.
• Total connections: The total number of connections since the server was started.
• Number of entries sent: The number of entries sent by the server since the server was started.
• Percentage of entry cache used: The percentage of entry cache currently used. This value is not displayed in configuration only mode.
• Percentage of search filter cache used: The percentage of search filter cache currently used. This value is not displayed in configuration only mode.
• ACL cache: A Boolean value indicating that the ACL cache is active (TRUE) or inactive (FALSE). This value is not displayed in configuration only mode.
• Maximum ACL cache size: The maximum number of entries allowed in the ACL cache. This value is not displayed in configuration only mode.
• Bypass alias dereferencing: The server runtime value that indicates if alias processing can be bypassed. It displays true, if no alias object
• Total number of SSL connections: The total number of SSL connections since the server was started.
• Total number of TLS connections: The total number of TLS connections since the server was started.
– Operations counts: This tab counts the different type of operations requested/competed with the server:
• Number of operations requested: The number of requests initiated since the server was started.
• Number of operations completed: The number of requests completed, since the server was started.
• Number of search operations requested: The number of searches initiated since the server was started.
• Number of search operations completed: The number of searches completed, since the server was started.
• Number of bind operations requested: The number of bind requests since the server was started.
• Number of bind operations completed: The number of bind requests completed since the server was started.
• Number of unbind operations requested: The number of unbind requests since the server was started.
• Number of unbind operations completed: The number of unbind requests completed since the server was started.
• Number of add operations requested: The number of add requests since the server was started.
• Number of add operations completed: The number of add requests completed since the server was started.
• Number of delete operations requested: The number of delete requests since the server was started.
• Number of delete operations completed: The number of delete requests completed since the server was started.
• Number of modify RDN operations requested: The number of modify RDN requests since the server was started.
• Number of modify RDN operations completed: The number of modify RDN requests completed since the server was started.
• Number of modify operations requested: The number of modify requests since the server was started.
• Number of modify operations completed: The number of modify requests completed since the server was started.
• Number of compare operations requested: The number of compare requests since the server was started.
• Number of compare operations completed: The number of compare requests completed since the server was started.
• Number of abandon operations requested: The number of abandon requests since the server was started.
• Number of abandon operations completed: The number of abandon requests completed since the server was started.
• Number of extended operations requested: The number of extended requests since the server was started.
• Number of extended operations completed: The number of extended requests completed since the server was started.
• Number of unknown operations requested: The number of unknown requests since the server was started.
• Number of unknown operations completed: The number of unknown requests completed since the server was started.
– Work queue: This tab gives the current status on the work queue. Do not confuse this with the status of the worker threads.
• Number of worker threads available: The number of worker threads available for work.
• Depth of the work queue: The current size of the work queue.
• Largest size of the work queue: The largest size that the work queue has ever reached.
• Number of connections closed by automatic connection cleaner: The number of idle connections closed by the automatic connection cleaner.
• Number of times the automatic connection cleaner has run: The number of times the automatic connection cleaner has run.
• Emergency thread currently active: The indicator of whether the emergency thread is running.
• Number of times the emergency thread has been activated: The number of times the emergency thread has been activated.
• Last time the emergency thread was activated: The last time the emergency thread was activated.
– Directory cached attributes: This tab provides the information pertaining to the directory’s cached attributes.
• Attribute: The name of the attribute.
• Number of cache clicks: The number of times the attribute filter has been used after it was cached.
• Cache size: The amount of memory used by the attribute.
• Cached attribute total size (in kilobytes): The amount of memory being used by the cache. This number includes additional memory used to manage the cache, that is not charged against the individual attributes. Consequently, this total is larger than the total of the individual attribute memory usage.
• Cached attribute configured size: The maximum amount of memory in bytes assigned to this cache.
– Directory cache candidates: This tab gives information on which attributes are good candidates for being put in the attribute cache.
• Attribute: The name of the attribute.
• Number of clicks: The number of times the attribute filter has been used.
– Changelog cached attributes: This tab gives information on the cached attributes pertaining to the changelog.
• Attribute: The name of the attribute.
• Number of cache clicks: The number of times the attribute filter has been used after it was cached.
• Cache size: The amount of memory used by the attribute.
• Cached attribute total size (in kilobytes): The amount of memory being used by the cache. This number includes additional memory used to manage the cache, that is not charged against the individual attributes. Consequently this total is larger than the total of the individual attribute memory usage.
• Cached attribute configured size: The amount of memory assigned to this cache.
– Changelog cache candidates: This tab provides information on the attributes that are good candidates for being kept in the changelog cache.
• Attribute: The name of the attribute.
• Number of clicks: The number of times the attribute filter has been used.
– Trace and logs: This tab provides information pertaining to the server trace and the relevant logs.
• Trace enabled: The current trace value for the server. TRUE, if collecting trace data, FALSE, if not collecting trace data.
• Trace message level: The current ldap_debug value for the server. The value is in hexadecimal form, for example, 0x0=0, 0xffff=65535.
• Trace message log: The name of the file that contains the trace output. If the value is stderr, the output is displayed in the command window where the LDAP server was started. If the server was not started from the command line, no data is displayed.
• Number of messages added to server logs: The number of error messages recorded since the server started.
• Number of messages added to CLI error log: The number of DB2 error messages recorded since the server started.
• Number of messages added to audit log: The number of messages recorded by the audit log since the server started.
• Number of error messages added to audit log: The number of failed operation messages recorded by the audit log.
Using command line
The above information about the server can be obtained using a ldapsearch against base cn=monitor. The command for doing a monitor search is:
ldapsearch -D <adminDN> -w <adminPW> -s base -b cn=monitor objectclass=*
The information returned by the above search is as follows:
•version=IBM Tivoli Directory (SSL), Version 5.2.
•totalconnections: The total number of connections since the server was started.
•total_ssl_connections: The total number of SSL connections since the server was started.
•total_tls_connections: The total number of TLS connections since the server was started.
•currentconnections: The number of active connections.
•maxconnections: The maximum number of active connections allowed.
•writewaiters: The number of threads sending data back to the client.
•readwaiters: The number of threads reading data from the client.
•opsinitiated: The number of requests since the server was started.
•livethreads: The number of worker threads being used by the server.
•opscompleted: The number of completed requests since the server was started.
•entriessent: The number of entries sent by the server since the server was started.
•searchesrequested: The number of searches requested since the server was started.
•searchescompleted: The number of searches completed since the server was started.
•bindsrequested: The number of bind operations requested since the server was started.
•bindscompleted: The number of bind operations completed since the server was started.
•unbindsrequested: The number of unbind operations requested since the server was started.
•unbindscompleted: The number of unbind operations completed since the server was started.
•addsrequested: The number of add operations requested since the server was started.
•addscompleted: The number of add operations completed since the server was started.
•deletesrequested: The number of delete operations requested since the server was started.
•deletescompleted: The number of delete operations completed since the server was started.
•modrdnsrequested: The number of modify RDN operations requested since the server was started.
•modrdnscompleted: The number of modify RDN operations completed since the server was started.
•modifiesrequested: The number of modify operations requested since the server was started.
•modifiescompleted: The number of modify operations completed since the server was started.
•comparesrequested: The number of compare operations requested since the server was started.
•comparescompleted: The number of compare operations completed since the server was started.
•abandonsrequested: The number of abandon operations requested since the server was started.
•abandonscompleted: The number of abandon operations completed since the server was started.
•extopsrequested: The number of extended operations requested since the server was started.
•extopscompleted: The number of extended operations completed since the server was started.
•unknownopsrequested: The number of unknown operations requested since the server was started.
•unknownopscompleted: The number of unknown operations completed since the server was started.
•slapderrorlog_messages: The number of server error messages recorded since the server was started or since a reset was performed.
•slapdclierrors_messages: The number of DB2 error messages recorded since the server was started or since a reset was performed.
•auditlog_messages: The number of audit messages recorded since the server was started or since a reset was performed.
•auditlog_failedop_messages: The number of failed operation messages recorded since the server was started or since a reset was performed.
•filter_cache_size: The maximum number of filters allowed in the cache.
•filter_cache_current: The number of filters currently in the cache.
•filter_cache_click: The number of filters found in the cache.
•filter_cache_miss: The number of filters not found in the cache.
•filter_cache_bypass_limit: Search filters that return more entries than this limit are not cached.
•entry_cache_size: The maximum number of entries allowed in the cache.
•entry_cache_current: The number of entries currently in the cache.
•entry_cache_click: The number of entries found in the cache.
•entry_cache_miss: The number of entries not found in the cache.
•acl_cache: A Boolean value indicating that the ACL cache is active (TRUE) or inactive (FALSE).
•acl_cache_size: The maximum number of entries in the ACL cache.
•cached_attribute_total_size: The amount of memory used by the directory attribute cache.
•cached_attribute_configured_size: The amount of memory assigned to the directory attribute cache.
•currenttime: The current time on the server. The current time is in the format: year-month-day hour:minutes:seconds GMT.
•starttime: The time the server was started. The start time is in the format: year-month-day hour:minutes:seconds GMT
•trace_enabled: The current trace value for the server. TRUE, if collecting trace data, FALSE, if not collecting trace data. See ldaptrace for information about enabling and starting the trace function.
•trace_message_level: The current ldap_debug value for the server. The value is in hexadecimal form, for example: 0x0=0, 0xffff=65535
•trace_message_log: The current LDAP_DEBUG_FILE environment variable setting for the server.
•en_currentregs: The current number of client registrations for event notification.
•en_notificationssent: The total number of event notifications sent to clients since the server was started.
•bypass_deref_aliases: The server runtime value that indicates if alias processing can be bypassed. It displays true, if no alias object exists in the directory, and false, if at least one alias object exists in the directory.
•available_workers: The number of worker threads available for work.
•current_workqueue_size: The current depth of the work queue.
•largest_workqueue_size: The largest size that the work queue has ever reached.
•idle_connections_closed: The number of idle connections closed by the Automatic Connection Cleaner.
•auto_connection_cleaner_run: The number of times that the Automatic Connection Cleaner has run.
•emergency_thread_running: The indicator of whether the emergency thread is running.
•totaltimes_emergency_thread_run: The number of times the emergency thread has been activated.
•lasttime_emergency_thread_run: The last time the emergency thread was activated.
Now let us see some examples as to how the above attributes help in tuning the directory.
The following sections show examples of using values returned by the ldapsearch command with “cn=monitor” to calculate the throughput of the server and the number of add operations completed on the server in a certain timeframe.
Throughput example: The following example shows how to calculate the throughput of the server by monitoring the server statistic called opscompleted, which is the number of operations completed since the LDAP server started.
Suppose the values for the opscompleted attribute obtained by issuing two ldapsearch commands to monitor the performance statistics, one at time t1 and the other at a later time t2, are opscompleted (t1) and opscompleted(t2) respectively. The average throughput at the server during the interval between t1 and t2 can be calculated as:
(opscompleted(t2) - opscompleted(t1) - 3)/(t2 -t1)
Three is subtracted to account for the number of operations performed by the ldapsearch command itself.
Workload example: The monitor attributes can be used to characterize the workload, similar to the throughput example, but split out by type of operation. For example, we can calculate the number of add operations that were completed in a certain amount of time.
Suppose the values for the addscompleted attribute obtained by issuing two ldapsearch commands to monitor the performance statistics, one at time t1 and the other at a later time t2, are addscompleted (t1) and addscompleted(t2) respectively. The number of add operations completed on the server during the interval between t1 and t2 can be calculated as:
(addscompleted(t2) - addscompleted(t1) - 3)/(t2 -t1)
Three is subtracted to account for the number of operations performed by the ldapsearch command itself.
Similar calculations can be done for other operations, such as searchescompleted, bindscompleted, deletescompleted, and modifiescompleted.
If you want to know the cache settings suitable for your environment, you note down the cache settings at this point of time and also the relevant performance/throughput. Then change the cache settings and note down the throughput again.
Once you obtain a set of throughputs in the above manner, prepare the trend/charts whereby you get to know the optimal value for the cache settings. Likewise, we can tune the other parameters too and get their optimal value. Please have a hands on with cn=monitor searches as they are the most powerful means of monitoring the directory for performance.
17.2.5 Analyzing changelog
Prior to analyzing the changelog, lets see why do we need to have a changelog in place. The change log is maintained in the form of a separate database as compared to the LDAP database, where the DIT is stored. It is used to record changes to the schema or directory entries in the typical LDAP entry structure that can be retrieved through the LDAP API. The change log records all update operations that happen at the directory server: add, delete, modify, and modrdn. The change log enables an IBM Tivoli Directory Server client application to retrieve a set of changes that have been made to an IBM Tivoli Directory Server database. The client might then update its own replicated or cached copy of the data.
Viewing the changelog using the Web Administration console
To do this:
1. Log into the directory server using the Web administration tool.
2. Click the tab Directory management. Click Manage entries. Then expand the suffix cn=changelog.
3. All the recorded changes to the DIT will appear below it in the format changenumber=<integer>.
Figure 17-5 shows the screenshot of the changelog contents, with just one change having been recorded, in this database.
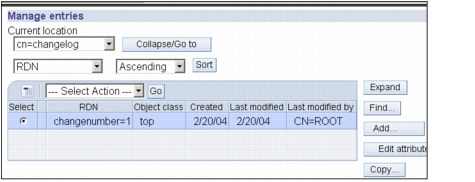
Figure 17-5 Contents of the change log
If you want to see details on a particular change that was performed against the directory server, you may click the Edit attributes button, shown above.
Viewing the changelog using ldapsearch
All the changenumbers under the suffix cn=changelog can be retrieved by the following command:
ldapsearch -D cn=<adminDN> -w <adminPW> -b cn=changelog changenumber=*
Also a particular change number can be requested using:
ldapsearch -D cn=<adminDN> -w <adminPW> -b cn=changelog changenumber=<integer>
It returns information in the following format:
changenumber=1,cn=changelog
objectclass=top
objectclass=changelogentry
objectclass=ibm-changelog
changenumber=1
targetdn=o=ibm,c=ind
changetype=modify
changetime=20031217094348
ibm-changeInitiatorsName=CN=ROOT
changes=replace: businesscategory
businesscategory: something
|
Note: Enabling the changelog is seen as a performance bottleneck, because the directory server would have to write to the LDAP database as well as log the relevant information in the changelog database. Therefore it is advisable to have the changelog enabled only in the event that a problem is being debugged or if another application in your organization (that is, a meta-directory tool) required it to be on.
|
17.2.6 Analyzing log files
In this section we analyze the log files.
Audit log
Audit logging is used to improve the security of the directory server. A default audit plug-in is provided with the directory server. Depending upon the audit configuration parameters, this plug-in might log an audit entry in the default or specified audit log for each LDAP operation the server processed. The system administrator can use the activities stored in the audit log to check for suspicious patterns of activity, in an attempt to detect security violations. If security is violated, the audit log can be used to determine how and when the problem occurred and perhaps the amount of damage done. This information is very useful, both for recovery from the violation and, possibly, in the development of better security measures to prevent future problems. We can also write our own audit plug-ins to either replace, or add more processing to, the default audit plug-in.
By default the audit log is disabled.
|
Note: Members of the administrative group can view the audit log and the associated settings but not modify them. Only the root administrator is allowed to access, change or clear the audit log files.
|
The audit log can be configured to track various activities happening against the directory server like attempted logins, requested operations, the timestamp of the operations etc. It is a plain text file created in the /var/ldap directory in case of unix systems (ldapinstalldiribmldapvar in the case of windows). The audit log file is a crucial tool in monitoring the directory activities.
In order to start using the Audit Log, it first needs to enabled. As expected, there are two ways of enabling the audit log.
Using Web administration tool
To use this:
1. Expand Logs in the navigation area, click Modify audit log settings.
2. Select Enable audit logging to use the audit log utility.
3. Select the Audit version you want to use. Version 1 maintains previous audit logging capabilities for any applications that parse the audit log. Version 2 enables you to log extended operations, however, you might need to modify existing applications that parse the audit log.
4. Select to either log Only failed attempts of the selected operations or to log All attempts of the selected operations.
5. Enter the Path and file name for the audit log. The audit log can also be directed to something other than a file, for example, a line printer.
6. Select the operations you wish to log. Consult the field help for additional information about the various operations you can log.
– Bind - records connections to the server
– Unbind - records disconnections from the server
– Search - records LDAP search operations performed by any client
– Add - records additions to LDAP
– Modify - records modifications to LDAP
– Delete - records deletions from LDAP
– Modify RDN - records modifications made to RDNs
– Event notification - records event notifications
– Extended operations- records extended operations performed against the server
|
Note: If you have selected audit Version 1, selecting Extended operations does not activate this function. You must select audit version 2 for the auditing of extended operations to work.
|
7. Click OK to apply the changes or click Cancel to return to the IBM Tivoli Directory Server Web Administration Welcome panel without making any changes.
Figure 17-6 on page 570 shows the screenshot of the relevant panel, where you would be doing these changes.

Figure 17-6 Panel to enable/disable the audit log
Using the command line
The similar operations can be done via the command using our very own ldapmodify command. Here is how:
ldapmodify -D <adminDN> -w <adminPW> -i <filename>
Where <filename> contains:
dn: cn=audit, cn=localhost
changetype: modify
replace: ibm-audit
ibm-audit: true
-
replace: ibm-auditadd
ibm-auditadd: {TRUE|FALSE}
#select TRUE to enable, FALSE to disable
-
replace: ibm-auditbind
ibm-auditbind: {TRUE|FALSE}
#select TRUE to enable, FALSE to disable
-
replace: ibm-auditdelete
ibm-auditdelete: {TRUE|FALSE}
-
replace: ibm-auditextopevent
ibm-auditextopevent: {TRUE|FALSE}
#select TRUE to enable, FALSE to disable
-
replace: ibm-auditfailedoponly
ibm-auditfailedoponly: {TRUE|FALSE}
#select TRUE to enable, FALSE to disable
-
replace: ibm-auditlog
ibm-auditlog: <newpathname>
-
replace: ibm-auditmodify
ibm-auditmodify: {TRUE|FALSE}
#select TRUE to enable, FALSE to disable
-
replace: ibm-auditmodifydn
ibm-auditmodifydn: {TRUE|FALSE}
#select TRUE to enable, FALSE to disable
-
replace: ibm-auditsearch
ibm-auditsearch: {TRUE|FALSE}
#select TRUE to enable, FALSE to disable
-
replace: ibm-auditunbind
ibm-auditunbind: {TRUE|FALSE}
#select TRUE to enable, FALSE to disable
-
replace: ibm-auditversion
ibm-auditversion: {1|2}
#select 2, if you are enabling audit for extended operations
-
replace: ibm-auditExtOp
ibm-auditExtOp: {TRUE|FALSE}
#select TRUE to enable, FALSE to disable
|
Note: If you are using audit logging in Configuration only mode, the DN specified is dn: cn=audit, cn=configuration. Any changes made to this DN are overwritten with the dn: cn=audit, cn=localhost values when the server is started in normal mode.
|
Disabling the audit log
Again, we are going to see two ways to disable audit logging.
Using Web Administration
To use this:
1. Expand Logs in the navigation area, click Modify audit log settings.
2. Deselect Enable audit logging.
3. Click OK to apply the changes or click Cancel to return to the IBM Tivoli Directory Server Web Administration Welcome panel without making any changes.
Using the command line
The similar operations can be done via the command using our very own ldapmodify command. Here is how:
ldapmodify -D <adminDN> -w <adminPW> -i <filename>
Where <filename> contains:
dn: cn=audit, cn=localhost
changetype: modify
replace: ibm-audit
ibm-audit: false
You do not need to deselect the individual operations to disable auditing. Just running the above ldapmodify should suffice.
|
Note: If you are using audit logging in Configuration only mode, the DN specified is dn: cn=audit, cn=configuration. Any changes made to this DN are overwritten with the dn: cn=audit, cn=localhost values when the server is started in normal mode.
|
Viewing the audit log
The audit log displays, log entries, chronologically. Each non-message entry contains a general information header followed by operation-specific data. For example:
2000-03-23-16:01:01.345-06:00--V3 Bind--bindDN:cn=root --client:9.1.2.3:12345--
ConnectionID:12--received:2000-03-23-16:01:01.330-06:00 --success
name: cn=root
authenticationChoice: simple
If the audit version is version 2 the header contains __AuditV2--__. AuditV2--2003-07-22-09:39:54.421-06:00DST--V3 Bind--bindDN: cn=root--client: 127.0.0.1:8196--connectionID: 3--received: 2003-07-22-09:39:54.421-06:00DST--Success
The header is in the following format:
•Timestamp 1 __--__: The local time the entry is logged, that is, the time the request was processed. The timestamp is in the format YYYY-MM-DDHH: MM:SS.mmm=(or-)HH:MM. The =(or=)HH:MM is UTC offset. mmm is milliseconds.
•Version number+[SSL]+[unauthenticated or anonymous] Operation __--__: Shows the LDAP request that was received and processed. Version number is either V2 or V3. SSL displays only when SSL was used for the connection. unauthenticated or anonymous displays to indicate whether the request was from an unauthenticated or anonymous client. Neither unauthenticated nor anonymous are logged, in case the request is from an authenticated client.
•bindDN: Shows the bind DN. For V3 unauthenticated or anonymous requests, this field is <*CN=NULLDN*>.
•client:Client IP address:Port number __--__: Shows the client IP address and port number.
•ConnectionID: xxxx __--__: Is used to group all the entries received in the same connection, meaning between the bind and unbind, together.
•received: Timestamp 2 __--__: Is the local time when the request was received, or to be more specific, the beginning time when the request was processed. Its format is the same as Timestamp 1.
Result or Status string Shows the result or status of the LDAP operation. For the result string, the textual form of the LDAP resultCode is logged, for example, success or operationsError, instead of 0 or 1.
Operation-specific data follows the header and displays operation-specific data, for example,
Bind operations
name: Y249bWFuYWdlcg0K
authenticationChoice: simple
Add operations
entry: cn=Jim Brown, ou=sales,o=ibm_us,c=us
attributes: objectclass, cn, sn, telphonenumber
Delete operations
entry: cn=Jim Brown, ou=sales,o=ibm_us,c=us
Modify operations
object: cn=Jim Brown, ou=sales,o=ibm_us,c=us
add: mail
delete: telephonenumber
Now let us see how we can see the contents of the audit log.
Using Web Administration
To do this:
1. Expand Logs in the navigation area, click View audit log.
2. The panel displays the first page of the audit log.The navigation arrows at the bottom of the panel enable you to go to the Next page or to the Previous page. From the menu, you can select a specific page, for example Page 6 of 16, and click Go to display that page of the audit log. You can:
a. Click Refresh to update the entries in the log.
b. Click Clear log to delete all entries in the audit log.
c. Click Close to return to the IBM Tivoli Directory Server Web Administration Welcome panel.
Figure 17-7 shows the relevant screenshot of the panel you will see, when you view the audit log via the Web Administration tool.

Figure 17-7 Contents of the audit log
Using the command line
To view the audit log through the command line, issue the following command (for UNIX):
more /var/ldap/audit.log
Where /var/ldap/audit.log is the default path for the audit log.
|
Note: /var/ldap/audit.log is the default audit log for UNIX systems and ldapinstalldirvaraudit.log is the default audit log for Windows systems. The above command will not work if you have set a Custom path for the audit log.
|
To view and clear the audit log dynamically:
ldapexop -D <adminDN> -w <adminPW> -op readlog -log audit -lines all
ldapexop -D <adminDN> -w <adminPW> -op clearlog -log audit
The ldapexop tool can be used to fetch the whole or some required number of lines from the audit log file. The command for the same is as shown below:
ldapexop -D <adminDN> -w <adminPW> -op readlog -log audit -lines all
It returns the audit log as follows:
authenticationChoice: simple
AuditV2--2003-12-17-14:53:36.554-05:00--V3 Unbind--bindDN: cn=root--client: 127.0.0.1:19728--connectionID: 33--received: 2003-12-17-14:53:36.554-05:00--Success
controlType: 2.16.840.1.113730.3.4.2
criticality: false
AuditV2--2003-12-17-14:53:36.654-05:00--V3 Unbind--bindDN: cn=root--client: 127.0.0.1:18704--connectionID: 31--received: 2003-12-17-14:53:36.654-05:00--Success
controlType: 2.16.840.1.113730.3.4.2
criticality: false
AuditV2--2003-12-17-14:54:33.065-05:00--V3 Bind--bindDN: cn=root--client: 9.24.104.185:20240--connectionID: 34--received: 2003-12-17-14:54:33.065-05:00--Success
name: cn=root
authenticationChoice: simple
Here is what is expected, when we clear the log and then try to read its contents:
C:>ldapexop -D <adminDN> -w <adminPW> -op clearlog -log audit
audit log file cleared.
C:>ldapexop -D -D <adminDN> -w <adminPW> -op readlog -log audit -lines all
Feb 22 00:23:44 2004 Log file cleared.
AuditV2--2004-02-22-00:23:44.645+05:00--V3 extended operation--bindDN: cn=root--client: 127.0.0.1:3588--connectionID: 3--received: 2004-02-22-00:23:44.645+05:00--SuccessOID: 1.3.18.0.2.12.20
AuditV2--2004-02-22-00:23:44.655+05:00--V3 Unbind--bindDN: cn=root-- client: 127.0.0.1:3588--connectionID: 3--received: 2004-02-22-00:23:44.655+05:00--Success
AuditV2--2004-02-22-00:23:52.416+05:00--V3 Bind--bindDN: cn=root-- client: 127.0.0.1:3844--connectionID: 4--received: 2004-02-22-00:23:52.416+05:00--Success
name: cn=root
authenticationChoice: simple
AuditV2--2004-02-22-00:23:52.416+05:00--V3 extended operation--bindDN: cn=root--client: 127.0.0.1:3844--connectionID: 4--received: 2004-02-22-00:23:52.416+05:00--Success
ibmslapd Error log
The errors pertaining to the server operations are logged in what is known as the ibmslapd error log. This file can also be handy in some cases. For example, if you try to add entries with some object class violations, they can very easily be noticed by means of this error log. You can note error messages like this in the slapd error log:
Feb 15 04:26:31 2004 The required attribute sn is missing for entry cn=user1,o=ibm,c=us.
Feb 15 04:26:31 2004 Entry cn=user1,o=ibm,c=us violates the schema definition.
There are other errors too like the Master unable to contact the Replica for a given reason. These also appear in the ibmslapd error log. So if there is any problem pertaining to the server that you need to look at, feel free to go through the ibmslapd error log and there might be a hint of the problem out there.
|
Note: The error log, ibmslapd.log, is enabled by default.
|
To modify error log settings, there are again two ways to do it. First, We will see the necessary changes through the Web Administration Tool:
1. Expand Server administration in the navigation area, click Logs, click Modify error log settings.
2. Enter the path and file name for the error log. Ensure that the path is valid. If the file does not exist, it is created. The error log can also be directed to something other than a file, for example, a line printer.
3. Select either Low, Medium, or High for the level of error logging.
|
Note: If you specify a file that is not an acceptable file name (for example, invalid syntax or if the server does not have the rights to create and/or modify the file), the attempt fails with the following error: LDAP Server is unwilling to perform the operation.
|
a. Low logs the least amount of error information, for example:
Mar 29 11:03:23 2002 IBM Directory, Version 5.2
slapd started.
b. Medium logs a medium amount of error information, for example:
Mar 29 11:07:51 2002 Configuration read securePort 636.
Mar 29 11:07:51 2002 Plugin of type PREOPERATION is successfully loaded from libDSP.dll.
Mar 29 11:07:51 2002 Plugin of type DATABASE is successfully loaded from C:Program FilesIBMLDAP/bin/libback-rdbm.dll.
Mar 29 11:08:11 2002 Non-SSL port initialized to 389.
Mar 29 11:08:12 2002 IBM Directory, Version 5.2
slapd started.
c. High logs the most amount of error information, for example:
Mar 29 11:04:05 2002 Configuration read securePort 636.
Mar 29 11:04:05 2002 Configuration read cipher specifications mask to be 12288.
Mar 29 11:04:05 2002 Plugin of type PREOPERATION is successfully loaded from libDSP.dll.
Mar 29 11:04:05 2002 Plugin of type DATABASE is successfully loaded from C:Program FilesIBMLDAP/bin/libback-rdbm.dll
Mar 29 11:04:24 2002 Configuration file successfully read.
Mar 29 11:04:24 2002 Non-SSL port initialized to 389.
Mar 29 11:04:25 2002 IBM Directory, Version 5.2
slapd started.
4. Click OK to apply the changes or click Cancel to return to the IBM Tivoli Directory Server Web Administration Welcome panel without making any changes.
5. Click OK to return to the IBM Tivoli Directory Server Web Administration Welcome panel.
Figure 17-8 shows the relevant screenshot.

Figure 17-8 ibmslapd error log settings
Using the command line
Issue the command:
ldapmodify -D <adminDN <-w >adminPW> -i <filename>
where <filename> contains:
dn: cn=Configuration
changetype: modify
replace: ibm-slapdErrorLog
ibm-slapdErrorLog: <newpathname>
-
replace: ibm-slapdSysLogLevel
ibm-slapdSysLogLevel: {l | m | h}
To update the settings dynamically, issue the following ldapexop command:
ldapexop -D <adminDN> -w <adminPW> -op readconfig -scope entire
The ldapexop command updates only those attributes that are dynamic. For more information on which attributes can be updated dynamically and which not, you can go through Chapter 10, “Client tools” on page 237.
Viewing the error log
Use the following procedures to view the error log.
Using Web Administration
To use this:
1. Expand Logs in the navigation area, then click View error log.
2. The panel displays the first page of the error log and the navigation arrows at the bottom of the panel enable you to go to the Next page or to the Previous page. From the menu, you can select a specific page, for example Page 6 of 16, and click Go to display that page of the error log. You can:
a. Click Refresh to update the entries in the log.
b. Click Clear log to delete all entries in the administration daemon error log.
c. Click Close to return to the IBM Tivoli Directory Server Web Administration Welcome panel.
Figure 17-9 shows the relevant screenshot, which shows a portion of the messages logged.
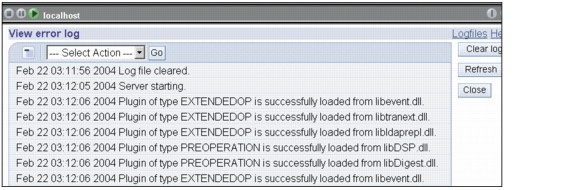
Figure 17-9 Contents of the ibmslapd error log file
Using the command line
To view the error log, issue the following command (on UNIX):
more /var/ldap/ibmslapd.log
Where /var/ldap/ibmslapd.log is the default path for the ibmslapd error log.
|
Note: /var/ldap/ibmslapd.log is the default error log for UNIX systems and ldapinstalldirvaribmslapd.log is the default error log for Windows systems.
|
To view and clear the error log dynamically:
ldapexop -D <adminDN> -w <adminPW> -op readlog -log slapd -lines all
ldapexop -D <adminDN> -w <adminPW> -op clearlog -log slapd
DB2 error log
In addition to the ibmslapd.log file, which can be accessed through the Web Administration Tool, DB2 errors are logged in the db2cli.log file. Both files are located in the var subdirectory of the IBM Tivoli Directory Server installation directory on Windows platforms. There exist a lot of parameters at the DB2 level, which will enhance our directory server’s performance. In case any of the parameter is set below/above the acceptable limits, the relevant message will be logged into the db2cli.log.
|
Note: The var subdirectory might include other DB2 files.
|
Server errors, by default, are logged in the varibmslapd.log file.
DB2 errors are, by default, logged in the vardb2cli.log file.
Modifying DB2 error log settings
As expected, there are two ways of modifying the settings of the DB2 Error log:
1. Expand Logs in the navigation area, click Modify DB2 log settings.
2. Enter the path and file name for the error log. Typically this is the db2cli.log file located in the /var/ldap directory. Ensure that the path is valid. If the file does not exist, it is created.
|
Note: /var/ldap/db2cli.log is the default DB2 error log for UNIX systems and ldapinstalldirvardb2cli.log is the default DB2 error log for Windows systems.
|
3. Click OK to apply the changes or click Cancel to return to the IBM Tivoli Directory Server Web Administration Welcome panel without making any changes.
4. Click OK to return to the IBM Tivoli Directory Server Web Administration Welcome panel.
Figure 17-10 shows the relevant screenshot.

Figure 17-10 DB2 log settings
Using the command line
Issue the command:
ldapmodify -D <adminDN> -w <adminPW> -i <filename>
where <filename> contains:
dn: cn=Directory, cn=RDBM Backends, cn=IBM Directory, cn=Schemas, cn=Configuration
changetype: modify
replace: ibm-slapdCLIErrors
ibm-slapdCLIErrors: <newpathname>
To update the settings dynamically, issue the following ldapexop command:
ldapexop -D <adminDN> -w <adminPW> -op readconfig -scope single "cn=Directory,cn=RDBM Backends,cn=IBM Directory,cn=Schemas,cn=Configuration" ibm-slapdCLIErrors
The ldapexop command updates only those attributes that are dynamic. For other changes to take effect you must restart the server. See Chapter 10, “Client tools” on page 237, to see which attributes can be updated dynamically.
Viewing the DB2 error log
Use the following procedures to view the DB2 error log.
Using Web Administration
To do this:
1. Expand Logs in the navigation area, then click View DB2 log.
2. The panel displays the first page of the DB2 log and the navigation arrows at the bottom of the panel enable you to go to the Next page or to the Previous page. From the menu, you can select a specific page, for example Page 6 of 16, and click Go to display that page of the DB2 log. You can:
a. Click Refresh to update the entries in the log.
b. Click Clear log to delete all entries in the DB2 error log.
c. Click Close to return to the IBM Tivoli Directory Server Web Administration Welcome panel.
Figure 17-11 shows the relevant screen shot.

Figure 17-11 DB2 log contents
Using the command line
To view the DB2 error log issue the following command (on UNIX):
more /var/ldap/db2cli.log
Where var/ldap/db2cli.log is the default path for the DB2 error log.
|
Note: /var/ldap/db2cli.log is the default DB2 error log for UNIX systems and ldapinstalldirvardb2cli.log is the default DB2 error log for Windows systems.
|
To view and clear the DB2 error log dynamically:
ldapexop -D <adminDN> -w <adminPW> -op readlog -log cli -lines all
ldapexop -D <adminDN> -w <adminPW> -op clearlog -log cli
Here is an example of example of the above commands:
C:>ldapexop -D <adminDN> -w <adminPW> -op readlog -log cli -lines all
02/03/2004 10:24:57 PM native retcode = -601; state = "42710"; message = "[IBM][CLI Driver][DB2/NT] SQL0601N The name of the object to be created is identical to the existing name "LDAPBP" of type "BUFFERPOOL". SQLSTATE=42710 "
C:>ldapexop -D <adminDN> -w <adminPW> -op clearlog -log cli
cli log file cleared.
C:>ldapexop -D <adminDN> -w <adminPW> -op readlog -log cli -lines all
Feb 22 03:49:07 2004 Log file cleared.
|
Note: In case it is necessary to dig into DB2 errors further, you can go through a file known as db2diag.log. On UNIX, the default path of db2diag.log is: “<directory where you configured you’re ldap database>/sqllib/sqldump/db2diag.log”. On Windows, the default path is “<DB2 Installation path><You’re DB2 instance name>db2diag.log”. For example, “D:Program filesIBMSQLLIBLDAPDB2db2diag.log”. You can change the default path using DB2 utilities. Refer to Chapter 20, “Developing JNDI-based applications” on page 619, for further information on db2diag.log.
|
17.3 Operating system commands for monitoring ITDS
Sometimes it is required to track the resources consumed by the directory server while running for long durations. Listed below are some OS-specific commands to achieve the above goal.
AIX
To view information about the running process ibmslapd, issue the following command:
ps auwx | grep -i ibmslapd
Linux
Command line tool to view information about the running process ibmslapd:
ps aux | grep -i ibmslapd
Graphical tool to view information about the running processes:
pstree (check the man pages for more details)
Solaris
Command line tool to view information about the running process ibmslapd:
ps -yel | grep -i ibmslapd
Graphical tool to view information about the running processes:
/usr/dt/bin/sdtprocess
You can specify the refresh rate at which the screen will be refreshed to show the updated statistics.
Windows
Command line utility to view information about running processes: Download the pview utility from the Microsoft Web site.
Graphical tool: The Processes tab in the Windows Task Manager can be used for monitoring the resource usage.
HP-UX
Command line utility to view information about the running ibmslapd process:
ps -eaf | grep -i ibmslapd
All the above commands, shown for different operating systems, help us to get to know two things.
•Firstly, if ibmslapd is still running.
•Secondly, how much has the process size grown till date and if it is within permissible limits or going to click the limits soon.
If there is growth in process size, it is not necessarily a memory leak. For example, if you have set your caches too large then as the number of misses on the directory server cache increases the data cached increases, which in turn increases the ibmslapd process size. The ulimits of the system (UNIX) play a very significant role here, in order to regulate the systems’ resource utilization. You can see the current ulimit settings using the command:
ulimit -a
Here is a sample output of the ulimits of a system:
bash-2.05a# ulimit -a
core file size (blocks, -c) 1048575
data seg size (kbytes, -d) 131072
file size (blocks, -f) 1048575
max memory size (kbytes, -m) 32768
open files (-n) 2000
pipe size (512 bytes, -p) 64
stack size (kbytes, -s) 32768
cpu time (seconds, -t) unlimited
max user processes (-u) 262144
virtual memory (kbytes, -v) unlimited
As seen above the (u)pper limit for the process memory size is 32 MB.
If you have set the process memory size to unlimited then ibmslapd would keep growing, till either the clients are happy with the entries in the cache or the entire directory has been cached. If neither case satisfies, ibmslapd would keep growing, ultimately bringing down the entire system to a hang condition. The only alternative to do in this situation would be to reboot the system physically. In order to avoid such issues, please ensure:
•You have set you’re systems’ ulimits appropriately.
•You have the LDAP caches set appropriately.
•You have DB2 bufferpools set appropriately.
By appropriately, we mean as per the availability of resources, so that if the ibmslapd size grows beyond this extent, the OS will just pull out ibmslapd out of the process table, that is, it’ll kill ibmslapd on its own.
Such things are most commonly observed while tuning the directory server to get to know the answers to a set of performance queries. Queries like “What exact figures of the caches will suit my environment?”, “What are the database bufferpools we are supposed to set my systems to?”, “What are the attributes that we want to cache”, “What should be the size of my attribute cache?” etc. These are the types of tests where we need to have an eye on the size of the ibmslapd process.
If anything unusual happens, either you have overshot one of you’re parameters or there might be a genuine memory leak, which needs to be brought forth the ITDS Support team.
Here is an example of the ps auwx command on AIX:
bash-2.05a# ps auwx | head -1
USER PID %CPU %MEM SZ RSS TTY STAT STIME TIME COMMAND
bash-2.05a# ps auwx | grep ibmslapd | grep -v grep
ldap 340136 0.2 1.0 13332 13444 - A Feb 20 30:14 ibmslapd
As seen above the current size of ibmslapd seems to be: 13 MB, which is very well within limits. Make sure the size of ibmslapd does not show anomalous growth in you’re environment.
Well, we have seen a lot of things in this chapter, which help in monitoring our directory server. Prior to summarizing things, let us go over a couple more notes which are worth having a look.
|
Note: See the following:
•In the Web Administration Tool the Logfiles field in the task title bar accesses the Web Administration console log files. The IBM Tivoli Directory Server log files are accessible by using the procedures specified in the sections, we have just discussed.
•On Windows-based systems, if a path begins with the drive letter and a colon, it is assumed to be the full path. A path without the drive letter, starts in the installation tree. As examples: c: mpmylog is a full path, while mpmylog is interpreted as c:program filesibmldap mpmylog.
•The simplest way to get to a problem is to know the time when it has occurred. The log files are timestamped. So you just compare the different log files simultaneously for the activities at a given instant of time and there you are, very close to the problem cause. If multiple LDAP servers are involved (for example, debugging a replication issue), keeping them time synchronized is handy (Only of course if time synchronization if feasible).
|
17.4 Summary
In summary:
•To start with the chapter, we looked into the reasons for monitoring our directory server.
•Then we looked into the different monitoring tools:
– Client tools to monitor the directory server, whereby we saw that the search to “cn=monitor” provides a lot of insight into the directory performance.
– Log files helped us in knowing if there were any configuration issues that need to be overcome for the smooth functioning of the database.
– A separate database which helped us in knowing what all changes took place with the directory server at different instants of time.
•Then we saw how the OS utilities help in tracking the anomalies associated with the directory server growth.
..................Content has been hidden....................
You can't read the all page of ebook, please click here login for view all page.