Chapter 11. Understanding Performance
There is an old adage in which there are two steps you need to follow to optimize your performance. Step one is “Don’t do it.” Step two, which for experts is “’Don’t do it yet.” This is good advice, so let’s make a goal in this chapter to get you on your way to step two. In this chapter, you’ learn:
• General performance guidelines
• Graphics performance
• Measuring performance
One of the biggest concerns people seem to have (even to this day) is that managed code cannot perform well enough. This was somewhat understandable years ago when managed code was new and everyone wasn’t sure how to write code for it, but the managed runtime has been out for years now. The fourth version came out with Visual Studio 2010, and it’s been more or less proven that you can write high-performing managed applications.
General Performance
Some people mistake that saying at the beginning of the chapter to mean that you shouldn’t worry about performance, which is just not accurate. The intent is to warn people about the potential problems that can arise from attempting to prematurely optimize your code. Optimizing code that is already “fast enough” just makes the code harder to read and maintain, or worse yet, it can introduce new bugs and regressions into the code. Performance is important, but just like anything else, you shouldn’t try to fix it, unless you know what you’re off to fix and why.
One of the important aspects of getting great performance out of your applications (and games) is an understanding of what various portions of your code cost. For example, do you know what the following code snippet might cost?
MediaPlayer.Play(Song.FromUri("mysong.wma", new Uri("http://www.someplace.com")));
If you guessed quite a lot, you’d be correct! Although it is a single line of code, there are a whole lot of things going on here. There are two orphaned objects (the Uri and the Song) that will eventually be collected by the garbage collector. There is FromUri method that (with the code used here) attempts to connect to the Internet to try to download music. What if you were on a phone with no connectivity? What if your latency was so high, it took 5 seconds to even start the download? Does the method download the entire file before attempting to play or does it try to stream? Does the method return instantly or block until sometime in the future when it has a valid song object? You should have a basic idea of the performance (or cost) of a method before calling it.
Cost can mean a number of different things. Perhaps a method allocates an extraordinary amount of memory; this would certainly add to its cost, potentially in a variety of ways. For example, it can cause the garbage collector to collect more frequently or it can push data out of the cache. A method can simply be computationally expensive, because it’s a complex physics engine handling millions of objects. You can have a method that is fast in most cases, but sometimes it needs to wait for data and blocks execution until it has it.
One easy-to-hit performance problem in early versions of the managed runtimes was what is called boxing. In .NET, anything can be used as an object, which is a reference type. Before we move on to boxing, what exactly is a reference type?
At the most basic level, a reference type is a type that you do not access the value of directly, but through a reference (hence, the name). This means that the object is allocated on the heap, and the garbage collector collects it later when it no longer has any references. Because reference types are referred to by reference, assigning two variables to the same reference means each variable has the same data. For example, imagine a class with a method SetInteger that sets an integer and GetInteger that returns the value of that integer, which is shown in this code snippet:
MyClass firstRef = new MyClass();
MyClass secondRef = firstRef;
secondRef.SetInteger(5);
firstRef.SetInteger(3);
int x = secondRef.GetInteger();
This produces a value of 3 for the variable x. This is because each variable refers to the same reference, so modifying one naturally modifies the other. If a type isn’t a reference type, then it is considered a value type. Most integer primitives (and structs) are value types, and they are quite different than reference types because assigning one value type to another does a full copy rather than make the variables share the same reference. For example, in the previous example, if you were using integers directly (which are value types) rather than reference types, you would get a different result:
int firstInt = 5;
int secondInt = firstInt;
secondInt = 3;
firstInt = 7;
int x = secondInt;
int y = firstInt;
At the end of this snippet x is 3, and y is 7. Unlike reference types, changing one doesn’t change the other. A common misconception of value types is that they are always on the stack. If they are declared as a local variable, then this is normally true, but they are not always on the stack. For example, an array of value types is a reference type, and each individual value type is on the heap. Similarly, if a value type is a member of a class, it is stored on the heap, too.
Value types that are local variables can sometimes be performance wins, though, as they are allocated on the stack, and hence, they are not going to be garbage collected later. However, they can also be a performance hit if you don’t know what you’re doing with them. For example, if you have a large value type (such as the Matrix structure), and you declare six of them as local variables so they are on the stack, but then pass all six into a method, this may be a performance hit even though they are on the stack! Because assigning a value type creates a deep copy, you allocate 12 of the structures in total (six for your original local variables and six for the method parameters), plus (and more importantly) you copy all the data for each of those structures into the parameters (the Matrix structure is 64 bytes, so that is copying 384 bytes just to call that method). Again, this is more affirmation that you should have a rough idea of the cost of your methods.
So, now we come back to boxing. Although this class of performance behavior is much less prominent than before, it can still be hit. The act of boxing is essentially taking a value type on the stack, and using it as an object type (which is a reference type). Doing this allocates a new reference type and stores the data of the value type inside it. The potential pitfall here is that all of those new objects need to be collected, and this causes the garbage collector to kick in sooner. With the advent of generics, the majority of common cases where people accidently box something are gone, but not all of them.
Who Takes Out the Garbage?
By far, the most common cause of unexpected performance problems is related to the garbage collector. For the most part, modern day garbage collectors are good at what they do, so before we get into potential performance issues, let’s first take a look at what a garbage collector actually does.
In the .NET runtime, objects are created on the managed heap, which is in essence a large block of memory. The runtime keeps track of this memory and remembers where the start of the memory block is. When you allocate new objects, it is almost free because all the runtime needs to do is move its pointer at the top of the heap down, as seen in Figure 11.1.
Figure 11.1. Basic memory allocation in the managed runtime
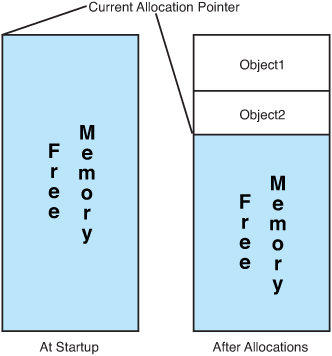
As you allocate more and more objects, some go out of scope, some stay in scope, and that allocation pointer just keeps moving down the block of memory. Eventually, the system decides to check to see if you are still using all the memory you allocated. It does that by starting at the beginning of the memory block and examining all of the objects that have been created. If it finds an object that is orphaned, it marks that object, and then it continues on.
Note
All of the points made here about the garbage collector are at a high level. Many resources are available to learn more about the garbage collector if you want more in depth detail.
An object is orphaned when it has no outstanding references to it anywhere in the application. For example, in this code snippet, the object o is orphaned as soon as the method returns and is available to be collected:
public void SomeMethod()
{
object o = new object();
}
However, in this snippet, the object o is not orphaned when the method ends because the class itself still holds a reference to it:
public class SomeClass
{
object o;
public void SomeMethod()
{
o = new object();
}
}
If the class becomes orphaned, then the object contained in it does, too (provided it doesn’t have other outstanding references).
After the garbage collector has gone through the entire memory block finding orphaned objects, it goes and compacts the memory block. This means it goes through that memory block and moves things around until it has a single, big contiguous memory block again, destroying objects that have no references.
The Windows desktop runtime is actually even a little smarter than that. It has what is called a generational garbage collector. When an object is first created, it assumes it will be short lived, and it will be created in what is called generation zero, for the short lived objects. When a certain threshold is hit, the runtime decides to do a collection, and it looks only through the generation zero objects, marks the ones that are orphaned, and then collects them. However, anything that is in generation zero that is not orphaned gets promoted to the next generation (generation one). If another threshold is met, a generation one collection occurs, and things not orphaned get promoted to generation two, which is the end of the line for the objects. A generation two collection is the one that walks the entire memory block.
As you can imagine, examining every object you create, and then compacting the memory after a collection is time-consuming, particularly if you have a large number of objects. Because the generation two collection is the one that looks at all objects, it is the worst performing collection of the group.
However, the compact framework runtime that runs on the Xbox and Windows Phone 7 does not have a generational garbage collector. Every collection on those platforms looks at every object. If the garbage collector runs all the time, your game sees noticeable slowdowns.
Note
The garbage collector has a set of heuristics that determine when it should start a collection, but they are not configurable, and you cannot predict when it will happen.
I’m sure the question then is, “Well, how do I avoid that?” The answer is easy; don’t create garbage! Now, obviously you can’t run your entire game without creating objects. You just need to make sure that you don’t create objects all the time during performance-critical sections of your game (such as during game play). For example, if you create a new state object every frame to set the device state, you will have collections during game play.
Normally though, it’s the unexpected allocations that cause the collections, more proof that you want to have an idea of what methods cost. As an example, did you know that using foreach on a collection can potentially create garbage? This is what foreach breaks down into:
IEnumerator e = collection.GetEnumerator();
while (e.MoveNext())
{
var obj = e.Current;
// Your code
}
That first line creates an object. If that object is not a value type, that object is created on the heap and produces garbage. Most collection types in the runtimes do not create garbage during a foreach loop, but the fact that it can is often a surprise to people.
Later in this chapter we discuss how to measure your garbage.
Multithreading
Another area where you can see an improvement in performance (particularly on Xbox) is in multithreading. Now, this doesn’t mean you should add multithreading everywhere because poor use of multithreading can actually make performance worse.
If you have portions of your code that are computationally expensive and don’t require them to be done at a certain point in time (for example, you aren’t waiting on the results), using another thread can be a big win for you. Creating a thread and starting one can take a bit of time, though, so if think you need multiple threads, you should create them all at startup to not have to pay that cost at runtime.
Another thing to keep in mind when using multiple threads on Xbox is what core they run on. The Xbox has three physical cores each with two hardware threads, which means it can run six threads simultaneously. However, unlike on Windows, you must explicitly tell it which thread you want to run on. You do this with the SetProcessorAffinity method as you see in the following snippet:
Thread worker = new Thread(new ThreadStart(() =>
{
Thread.CurrentThread.SetProcessorAffinity(4);
DoComplexCalculations();
}));
worker.Start();
Note
You need to set the processor affinity as the first line in your thread method; you cannot set it before the thread has started nor can you call it on any thread other than the one on which it executes.
Although the Xbox has a total of six hardware threads you can use, two of them are reserved by the XNA runtime (thread zero and thread two). You should use the other four hardware threads to spread your calculations across each of the hardware threads.
One thing you want to avoid in a multithreaded game is waiting on one of your worker threads to continue the game. If your game is paused to wait for another thread, you potentially don’t gain any performance.
Let’s imagine a scenario that has characteristics such as this. Your Update method tells a worker thread to perform a task that takes 1ms, while the rest of the code in the Update method also takes 1ms to complete. However, it needs the rest of the data from the worker thread, so it needs to wait for that thread to finish, which after the overhead, the thread can take more than the 1ms you attempted to save, and you would take less time by doing all the work in your Update method.
Conversely, imagine your Update method takes 7ms to complete, and the worker thread takes 8ms to complete. Sure, your Update method would end up waiting a millisecond or two waiting on the data, but that’s much faster than the 15ms it would have had to wait if it was all done in the Update call.
Entire books are written about writing well-behaving multithreaded code, and this small section doesn’t even begin to touch the surface of the things you need to watch out for (for example, the lock keyword in C#). Hopefully, this gives you some ideas about how multiple threads can help your performance without giving you the false sense that is the panacea to make your performance troubles go away.
Graphics Performance
For some reason, when people discuss performance in games, a lot of times, they talk about graphics performance specifically. It’s rare they speak of physics performance or audio performance—it’s almost always graphics. This is probably because many people don’t understand graphics performance or what it means.
One of the biggest conceptual problems people have when attempting to understand graphics performance is that it doesn’t behave similarly to other parts of the system. In a normal application, you tell the computer what you want it to do, and it generally does exactly what you ask it to do in the order you ask it to do it.
Modern graphics hardware doesn’t behave anything like that. It has a bunch of stuff to do and it says, “Hey, I’m just going to do it all at once.” Top of the line graphics cards today can process thousands of operations simultaneously.
On top of that, people can get confused because they measure performance and see that their Draw calls are fast, but then there is a slowdown in the Present method that they didn’t even call! This is because anytime a graphics operation is called, the computer doesn’t actually tell the graphics hardware until later (normally, the Present operation); it just remembers what you asked it to do, and then it batches it up and sends it all to the graphics hardware at once.
Because the graphics hardware and the computer run at the same time, you might have realized that this means the graphics hardware will render your scene while your next frame’s Update is executed, as you see in Figure 11.2. This is the basis of knowledge you need to understand to make good decisions about graphics performance.
Figure 11.2. The perfect balance of CPU and GPU

In a perfect world, this is how all games would run. As soon as the graphics hardware is done drawing the scene, the CPU gives it the next set of instructions to render. Neither piece of hardware waits, on the other, and they run perfectly in sync. This rarely happens, though; normally one waits for the other.
Let’s look at hypothetical numbers for a game. The work the CPU does takes 16ms, and the graphics hardware renders the scene in 3ms. So now, when the CPU has told the graphics hardware to start rendering and restarts its loop, the graphics hardware is done rendering and waits for its next set of instructions while the CPU still has 13ms of work left to do before it gives the graphics hardware anything new to do.
This is called being CPU bound, and it is important to know the distinction between it and “GPU bound (which is discussed later in this chapter). If your game is CPU bound and you spend a bunch of time optimizing your graphics performance, you won’t see a single bit of improvement, because the graphics hardware is already sitting around idle! In reality, you can actually add more graphics features here for free (if they were completely on the GPU), or you move some of your code from the CPU to the GPU.
Conversely, if these numbers are swapped and your CPU takes 3ms to do its work while the graphics hardware takes 16ms to render the scene, you run into the situation where the CPU is ready to give the next set of instructions to the graphics hardware only for the graphics hardware to complain, “I’m not done with the last section yet, hold on a second.” Now, the CPU sits around waiting for the GPU, and this is called being GPU bound. In this scenario, optimizing your CPU code to run faster has no impact on performance because the CPU is already sitting around waiting as it is.
Knowing if your game is CPU bound or GPU bound can go a long way in determining how to address performance issues. The obvious question here is, “How do I detect which one I am?” Unfortunately, it’s not as easy an answer as you migth think.
Sometimes you might notice that the Present call takes an awfully long time, causing your game to slow down. Then you think, “If Present takes so long, that must mean the graphics hardware is still busy, so I must be GPU bound!” This might be the case, but it can also be the case that you simply misinterpreted what happened in Present!
By default, an XNA game runs in fixed time step mode and runs with SynchronizeVerticalRetrace set to true. When this property is true, it tells the graphics hardware that it should render to the screen only when the monitor refreshes. A typical monitor has a refresh rate of 60hz, so if the monitor has that refresh rate, it refreshes 60 times per second (or every 16.6667ms). If rendering code takes 2ms to complete, the driver can still wait another 14.66667ms for the monitor refresh before completing the draw. However, if that property is set to false, the graphics hardware attempts to draw as fast as it can.
Note
Naturally, if your monitor runs at a different refresh rate from 60Hz, then the previous numbers would be different.
Of course, if you turn this off, you run into the opposite problem. Now, your graphics hardware runs as fast as it can, but because the system runs on a fixed time step (which is set to run at the default target speed for the platform: 60 frames per second on Xbox and Windows and 30 on Windows Phone 7), if you measured, you would appear to be CPU bound. This is because the game sits around and does not continue the loop until your next scheduled Update call!
So, to get a true measure of your performance, you need to run with SynchronizeVerticalRetrace and IsFixedTimeStep set to false. We recommend you create a new configuration called Profile to do your performance measurements and testing.
Note
Sometimes, any graphics call can cause a huge spike. This happens when the internal buffer being used to store graphics commands gets full. At this time, they’re all sent to the hardware for processing. If you see this happen, you probably should think about doing fewer operations per frame by batching them up.
With these two items taken care of, let’s take a look at measuring performance in your game.
Measuring Performance
One of the team members of the XNA Framework developed a helper library that he uses in all of his examples to help him easily measure performance of particular things. He was kind enough to give his permission to include this library in this book, which you can find with the downloadable examples for the book.
It wouldn’t be possible to show an example game that had every possible performance penalty in it, but let’s create a new project to see this library and get a few measurements. After you’ve created the project, right-click the solution, and choose Add->Existing Project, and then select the TimeRulerLibrary from the downloadable examples.
There’s one thing you need to do before using this library. Because the library renders text, it needs to load a sprite font. It also expects to find the sprite font in a particular place, so right-click your Content project and choose Add->New Folder. Name it Debug. Then, right-click the newly created folder and choose Add->New Item, selecting a sprite font and naming it DebugFont. You need to change a few of the default options that sprite fonts have. Replace the FontName, Size, and CharacterRegions nodes with the following:
<FontName>Consolas</FontName>
<Size>10</Size>
<CharacterRegions>
<CharacterRegion>
<Start> </Start>
<End>~</End>
</CharacterRegion>
<CharacterRegion>
<Start>▂</Start>
<End>▂</End>
</CharacterRegion>
</CharacterRegions>
With that, you’re ready to use this helper library. The basic goal of the library is to give you detailed information about actions that occur in your game. It renders a frame counter, and you can also tell it to render little bars that measure how long things take. To make it easy to use the library, let’s create a couple of helper objects. Add a new code file to your game project called PerfHelper.cs. Add a few objects to make it easier to use the library.
First, add a static class that will be the bulk of your interaction with the helper library:
public static class PerformanceHelper
{
private static TimeRuler _currentRuler;
private static DebugManager _debugManager;
private static DebugCommandUI _debugCommandUI;
private static FpsCounter _fpsCounter;
private static bool _firstFrame = true;
}
The variables here are the common objects you will use in the library. The TimeRuler object is the one you will get the most use out of, as it is the one that renders the bars (or rulers) you’ll use to measure the time it takes to run sections of code (hence, TimeRuler). The next few objects are used to help hold internal state; and the last is the component that displays your FPS counter so you can see how fast your game runs at a high level. Lastly, there are a couple things to do on the first frame, so you can store that, too.
Each of these objects is a component you can add to your game and forget about. You’ll want to add this method to help do so easily:
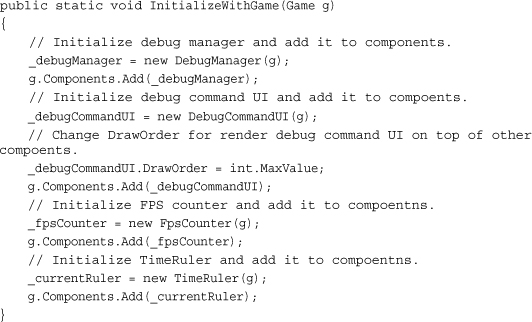
All this does is initialize each of your objects and add them to the game’s component collection. You should include a call to this in your main Game object’s Initialize method, so go back to your game1.cs file and add that now:
PerformanceHelper.InitializeWithGame(this);
Did you remember what else you should do here from earlier? If you want a good measure of your performance, you need to make sure you aren’t artificially CPU or GPU bound, so add the following to your Game constructor:
graphics.SynchronizeWithVerticalRetrace = false;
this.IsFixedTimeStep = false;
Now your game is ready to run as fast it can! Go back to your PerfHelper.cs code file and add the following helper method:
public static void StartFrame()
{
if (_firstFrame)
{
_firstFrame = false;
_debugCommandUI.ExecuteCommand("tr on log:on");
_debugCommandUI.ExecuteCommand("fps on");
}
_currentRuler.StartFrame();
}
On the first frame, execute a couple of commands: the first one to tell the system to turn on the time ruler with logging (tr stands for the time ruler) and the second one to tell the system to turn on the FPS counter. After that, you call the StartFrame method on your time ruler to signify the start of a new frame.
Note
You can actually expand the debug command UI with your own commands if you like, but that is beyond the scope of this chapter.
You also need access to the time ruler class externally, so add the following property accessor:
public static TimeRuler TimeRuler
{
get
{
return _currentRuler;
}
}
You need one more helper object to more easily use the time ruler, but before you add that to your code, let’s take a quick moment to discuss what the time ruler actually does. At the most basic level, it draws colorful bars on screen that give you a rough idea of how long actions take. You can call the BeginMark method, passing in an index (a zero-based index to the colorful bar you want to draw on), a string that is any arbitrary name you want to use to describe the section of code you’re about to run, and a color, which is the color this section is drawn in. You then have some of your own code execute, and you complete the cycle by calling EndMark, passing in the same index and name. Then, when the scene is finally rendered, you see colorful bars representing how long that code you wrote took to execute. For example, if you used code similar to this, you would see a single bar drawn at the bottom with the first portion colored yellow and the second portion colored blue:
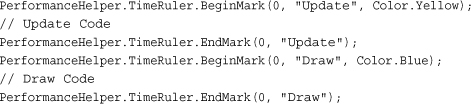
The length of each bar represents how long the actions between the begin and end mark calls take along with the average time each action takes, much like you see in Figure 11.3.
Figure 11.3. Rendering the time ruler with a single bar

However, if you use a different number for the index in the draw marker, say 1 instead of 0, you would see two different bars that show the same information, much like you see in Figure 11.4.
Figure 11.4. Rendering the time ruler with two bars

Notice how the second bar for the draw marker doesn’t even start until the end of the first marker.
Having to remember to use the BeginMark and EndMark calls everywhere, though, can be painful. What would be great is if you could create a simple helper object to encapsulate this code. If you remember the using statement from C#, that enables you to encapsulate code and it looks like a great opportunity to use here. All you need is an object that implements IDisposable, so add the following structure to your perfhelper.cs code file:
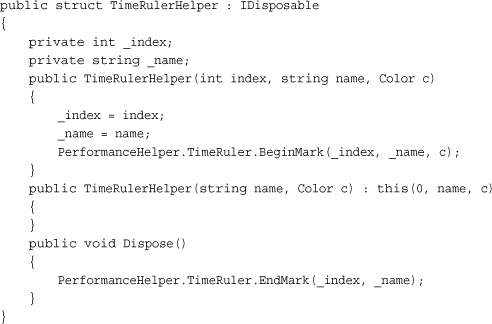
Notice how you have this structure implemen IDisposable? During the construction of the object, BeginMark is called and during the Dispose method (for example, the end of the using block), the EndMark is called. This enables you to easily encapsulate the code you want to measure. You don’t actually need both constructors, but the extra one is there in case you use only a single bar.
Note
Notice that this is a struct and not a class? You want this object to be a value type, so it is created on the stack and does not generate garbage, which ends up hurting the performance you’re trying to measure!
With that, you’re now completely set up to start measuring performance in your game. To test out the time ruler code, let’s go back to the Game and add the following to your Update method:
PerformanceHelper.StartFrame();
using (new TimeRulerHelper("Update", Color.Yellow))
{
System.Threading.Thread.Sleep(5);
}
Of course, you aren’t doing anything yet, but that Sleep call gives the illusion that you are. Next, add one for your Draw method:
using (new TimeRulerHelper("Draw", Color.Blue))
{
System.Threading.Thread.Sleep(10);
}
Running the application now shows you the time ruler bar and the frame counter at the top, much like you see in Figure 11.5.
Figure 11.5. Your first experience with the time ruler

Let’s take a few minutes to expand on this example to make it do something that is actually measurable. First, you need to add two models to your content project from the downloadable examples: depthmodel.fbx and environmentmapmodel.fbx. Now include this new class file in your project:
class ModelInformation
{
public Model Model;
public Vector3 Position;
public Vector3 YawPitchRoll;
public Vector3 YawPitchRollChange;
public Vector3 Velocity;
}
This is basic information you want to store about your models, because you draw a lot of them, and you might as well have them move around so you have something interesting to look at. You also want to add a few local variables to your Game class:
const float BoxRange = 200.0f;
private List<ModelInformation> _modelList;
Matrix view;
Matrix proj;
Random r = new Random();
int bounceCheck = 0;
There is nothing you shouldn’t recognize here. You store your models in the list, and you have your camera matrices, a random number generator, and a counter you use later. To generate a unique scene, add the following helper method to generate random vectors:
Vector3 GetRandomV3(float max)
{
Vector3 v = new Vector3();
v.X = (float)(r.NextDouble() * max);
v.Y = (float)(r.NextDouble() * max);
v.Z = (float)(r.NextDouble() * max);
if (r.NextDouble() > 0.5)
v.X *= -1;
if (r.NextDouble() > 0.5)
v.Y *= -1;
if (r.NextDouble() > 0.5)
v.Z *= -1;
return v;
}
This generates a random vector within a certain maximum, and each component can be positive or negative. With that helper out of the way, you can now load your data by adding the following to the LoadContent method:

Here you have a constant declared for the total number of models you want to render, so you can easily add more later to see how performance is affected. You randomly assign a position, velocity, and rotation to your model, and then pick randomly between the two models in the project. Finally, you set up your camera and turn on the default lighting on your two models. Now you want to see your models, so replace your Draw method with the following:
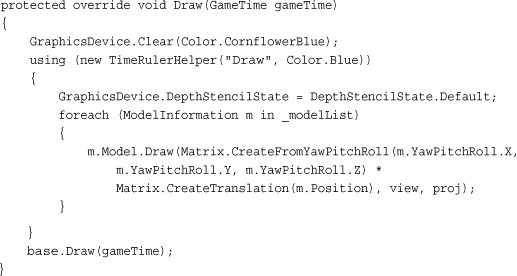
Simply loop through each model and draw it. The one important thing to note here is setting the DepthStencilState before the drawing. The time ruler library turns off depth when it renders its text. It’s generally a good idea to set any state you know you’ll need before drawing your objects, and in this case, you need a depth buffer.
Note
You might also notice that the base.Draw method is still here now, and in some earlier examples, it was removed. If your game has components, you need to include the call to base.Draw. In earlier examples, when it was removed, no components were involved.
This isn’t an exciting example so far! There are a lot of models, but they aren’t doing much. You want them to occasionally bounce off each other, so you need a way to do that. Add the following helper method:

Don’t look at this method as a way to do collision detection. All it does is calculate the distance between the current model and all other models, and if any of the models are within the combined radius of itself and the model it is currently testing, it returns true, signifying that the model is colliding with something. Otherwise, it returns false.
With that, you can implement your Update method; replace your current one with the following:
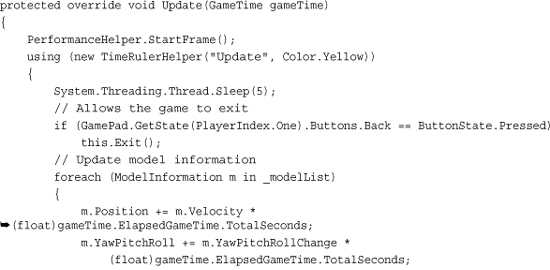
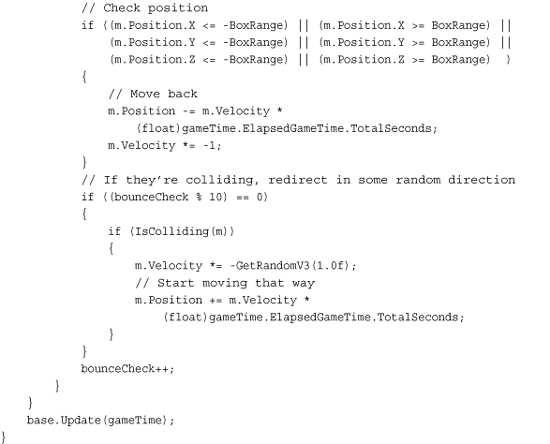
Here you move the models based on their current velocity, and then check to see whether they’ve gone beyond a certain point, and if so, reverse the velocity (but first move it back to its original position). Then, every ten frames, you check the collisions with the helper methods you wrote a moment ago, and if it collides with something, you can randomly change the velocity. Now when you run the game, you see the objects flying around much like you see in Figure 11.6.
Figure 11.6. A simple example of measuring perf

With that out of the way, now we can spend a little time talking about various ways to detect if you’re GPU bound, CPU bound, or if you have achieved a perfect balance (a great goal to strive for). There isn’t a magic button you can press to determine this; you normally have to figure it out via trial and error.
With the time ruler, you can get a good idea of how long things take. If you notice that your Update method takes the majority of your time, you’re probably CPU bound. You can add extra bars to help narrow down which portions of your methods taje the most amount of time. The time ruler can be used as an extremely flexible microbenchmark.
If you have a CPU profiler (which is discussed in slightly more detail in a few moments in this chapter), run that and check the amount of time spent in your Update, Draw, and Present methods. If the vast majority of your time is spent in Update, you are CPU bound! Otherwise, you need to check various things in your game.
If looking at your time ruler bars doesn’t help you gauge where your performance problems lie, you can begin to narrow down where they are by changing your Update method. Add a small Sleep(1) call to the beginning of the Update method. If this doesn’t affect your game’s frame rate, then your game is most likely GPU bound (although you could be perfectly in sync).
The Time Ruler Library
This chapter would be way too long if the entirety of the helper library was explained in detail. However, the entirety of the code for the library is included with the downloadable examples, and that code is well commented.
The DebugManager class is simply to hold the few graphics resources needed to render the text and the bars you see from the other components. The FPSCounter component is an easy-to-use and drop-in frame counter.
The DebugCommandUI is much more customizable than the others. Press the Tab key on your keyboard and you can see that it brings up a console screen that you can type in as seen in Figure 11.7. On Windows Phone, tap the upper left corner of the screen to bring up the console window and the upper right corner to bring up the on screen keyboard to type commands. This works on the Xbox, too, if you attach a keyboard.
Figure 11.7. Seeing the command window console in the helper library

At the time of this writing, you can read more from the author of this helper library at http://blogs.msdn.com/ito although be forewarned that the site is in Japanese.
Performance Measurement Tools
A wide variety of tools are available for profiling. Depending on which flavor of Visual Studio you have, you might have one built in already (it doesn’t exist in the free versions of Visual Studio). You can also use the free CLR profiler you can download from Microsoft’s website.
Note
To use the CLR profiler with VS2010, you need to set the environment variable: set COMPLUS_ProfAPI_ProfilerCompatibilitySetting=EnableV2Profiler.
XNA Game Studio also comes with the Remote Performance Monitor tool that you can use to help profile your game on Xbox.
Profilers can be an enormous help in discovering what is going on in your game and you should certainly spend some time investigating them.
Cost of Built-In Shaders
A point that has been made several times in this chapter is that you should know what your code costs. In this section, we discuss the basic costs of the five built-in effects that are included with the runtime. Because it is hard to say unequivocally what the cost of these will be at runtime, instead you see the number of instructions for each permutation of the shaders with the basic high-level concept that something that is more simple (fewer instructions) is going to be faster. Of course, spending all of your time choosing the fewest instructions is for naught if you aren’t GPU bound!
BasicEffect has a large number of different permutations that it can use depending on which properties you’ve chosen. However, it can be broken down into four main versions, as listed in Table 11.1.
Table 11.1. Cost of BasicEffect
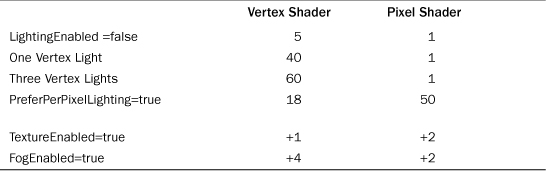
The items that have a cost are represented as plus; some other number means that those features simply cost many more instructions on top of whatever other options you’ve chosen. Notice that aside from when you are using per pixel lighting, all of the pixel shader instruction counts are very low, but when you turn on per pixel lighting, it uses quite a few instructions. If you are GPU bound and are bound by the pixel pipeline, then you certainly wouldn’t want to use this option!
The costs for the SkinnedEffect object can be found in Table 11.2.
Table 11.2. Cost of SkinnedEffect

The first three rows describing the cost of the lighting are what the costs are when the WeightsPerVertex is set to 1; however, the *default* value is 4, so you need to take this into account when looking at these options. You might notice that unlike BasicEffect, you cannot turn off lighting completely or disable texturing in SkinnedEffect.
The costs for the EnvironmentMapEffect object can be found in Table 11.3.
Table 11.3. Cost of EnvironmentMapEffect

Notice that when fewer features are supported by an effect, the cost decreases as you would expect. DualTextureEffect has the simplest effect (and potentially lowest cost), as you can see in Table 11.4.
Table 11.4. Cost of DualTextureEffect

Note that if you are pixel pipeline bound, DualTextureEffect does have the potential for a larger amount of pixel instructions than most permutations of BasicEffect, although DualTextureEffect is probably worth the cost to create some compelling visuals on the phone. The last effect, AlphaTestEffect, has a couple or permutations depending on which AlphaFunction it is used with, as seen in Table 11.5.
Table 11.5. Cost of AlphaTestEffect

We hope this gives you the extra information you need to get a better grasp on how much the effects that ship with the runtime cost for your game.
Summary
Performance is a tricky subject. If your game runs well enough, maybe you don’t need to worry about it at all! Hopefully, throughout this chapter, you learned good practices for dealing with performance and now know ways to find potential pitfalls, measure your game’s performance, and fix issues you run into!
The next chapter delves into adding interactivity to your games by allowing user input!