
3
Actions and Structural Safety
3.1 Types of Actions and Limit State Design
In bridge design, a variety of design actions should be considered at the construction stage or at the final stage (final static system). Construction loads are associated with equipment like formwork launching girders in span by span construction or moving scaffoldings in cantilever construction, as explained in Chapter 4. Under service conditions, the bridge is subjected to permanent actions (dead loads (DL), creep and shrinkage effects) and variable actions, like traffic loads, thermal, wind and earthquake actions, friction at the bearings or settlements of the foundations. Accidental actions may be considered at the final stage of the bridge or at the construction stages.
Nowadays, bridge design verifications are usually based on a semi‐probabilistic approach yielding a limit state design format. This is the approach adopted by most design codes, namely the Eurocodes and specifically Parts 2 of Eurocode 2 (denoted by EC2‐2 [1]) for concrete bridges, Eurocode 3 (denoted by EC3‐2 [2]) for steel bridges, and Eurocode 4 (denoted by EC4‐2 [3]) for steel‐concrete composite bridges. Loads are quantified by characteristic values, except for accidental actions usually defined on the basis of nominal values. A characteristic value is a value with a certain probability of not being exceeded; say 5%, as illustrated in Figure 3.1. Actions are classified as permanent actions, variable actions and accidental actions.

Figure 3.1 Concept of characteristic value Sk of an action S. Example of an action with a normal distribution (density fs), average value  and a standard deviation δ.
At any stage, in service or during construction and according to a limit state design format, the safety of the structure should be verified at Ultimate Limit States (ULS) and at Serviceability Limit States (SLS).
At ULS, safety should be checked for resistance, fatigue and stability under design values of the permanent and variable loads.
At SLS, design verifications are related to limits on the stresses and deflections, on vertical accelerations under traffic loading and crack widths in partial prestressed or reinforced concrete structures. In Europe, as in many other parts of the world, bridge safety is verified according to the Eurocodes [1–5]. The limit state design format at ULS is defined for fundamental load combinations, as
where γg,j and γp are the partial safety factors of each of the permanent actions and prestressing, defined by its characteristic values Gk, j and P; γq,i are the partial safety factors of the variable loads, involving the characteristic value Qk, 1 of the basic variable action and the combination of the other (n−1) variable actions defined by its reduced values, ψ0, i Qk, i. In the following sections, characteristic load values are defined and examples of ψ0, i are given for road and railway bridges. A complete set of values for design practice may be taken from Annex A2 of Eurocode 0 (denoted as EC0 [4]).
Load combinations at serviceability limit states, accordingly to EC0, are defined for
where the values of the permanent G, prestressing P and variable actions Q are quantified adopting the reduction coefficients ψ0, ψ1 and ψ2 for each variable action (i). A characteristic combination is expected to be reached (or exceeded) on a structure with a very low probability, representing in terms of duration, with respect to the design life of the structure, no more than a few hours. A frequent combination may represent a total duration, ∑t1i, of 5% of the design life of the structure, while the number of times reached by a quasi‐permanent load combination, may represent a total duration, ∑t2i, of 50% of the design life of the structure. In Figure 3.2 this general concept is illustrated.

Figure 3.2 Concept of characteristic, combination, frequent and quasi‐permanent value of a variable action Q.
One important concept for bridges is the return period, T, of a variable action. The return period may be related to annual probability, p, of the occurrence of a variable action. For example, the wind loading is usually defined with an annual probability of 2% of being exceeded. A variable action is reached during a certain period R (1 year, 10 years etc.) with a certain probability, p. Approximately, one may take T = R/p, which refers to the characteristic values of wind loading or thermal loading that are usually defined with a probability p = 2% being reached in 1 year, one has T = 50 years. Just for comparison, the return period of the characteristic value of the so called Load Model 1 (LM1) in a road bridge, according to EC1‐Part 2, corresponds to a probability of 10% of being reached in 100 years, which means a return period T = 100/0.1 = 1000 years.
Finally, one refers to the accidental load combinations, like the impact on bridge piers, defined from the nominal values (not defined on a probabilistic basis) of the accidental loads Ad as

3.2 Permanent Actions
These actions include:
- Dead loads – DL, due to the dead weight of structural materials;
- Superimposed dead loads – SDL, from all non‐structural materials, like road surfacing, waterproofing, footways, kerbs, parapets, services, lighting posts and any other materials and equipment included in the bridge;
- Permanent action effects due to prestressing or due to materials like imposed deformations due to creep and shrinkage of concrete or even permanent imposed deformations due to differential settlements.
3.3 Highway Traffic Loading – Vertical Forces
These actions include the loads due to traffic, giving rise to static vertical and horizontal forces, including its dynamic load effects. Just a few years ago, considerable differences between national codes existed and different load models were adopted, even among most European countries. That was the case, for example, between the UK British Standard, the French instructions, the Spanish instruction or the German DIN (Deutsches Institut für Normung e.V.) code. Most of these codes specify traffic loading quite differently from the American AASHTO (The American Association of State Highway and Transportation Officials) – the standard specification for highway bridges. However, most of the codes were based on loading models specifying standard lane and truck loadings. In the last few years, Europe has made an attempt to harmonize traffic loading on bridges. The result was Eurocode 1‐ Part 2 (EC1‐2 [5]), which will be considered here.
Today, highway loading is defined in the Eurocodes based on probabilistic models. The basic definition of traffic loading takes into consideration the categories of the vehicles using the bridges, namely the number, location and average load per axle, the level of loading at each vehicle, namely full or partially loaded, as well as the distance between vehicles. All these variables are characterized by statistical data resulting from measurements of traffic.
One relevant aspect is the influence of the length of the bridge on the design traffic loading. It is understood, for example, if the traffic loading is modelled by a load per square metre, for a suspension bridge with 1000 m of main span, that may not be reasonable modelling traffic loading for a bridge with a typical span of 40 m. The probability of having, for example, the full span and all the lanes loaded with a specified uniformly distributed load (UDL) is quite different between the two cases.
Road traffic load models do not attend to describe actual loads but load effects, such as internal forces and displacements and induced actual traffic loadings. These load models may include directly the dynamic load effects of the traffic, as in EC1‐2 [5].
In the EC1‐2, the load models are defined on the basis of the so‐called notional lanes, defined as lanes of 3 m width, as shown in Figure 3.5. The number of notional lanes, nl, in the full width w of the carriageway defined, for w > 6 m, is the greatest possible integer obtained as Int (w/3). The width of the remaining carriageway is defined as w − 3 Int (w/3) for w ≥ 5.4 m. For w < 5.4 m, nl = 1, and for 5.4 m ≤ w < 6 m, nl = 2.

Figure 3.5 Definition of notional lanes, according to EC1‐Part2 [5].
At a bridge deck with two parts, separated by a fixed central barrier, each part including all hard shoulders or strips is divided into sequentially numbered notional lanes, but only one numbering should be used for the whole carriageway. However, the notional lanes are not necessarily adjacent and the number of loads, their location on the carriageway and their numbering should be chosen to produce the most adverse effects from the load models.
The following load models, with loads specified as characteristic load values and including the dynamic amplification factors, are considered in EC1‐2 [5]:
- LM1 – covering most of the effects of the traffic of lorries and cars and intended for general and local verifications. It is defined by a UDL of 9 kN m−2 on the Notional Lane 1 and by a double axel concentrated loads (tandem system) of 2 × 300 kN, centred at the first notional lane, as shown in Figure 3.6. In the second and third notional lanes, the UDL is reduced to 2.5 kN m−2 and the tandem systems are reduced to 200 and 100 kN per axle, as shown in Figure 3.6 and in Table 3.1. These values should be multiplied by αQi, αqi adjustment factors for different lanes, defined by national authorities but not smaller that 0.8.
The contact area of each wheel (Figure 3.6b) is 0.4 × 0.4 m2. In all the remaining area, a UDL = 2.5 kN m−2 is applied; in all other possible existing lanes this UDL may be neglected, as well as the tandem system (TS) in the third notional lane, under the responsibility of the competent authority. LM1 was defined and calibrated in order to be usable for both general and local verifications. For general verifications, as mentioned earlier, the tandem systems travel centrally along the lanes, but for local effects, two tandems belonging to two different lanes can be closer with a minimum distance of 0.50 m between the axis of two neighbouring wheels (see Figure 3.6b).
- Load model 2 (LM2) – with a single axle load, for local effects, equal to 400 kN to be applied at any location on the carriageway and with a contact area of each wheel of 0.35 × 0.60 m2, as shown in Figure 3.7.
- Load model 3 (LM3) – to be taken into account when one or more of the standardized models is specified by the relevant authority, defined as conventional classes of special vehicles, corresponding to usual abnormal loads and with characteristic loads taken as nominal values associated with transient design situations. These special vehicles are defined in the Annex A of EC1‐2 [5] ranging from vehicles with total weights of 600–3600 kN and with axle lines and location as shown in EN1991‐2. Each notional lane and the remaining area of the bridge deck are loaded by the main loading system, under the conditions specified in EC1 and taken with its frequent values.
- Load model 4 (LM4) – representing a crowd loading associated solely with transient design situations, if relevant, of 5 kN m−2 to be placed on relevant parts of the length and width of the road bridge deck, the central reservation being included where relevant, as well as on the footways or across pedestrian and cycle tracks.

Figure 3.6 Load Model 1, LM1, in EC1‐Part 2 : (a) Tandem System TS and Uniform Distributed Loads UDL; (b) geometrical definition of the TS for the verification of short structural members.
(Source: Adapted from Ref. [5])
Table 3.1 Load model 1: characteristic values according with EC1‐2 [5].
| Tandem system TS | Uniform distributed load UDL | |
| Location | Loads per axe Qik (kN) | qik (or qrk) (kN m−2) |
| Notional lane 1 | 300 | 9.0 |
| Notional lane 2 | 200 | 2.5 |
| Notional lane 3 | 100 | 2.5 |
| Other lanes | 0 | 2.5 |
| Remaining area (qrk) | 0 | 2.5 |

Figure 3.7 Load Model 2, LM2, in EC1‐Part 2.
(Source: Adapted from Ref. [5])
3.4 Braking, Acceleration and Centrifugal Forces in Highway Bridges
The acceleration and braking actions are associated, respectively, to positive and negative accelerations of vehicles and are quantified by means of horizontal longitudinal forces applied at the level of the pavement.
Let the case of braking be considered. When the brakes are activated, a friction force between the wheels and the surfacing is developed, which reduces the acceleration of the mass of the vehicle (Figure 3.9) according to the basic equation of dynamics
where Q and a are, respectively, the weight and the acceleration of the vehicle and g is the acceleration of gravity.

Figure 3.9 Concept for determining braking and acceleration forces.
When a maximum value of the force F is reached (Fmax), consistent with the sliding friction coefficient, the vehicle slides on the surfacing keeping F = Fmax. The friction coefficient μ increases with the reduction of the speed of the vehicle. In the case of a positive acceleration, the contact between the wheels and the surfacing induces horizontal forces – acceleration forces – which may be quantified under the same principle of braking forces, although with a smaller friction coefficient.
In short, the acceleration and braking forces may be quantified as a fraction of the characteristic values of the traffic loading LM1. Hence, in EC1‐2, these actions are quantified by a force Ql taken as a longitudinal force acting at the finished carriageway level and uniformly distributed over the loaded length, L, according to the following expression:
Such that
where L is the length of the deck or the part of it under consideration and w1 the width of lane No. 1 (3 m in normal cases). Note that the values and limits of the force Ql of Eqs. (3.7) and (3.8) are dependent on the adjustment factors αQ1 and αq1 adopted by the National Annexes. The upper limit 900 kN, adopted as the maximum force induced by military vehicles, may also be adjusted in the National Annex. A diagram for Ql as a function of L, obtained from Eqs. (3.7) and (3.8), is shown in Figure 3.10 using adjustment factors equal to 1.
![Graph of Ql [kN] vs. L [m] displaying an ascending line from (1.2,363) to (200,900), which extends horizontally to the right. A box indicates α = 1.0.](http://images-20200215.ebookreading.net/1/2/2/9780470843635/9780470843635__bridge-design__9780470843635__images__c03f010.gif)
Figure 3.10 Braking and acceleration force Ql in road bridges as a function of the loaded length L according to EC1‐Part 2 [5].
In plan‐curved bridges, the centrifugal force associated with traffic actions should be considered. Let a vehicle of mass M and design speed v describe a curve of radius R, as shown in Figure 3.11, the centrifugal force Qt is given by
where Q is the weight of the vehicle and g is the acceleration of gravity. If v is expressed in km h−1 and taking g = 9.81 m s−2, the coefficient c in Eq. (3.9) is given by

Figure 3.11 Centrifugal forces in road bridges.
In EC1‐2, the characteristic values of the centrifugal forces are taken as

where Q is the total maximum weight of vertical concentrated loads of the tandem systems of LM1, that is, 1200 kN for αQ1 = 1. Taking into consideration Eq. (3.10), one may conclude that the expression given in EC1‐2 for 200 m ≤ R ≤ 1500 m, corresponds to a centrifugal force for a vehicle with a load equal to the tandem system and a design speed of about 70 km h−1. For R < 200 m, a centrifugal force equal to 20% of the weight of the vehicle is taken and for R > 1500 m the centrifugal force is neglected.
The centrifugal force should be taken as shown in Figure 3.11, that is, as a transverse force acting at the carriageway level and radial to its axis.
3.5 Actions on Footways or Cycle Tracks and Parapets, of Highway Bridges
These actions are summarized in Figure 3.12, on the basis of the actions defined in detail in EC1‐2 [5], for footways, cycle tracks and footbridges. It consists of a uniform distributed load of 5 kN m−2 specified to cover the static effects of a continuous dense crowd, which should be applied in the relevant parts of the bridge to induce the maximum load effects for the element under study. A Uniformly distributed load of 3.0 kNm–2 is recommended as a combination value together with the LM1 on road bridges. For local effects only, a concentrated load of 10 kN should be considered.

Figure 3.12 Actions on footways or cycle tracks, parapets and kerbs of road bridges according to EC1‐Part 2 [5].
For the design of pedestrian parapets, a pedestrian barrier, EC1‐2 recommends a minimum value of 1.0 kN m−1 (no pedestrian traffic, inspection only) and a maximum of 2.5 kN m−1, depending on the Class of the Parapet (see CEN/TR 1317‐6 [7]) specifically on its width. These forces may be supposed to act horizontally or vertically, as shown in Figure 3.12. In some codes a fixed value is specified, for any kind of bridge parapets, as a minimum horizontal force of 1.5 kN m−1.
3.6 Actions for Abutments and Walls Adjacent to Highway Bridges
The vertical forces applied on the carriageway located at the abutment zone, induces horizontal actions on the walls of the abutments, namely on side and front walls, which should be estimated from the appropriated load model adopted for the design of the bridge. The vertical loads induce the impulse on rest at the walls of the abutments. The simplest load model consists of simulating the effect of highway traffic loading as a UDL at the carriageway and to evaluate the earth pressure at the vertical walls of the abutments through the appropriated earth pressure coefficients. The uniformly vertical distributed load at the carriageway is taken in some codes as 10 kN m−2.
In EC1‐2 the appropriated load models are left to the National Annexes, but LM1 is recommended, although simplifying the tandem system loads by an equivalent UDL, qeq, spread over a rectangular surface 3 m wide and 2.20 m long if, for a properly consolidated backfill, the dispersal angle from the vertical is taken equal to 30°. It should be noted the characteristic values of LM1 include a dynamic amplification that is not usually relevant for roads. Therefore, the characteristic values of LM1 may be multiplied by a reduction factor of 0.7. For example, considering the lane N°1, and using αQ = αq = 1.0, qeq = 0.7 × 600/(2.2 × 3) = 63.6 kN m−2, and outside this area qeq = 0.7 × 9 = 6.3 kN m−2. A longitudinal braking force should also be taken for the design of the abutment stand walls (Figure 3.13) considering that a lorry may brake when arriving on the bridge, which in EC1‐2 is 0.6 αQ1Q1k, with the backfill assumed to be not loaded simultaneously.

Figure 3.13 Longitudinal braking force for the design of abutments up stand walls in EC1‐Part2.
(Source: Adapted from Ref. [5]).
3.7 Traffic Loads for Railway Bridges
3.7.1 General
Railway bridges have many specific aspects to be taken into account in design, some of them are out of the scope of this book. However, some important aspects related to actions, to be referred to here, are:
- load models for railway traffic
- dynamic load effects
- traction, braking, centrifugal forces and nosing forces
- action effects due to track–structure interaction
3.7.2 Load Models
Most European countries adopt the UIC Recommendations, considered also in EC1‐2 [5], where the following load models are specified:
- Load Model 71 and load model SW/0 for normal rail traffic on main railways,
- Load model SW/2 to represent heavy loads,
- Load model HSLM for high speed passenger trains, considered to be trains with speeds exceeding 200 km h−1,
- Load model ‘Unloaded Train’, to represent the effect of an unloaded train.
It is important to note that the load models tend to induce the effects of railway traffic, but they do not attempt to represent by themselves the actual loads from trains. The UIC 71 train [5], here denoted as the load model 71, or simply LM 71, is the typical train load model for design of most railway bridges. The reader may refer to EC1‐2 [5] for the consideration of the remaining load models.
Load model 71 is represented in Figure 3.14. It consists of four axle loads of 250 kN, with the distribution shown in the figure and a UDL of 80 kN m−1 under an unlimited length. These values are characteristic values that, according to EC1‐2, may be multiplied by a factor 0.75 ≤ α ≤ 1.46 on lines carrying rail traffic that is lighter or heavier than the normal rail traffic. This load model should be located at the most unfavourable position for the element under study, taking into consideration that the UDL, or even the concentrated loads, may not act at a certain loaded length if these are the most severe loading conditions for the element under consideration. An example is given in Figure 3.15 for a loading pattern case for the positive bending moment of a continuous beam bridge deck.

Figure 3.14 Load Model 71 for railway bridges.

Figure 3.15 Continuous railway deck: (a) Influence line for M+ at the second mid span and (b) application of LM 71 to obtain the maximum positive bending moment at the second mid span.
The loads of Load Model 71 should be multiplied by the appropriated dynamic load factor, Φ, with values between 1.0 and 2.0, which takes into account the dynamic amplification of load effects due to the overall vibration of the bridge or the local vibration modes of specific structural elements under consideration. This aspect of dynamic factors is considered in more detail in the next section.
For bridges carrying two tracks, Load Model 71 should be applied to one or two tracks in order to induce the most severe effects to the element under study. For bridges with three or more tracks, LM 71 should be applied to any one track, any two tracks or 0.75 times the load model to three or more tracks.
The loads of LM 71 shall be applied with a certain eccentricity to take into account possible lateral displacements of the vertical wheel loads on the tracks. In EC1‐2, this is considered by adopting a ratio of wheel loads on all axles up to 1.25/1.00 on any one track. This applies both to the concentrated load Qvk as well as to the distributed load qvk of LM 71 (Figure 3.16). For maximum eccentricity, one obtains emax = 0.055 r = r/18. Hence, for a standard European gauge track of r= 1450 mm, one has an eccentricity of 81 mm, inducing a torsional moment on the deck under traffic loading.

Figure 3.16 Eccentricity of vertical railway loads.
3.8 Braking, Acceleration and Centrifugal Forces in Railway Bridges: Nosing Forces
The traction and braking forces in railway bridges should be considered to be longitudinal forces along the track, acting at the top of the rails, as UDLs along the associated influence length for the element under study. According to EC1‐2 and for the LM 71, the values of these forces are, respectively, 33 and 20 kN m−1 for traction and braking forces. These are characteristic values, which according to EC1‐2 may be multiplied by the factor α referred to in Section 3.7.2. For tracks restricted to high speed passenger traffic, the traction and braking forces may be taken as 25% of the sum of the axle loads acting on the influence length for the element under consideration.
The total values of traction and braking forces, are, in any case, limited to 1000 kN and 6000 kN, independently of the influence length of the element under study.
Concerning the centrifugal forces, these forces are determined from the general expression already given for road bridges – Eqs. (3.9) and (3.10), being the vertical load of the vehicle Qv identified here with the axle loads Qvk and qvk of the LM 71. For train speeds higher than 120 km h−1, a reduction factor is allowed subject to a minimum value of 0.35. This factor, denoted by f in EC1‐2, is dependent on the influence length, Lf, of the loaded part of curved track on the bridge for the element under consideration, and is given by:

where V is the maximum line speed at the site in km h−1, and Lf in m. For design speeds V less or equal to 120 km h−1 there is no reduction ( f = 1.0) and increasing the design speed above V ≥ 300 km h−1, f is kept at 0.35 for Lf ≥ 80 m.
The centrifugal forces in railway bridges are applied as a horizontal force at 1.8 m above the track level, normal to the axle of the track and in correspondence with the vertical traffic loads of the LM 71 without any dynamic coefficient.
To take into account the impact lateral forces of the wheels on the tracks, namely due to gaps between the wheel and the rail, nosing forces are considered. These forces are applied at the top level of the track, as a concentrated force acting horizontally and perpendicularly to the track. Its characteristic value in most codes, namely in UIC recommendations and EC1‐2, is Qsk=100 kN to be applied without any dynamic factor. According to EC1‐2, this value should be multiplied by the factor α referred to in Section 3.7.2 and always combined with the vertical traffic load.
3.9 Actions on Maintenance Walkways and Earth Pressure Effects for Railway Bridges
Pedestrian, cycle and general maintenance loads should be represented by a UDL with a characteristic value qfk = 5 kN m−2. For the design of local elements, a concentrated load Qfk = 2.0 kN acting alone should be taken into account and applied on a square surface with a 200 mm side.
Concerning the loads to be considered in the evaluation of global earth pressure effects, EC1‐2 specifies that they may be taken as the vertical loads of LM 71, without any dynamic coefficient, uniformly distributed over a width of 3 m at a level 0.7 m below the running surface of the track. For the case of one LM 71, and using α = 1, the concentrated loads induce qeq = 1000/(6.4 × 3) = 52.1 kN m−2 and outside this area qeq = 80/3 = 26.67 kN m−2. An uniformly vertical distributed load of 30 kN m−2 is taken in some codes.
3.10 Dynamic Load Effects
3.10.1 Basic Concepts
To introduce the problem of dynamic load effects in roadway and railway bridges, a single degree of freedom system is adopted, with mass M, elastic stiffness K and viscous damping (i.e. damping proportional to the velocity) defined by the coefficient C. When a constant force P is suddenly applied, the basic equation for dynamic equilibrium [8, 9] is:
where ![]() and
and ![]() denote, respectively, the second and first derivatives of the displacement with respect to time, that is, the acceleration and the velocity. Assuming the system is at rest at t = 0, that is, initial conditions
denote, respectively, the second and first derivatives of the displacement with respect to time, that is, the acceleration and the velocity. Assuming the system is at rest at t = 0, that is, initial conditions ![]() = 0, u = 0, the dynamic response for the undamped system is:
= 0, u = 0, the dynamic response for the undamped system is:
where  is the circular frequency of the undamped system. The term P/K represents the static deflection usta and, hence, the dynamic amplification factor Φ, defined as the ratio between the maximum dynamic deflection udyn and the static one usta = P/K is given for the undamped system by:
Let the viscous damping be introduced through the damping ratio ξ, where Ccr = 2 M ω is the critical damping coefficient. It represents the smallest amount of damping for which the free vibration response changes from an oscillatory to exponential decay response. The system now vibrates with a response as shown in Figure 3.17, including a negative exponential term yielding a decaying vibration, defined by:

Here, ![]() is the damped vibration frequency of the system, differing very little from the undamped vibration frequency, since for most bridges ξ << 5%.
is the damped vibration frequency of the system, differing very little from the undamped vibration frequency, since for most bridges ξ << 5%.

Figure 3.17 Variation of the dynamic coefficient with the viscous damping ratio and the relationship between the applied force frequency, ωf, and the natural frequency, ω.
The dynamic coefficient Φ is therefore reduced with ξ and is still obtained from Eq. (3.15), yielding for the damped system at instant t = π/ωd :
as shown in Figure 3.17. The internal elastic force R = K u is reduced as well in the same proportion. Now consider a moving load P = M g on a simply supported bridge, with velocity v as shown in Figure 3.18. The response of the bridge, modelled here as a simple supported beam with bending stiffness EI and mass per unit length constant μ, is defined by the vertical displacement w = w(x, t) obtained by solving the partial differential equation:

where δ(x − v t) represents the Dirac delta function [8, 10], that is, δ = ∞ for x = v t (at the point of application of the concentrate load) and δ = 0 elsewhere, such that ![]() . Besides, in this equation, ωd represents the damped system circular frequency depending on ξ.
. Besides, in this equation, ωd represents the damped system circular frequency depending on ξ.

Figure 3.18 Simple supported deck vibration analysis: basic properties and first three natural vibration modes.
The undamped beam has natural sinusoidal vibration modes (Figure 3.18) and natural circular frequencies ωn, obtained from Eq. (3.18) for ξ = 0, ωd = ω and P = 0, by:

Equation (3.18) may be solved by analytical methods and classical solutions that are available in the literature [10]. The solutions involve the parameter:

where vcr represents the critical speed of the moving load introducing an unbounded vertical deflection in the undamped system, that is, the resonance condition as it happens in a single degree of freedom (SDF) system when the frequency of the force tends to be equal to the natural frequency of the system. Taking into consideration the value of the first natural frequency of the beam f1 = ω1/(2π), one obtains vcr = 2f1L. Hence, the maximum displacement yields a dynamic amplification factor Φ dependent on the natural frequency of the bridge, as well as on the speed, v, of the mass running on the bridge. Of course, Φ is dependent on the bridge damping ratio and tends to increase with the natural frequency for v to approach vcr. For velocities sufficiently far away from vcr, the dynamic amplification factor for mid‐span deflection, is approximately given by Φ = 1/(1 − α) for an undamped bridge.
Figure 3.19 shows some numerical results obtained for a simply supported span under a moving load at different speeds with respect to the critical speed and for a damping coefficient of 2%. If the irregularities of the carriageway of a highway bridge, or of the rail of a railway bridge are considered, the dynamic amplification factor is dependent on these irregularities as well. Besides, if the mass of the vehicle is not negligible with respect to the bridge mass, the effect of bridge‐vehicle interaction may be relevant with due account for the elastic and damping suspension system of the vehicle. A model is shown in Figure 3.20 for this case. All these effects can only be considered through a dynamic numerical model that considers the structure‐vehicle interaction and the irregularities of the carriageway of the track as a random process. This subject is out of the scope of this book and the reader is referred to specific literature [10–13].

Figure 3.19 Dynamic load effects of a single span railway bridge deck.
(Source: Adapted from Ref. [11]).

Figure 3.20 Model for bridge dynamic analysis with vehicle – structure interaction and real train boggy.
The load models defined for road bridges already include the dynamic coefficient in the value specified for the characteristic traffic loads. Hence, specific consideration of dynamic load effects is relevant for railway bridges only.
3.10.2 Dynamic Effects for Railway Bridges
For railway bridges, the dynamic behaviour of the bridge should be considered, either on the basis of a dynamic analysis or based on a simplified procedure in which a static analysis is adopted but with the traffic loads (Section 3.6) multiplied by a dynamic coefficient. For maximum design speeds not exceeding 200 km h−1, the requirements to allow a static analysis are established in EC1‐2 [5], and are related to the natural frequency of the bridge f1 to be between a lower limit governed by dynamic impact criteria, defined by (Figure 3.21):

and an upper limit, governed by dynamic increments due to track irregularities, defined as
![Graph of fo [Hz] vs. Lϕ [m] displaying a shaded area between 2 descending curves representing the upper and lower limits.](http://images-20200215.ebookreading.net/1/2/2/9780470843635/9780470843635__bridge-design__9780470843635__images__c03f021.gif)
Figure 3.21 Lower and upper limits to allow a static analysis in a railway bridge for spans up to 100 m.
(Source: Adapted from Ref. [5])
The natural frequency of the bridge should take into account the mass due to permanent actions. In Eqs. (3.21) and (3.22), LΦ(m) is the span length for simple supported bridges or an equivalent span for other bridge types. Some simplified expressions to evaluate the natural frequencies of typical bridge cases are given in [14].
A detailed table is given in EC1‐2 to define LΦ. It is important to note that LΦ is related to the vibration mode of the element under consideration. So, for example, if one takes the requirements to allow an overall static analysis of a continuous girder or slab bridge deck, or a continuous portal frame, over n spans, LΦ is the average span length. However, if one considers the cross girders of a steel grid made of a ballastless open deck, LΦ is twice the length of the cross girder. For continuous bridge decks (slabs, slab girders or box girder type) with span lengths Li, i = 1, 2, 3, …, n, one may take for LΦ = k Lm, where k = 1.2 for n = 2 spans, k = 1.3 for n = 3, k = 1.4 for n = 4 and k = 1.5 for n ≥5 , and Lm the average span. In any case, one should never take LΦ to be smaller than the maximum span length Li.
For cases where static analysis is allowed, the dynamic factors by which the loads of LM 71 should be multiplied are defined as Φ2 or Φ3, dependent, respectively, on whether this is the case of a carefully maintained track or a track under standard maintenance. The expressions as proposed by EC1‐2 and UIC specification are as follows:

with 1.00 ≤ Φ2 ≤ 1.67 and 1.00 ≤ Φ3 ≤ 2.0, where LΦ is the ‘determinant’ length referred to earlier. These dynamic coefficients have been determined for simply supported girders; the concept of determinant length LΦ allows generalizing the expressions for Φ2 or Φ3 to other bridge design typologies. In some way, LΦ is the span of the equivalent simply supported beam, defined from the influence line of the deflections in the actual bridge deck.
3.11 Wind Actions and Aerodynamic Stability of Bridges
In most cases of bridge design, wind actions are considered static as equivalent forces, provided the slenderness of the superstructure is ‘moderate’. Cable‐stayed bridges and suspension bridges are typical examples where wind action must be considered on the basis of a dynamic analysis.
Cases of aerodynamic instability, such as the well‐known historical collapse of the Tacoma Narrows suspension Bridge in 1940 (Figure 3.22a) under wind speeds about three times lower than the static design wind action, have shown the need for an in‐depth study of aeroelastic problems in bridge engineering. At the time of this accident, aerodynamic instabilities were considered in the field of aeronautics, but not for civil engineering structures. The open deck cross section adopted in the Tacoma Narrow Bridge is compared in Figure 3.22b with a streamline box girder deck adopted in modern suspension bridges.

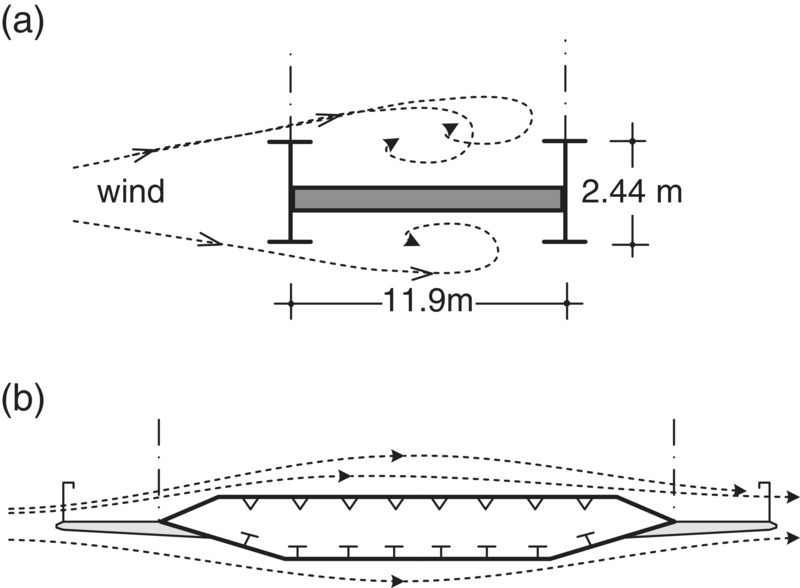
Figure 3.22 The aerodynamic instability that lead to the Tacoma Narrow Bridge collapse, in 1940: (a) Cross section of the deck of Tacoma bridge and (b) compared to the deck cross section of a modern streamline suspension bridge.
Nowadays, bridge designers need to know the type of phenomena involved even when dealing with ordinary structures, as well as the limits of application of design rules, to evaluate wind action on bridge decks. Therefore, some basic concepts on this topic will be developed here.
3.11.1 Design Wind Velocities and Peak Velocities Pressures
The wind is specified at a certain point X = {xi} acting on a structure by its instantaneous velocity v = v{xi, t}, which may be considered to be composed by an average velocity, vm, and a turbulent component, vt:
The average value vm referred is to a certain time interval, Γ, during which wind speed is measured. Generally, Γ = 10 minutes and after a certain number of measurements one has a statistic distribution of the wind speed measured during a certain number of intervals. The basic wind velocity, vb, is a reference velocity for a certain probability of being exceeded (usually 2%, i.e. with a return period T = 50 years) defined in the codes for the bridge site as a function of wind direction and time of the year, at 10 m above the ground and for a certain type of terrain (open field). From vb, the so called mean wind velocity refers to a time interval of 10 minutes, with a probability, p, of being exceeded (usually 2%). A different matter is the design wind speed, v, defined in the codes by its characteristic value, vk, which is associated with the gust wind speed on the site and which may be evaluated for a certain return period related to the design situation under consideration. For example, in the case of erection phases, the design wind speeds are generally lower. For checking the structure during these phases, one adopts a shorter return period, T, say T = 10 years for a construction time no greater than 1 year. The associated characteristic wind speed for T = 10 years and T = 50 years, may be related by [15]:

For T = 10 years, as for the erection phases, vk, 10 = 0.88 vk, 50, that is, a 12% reduction. In some cases, and for very relevant bridges, one may increase the return period from 50 to more than 100 or 120 years, generally the reference lifetime of the structure. For T = 120 years, one obtains vk, 120 = 1.06 vk, 50.
For design, and if no aerodynamic problems are relevant, only the peak wind velocities pressures are needed. However, aerodynamic instabilities should be investigated on the basis of mean wind velocities.
The design mean wind velocity, at a certain level z above the ground, may be determined by:
where c0(z) is the orography factor, taken as 1.0 unless otherwise specified and cr(z) is the roughness factor defined, for example, in Part 1‐4 of EC1 (denoted by EC1‐1‐4, [15]) by:

where kr is the terrain factor, which is a function of the roughness length, z0. In EC1‐1‐4 there are five terrain categories, being categories 0 and I associated to a bridge site on the sea or in a coastal area. Category IV is for a bridge at an urban site. Intermediate categories II and III correspond, respectively, to open country with low vegetation and isolated obstacles, or areas with regular cover of vegetation or buildings (such as villages, suburban terrain and permanent forests).
For example, one has z0 = 0.003 m for roughness length in terrain category 0, z0 = 0.05 m for category II and 1.0 m for category IV. The expression in Eq. (3.27) holds for z > zmin; that is, respectively, 1.0 m for terrain category 0 and 10 m for category IV. Otherwise, one takes cr(z) = cr(zmin). Using c0(z) = 1.0 and cr(z), according to the expressions given in EC1‐1‐4 [15], yields the curves given in Figure 3.23 for terrain roughness categories between 0 and IV. The design wind speed may be defined by multiplying the mean wind velocity by a factor to take turbulence into consideration:
where g is the ‘peak factor’ (that may be taken as 3.5 as in EC1‐1‐4) and Iv(z) the turbulence intensity at level z defined as:

where σv is the standard deviation of the turbulence assumed constant with z and kl is a turbulence coefficient (kl = 1.0 in [15]) and c0 is the orography factor already defined. The expression is only valid above a minimum level zmin (between 1.0 and 15 m, respectively, for terrain roughness of categories 0 and IV) above the ground and for z ≤ 200 m. Below zmin, one assumes a constant minimum turbulence evaluated from Eq. (3.29) for z = zmin. From these considerations, one may define the peak wind speed, including the turbulence effects, as:
From the design wind speed, v, the peak velocity pressure on an element of the structure is evaluated by:
where ρ is the unit mass of the air taken, under normal conditions, as ρ = 1.25 kg m−3. From these expressions, the peak pressure can be written in terms of the wind pressure, qb, associated to the basic wind velocity, vb, by:
where ce(z) is the exposure factor given by:
Figure 3.24 presents the values for the exposure factor as given in EC1‐1‐4 [15], allowing a direct calculation of the peak velocity pressure from the basic wind velocity, vb, defined in the code for the bridge site.

Figure 3.23 Roughness factor cr(z) as a function of the height z and for co(z) = 1.0.

Figure 3.24 Exposure factor ce(z) as a function of height z, for co(z) = 1.0 and kl = 1.0.
3.11.2 Wind as a Static Action on Bridge Decks and Piers
Let a bridge deck (Figure 3.25) be considered under the action of a uniform wind flow of speed vα acting at a certain angle of attack, α. The deck is subjected per unit length, to the following forces as denoted in Figure 3.25:
where ![]() is the wind pressure associated to vα, and CD, CL and CM are nondimensional coefficients designated as shape aerodynamic coefficients dependent on the geometry of the cross section of the deck and on the angle of attach α of the wind flow. The dimension d is a characteristic dimension of the cross section, as its depth, to which the shape coefficients are referred to. However, the shape coefficients can also be referred to the deck width b or, for example,CM may be defined by expressing the moment as
is the wind pressure associated to vα, and CD, CL and CM are nondimensional coefficients designated as shape aerodynamic coefficients dependent on the geometry of the cross section of the deck and on the angle of attach α of the wind flow. The dimension d is a characteristic dimension of the cross section, as its depth, to which the shape coefficients are referred to. However, the shape coefficients can also be referred to the deck width b or, for example,CM may be defined by expressing the moment as ![]() where b is the width of the cross section and
where b is the width of the cross section and ![]() .
.

Figure 3.25 Wind forces on a bridge deck: drag FD, lift FL and moment MT.
For current bridge design cases, the drag force induced in a bridge component by the wind action is the most relevant one, and it is evaluated by (Figure 3.26):
where FD is the horizontal wind force and Aref, x is the reference area of the element exposed to the wind action and projected on a plan normal to the wind direction. For the wind actions on the bridge deck it is usual to define the forces FD per unit length, where the deck is simulated by a rectangular envelope of width b and depth d. The drag coefficient, CD is given as a function of the ratio ![]() , and for a reference area 1 × d one may adopt the values given in Figure 3.27 taken from the EC1‐1‐4 [15] for open or box sections.
, and for a reference area 1 × d one may adopt the values given in Figure 3.27 taken from the EC1‐1‐4 [15] for open or box sections.

Figure 3.26 Drag wind force, FD, on the envelope of a cable‐stayed bridge deck, Funchal. Design by GRID.


Figure 3.27 Drag coefficients, CD and CL, or unloaded or bridge decks under traffic.
(Source: Adapted from Ref [15], EN1991‐4)
In most cases, ![]() is above 4 and CD lies between 1.0 and 1.3. For box sections with inclined webs, CD may be reduced at 0.5% per degree of web inclination with the vertical, with a maximum reduction of 30% in any case.
is above 4 and CD lies between 1.0 and 1.3. For box sections with inclined webs, CD may be reduced at 0.5% per degree of web inclination with the vertical, with a maximum reduction of 30% in any case.
When the bridge is under traffic (Figure 3.27) the depth of the vehicles must be considered when evaluating the exposed area, Aref, x. For road bridges, this is considered by taking an additional depth of 2.0 m above the deck, while for railway bridges this is done by taking an additional depth of 4.0 m from the top of the rails on top of the total length of the bridge. For bridges under traffic, the dynamic wind pressure is reduced by taking a reduced basic wind velocity (![]() is limited to 23 m s−1 for road bridges and 25 m s−1 for railway bridges) to take into consideration the reduced probability of having the bridge under the characteristic value of the live loads together with winds blowing at very high speeds. For specific design cases, the maximum peak wind velocity may be limited (e.g. to 100 km h−1) as a safety condition for the vehicles, which means the bridge should be closed to traffic if higher peak wind velocities are forecast.
is limited to 23 m s−1 for road bridges and 25 m s−1 for railway bridges) to take into consideration the reduced probability of having the bridge under the characteristic value of the live loads together with winds blowing at very high speeds. For specific design cases, the maximum peak wind velocity may be limited (e.g. to 100 km h−1) as a safety condition for the vehicles, which means the bridge should be closed to traffic if higher peak wind velocities are forecast.
For lift forces, unless some wind tunnel tests have been performed for the deck section or a specific CL coefficient is defined in EC1‐1‐4 [15]; from Figure 3.27 one may take CL = +0,9 or CL = −0,9, and the vertical action as
where Aref, z = b L is the in‐plan area of the deck length L.
The moment due to wind actions on the deck may be evaluated by assuming the drag force, FD, acting at 60% of the equivalent depth (deq), measured from below and the lift force, FL, at 25% of the width (b) measured from windward (Figure 3.27).
For the piers, one may adopt the force (drag) coefficients given for rectangular or polygonal sections in EC1‐1‐4 [15] or, in a simplified approach, take the equivalent rectangular envelope shape as given in Figure 3.28. The force coefficients are in general between 1.0 and 1.8. In tall piers, these forces are evaluated with a variable wind pressure, q, with respect to the height above the ground.

Figure 3.28 Force coefficients for bridge piers.
3.11.3 Aerodynamic Response: Basic Concepts
Wind‐tunnel tests, done on section models such as the one shown in Figure 3.29, are most useful to interpret and determine the dynamic response of the deck under wind flow‐aerodynamic response. A section model for a wind‐tunnel test consists of a scale model of a certain length of the deck, L, which is determined by the available width of the tunnel in order to avoid any blockage effects under the test wind flow due to the proximity of the walls of the tunnel. This sectional model is then attached at its extremities to springs simulating the elastic stiffness of the remaining structure. These springs are modelled with scale stiffness in order to reproduce the scale of the main frequencies of the deck, which for these types of problem are, basically, the vertical and torsion frequencies, fb and ft, respectively. Figure 3.29 presents the variation of the shape coefficients CD, CL and CM with the angle of attack, α. These values may be adopted for the evaluation of the equivalent static wind forces on the deck referred to in the previous section. For example, for α = 0, one has CD = 1.17, CL = −0.494, CM = −0.006.


Figure 3.29 Wind tunnel test on a sectional model of a bridge deck of Figure 3.26: Drag CD, lift CL and moment CM coefficients, as a function of the angle of attack α of the wind [16].
Reproduced with permission from GRID, SA.
Under certain wind flow conditions, the deck (or the sectional model in the wind tunnel) may experience several types of aerodynamic excitation (Figure 3.30), which are characterized by a motion of limited or divergent amplitudes of oscillation. In the first case, limited amplitude response, which may induce unacceptable stresses or fatigue, different cases may occur:
- Vortex induced oscillations associated with the so‐called vortex shedding alternately from the upper and lower surface of the bridge deck (Figure 3.30). The frequency of the vortices, dependent on the magnitude of the wind velocity, v, being close to the bending frequency of the deck, induce the risk of resonance if structural damping is not enough to reduce the amplitude of the oscillations.
- Turbulence response, due to the turbulent nature of the forces induced by wind gusts, the deck may oscillate if sufficient energy is induced at certain frequency bands close to the natural frequencies of the structure. This phenomenon may usually be neglected if both bending and torsion natural frequencies, fb and ft, are greater than 1 Hz. Otherwise, the dynamic effects of turbulence response should be considered on the basis of a dynamic analysis.

Figure 3.30 Aerodynamic instabilities.
The case of divergent amplitudes of oscillation gives rise to aerodynamic instability of the deck, namely by galloping or flutter, as referred in the sequel. For details on basic references on bridge aerodynamic stability, the reader is referred to Refs. [17–19].
3.11.3.1 Vortex Shedding
The wind flow around a bridge deck, a pier or even a stay cable, as shown in Figure 3.30, may induce vortex shedding. The pressure difference between the two sides of the element under wind flow, due to vortex shedding, produces transverse forces normal to the direction of the wind and so possible bending vibrations. These vortices are known as von Karman vortices after studies of this phenomenon by von Karman at the beginning of twentieth century. If the frequency of the vortices is close to one of the natural frequencies of the structure, only damping can limit large displacements induced by a resonance phenomenon.
In vortex shedding, the intensity and frequency of the vortices are dependent on the wind velocity v and on the geometry (shape) of the deck, namely its depth/width ratio ![]() . The critical wind speed for a bridge deck, to induce vortex shedding, is given by:
. The critical wind speed for a bridge deck, to induce vortex shedding, is given by:

where fo is the natural frequency of the fundamental mode, d is the depth of the cross section and St is the Strouhal number [15, 19], equal to 0.2 for a cylinder; for a rectangular section (that may be taken as bridge deck envelope) this only varies between 0.1 and 0.09, when 0.5 < ![]() < 10. If the critical wind speed, vcr,VS, given by Eq. (3.37) is low, transverse oscillations may occur under normal wind conditions.
< 10. If the critical wind speed, vcr,VS, given by Eq. (3.37) is low, transverse oscillations may occur under normal wind conditions.
However, the induced transverse forces due to deck oscillations are small for low critical wind velocities and if the structural damping is enough to reduce the amplitude of the oscillations the consequences of the phenomena of vortex shedding are reduced. The relevance of vortex shedding may increase when the deck critical wind speeds are high, yielding high transverse forces in the structure under wind flow oscillations.
In practice, safety precautions against resonant critical conditions are satisfied if the critical wind velocity for vortex shedding is at least 1.25 times greater than the mean wind velocity as defined in Section 3.11.1.
3.11.3.2 Divergent Amplitudes: Aerodynamic Instability
The cases of divergent amplitudes, inducing oscillations that may lead to collapse by aerodynamic instability of the structure, are associated with the following basic phenomena:
- Instability in pure torsion – torsional divergence
- Instability in pure bending – galloping
- Instability by flutter in a single mode – torsional flutter
- Interactive instabilities, in torsion and bending – classic flutter
The first mode corresponds to an induced torsional rotation of the deck that cannot be ‘reduced’ by its elastic torsion resistance; is like a static instability mode and is not critical for a bridge deck because it is associated with very high wind velocities.
The second mode, galloping, is a self‐induced crosswind bending mode vibration occurring when the apparent variable incidence of the wind, due to the motion of the deck, induces vertical forces amplifying the bending movement. Some cases of practical examples of galloping are referred in Ref. [20] for decks and in particular for pylons of cable stayed bridges with a single plane of cables. The example of the wind tunnel testing undertaken for the Second Panamá Bridge (Figure 3.31) is presented. Galloping may be appraised on the basis of the lift coefficient and to its variation with the angle of attack, α, of the wind flow. A necessary condition for gallop may be taken from sectional wind‐tunnel tests. For that, observing at α = 0 the value of the drag coefficient and the variation with α of the lift coefficient, the necessary condition for gallop, the den Hartog criterion, reads:

Figure 3.31 Centennial Bridge – second crossing of the Panama Canal
(Source: Photograph by Wsvan/https://commons.wikimedia.org).
As CD > 0, gallop cannot occur if the derivative of the lift coefficient at α = 0 is positive. For example, this condition is satisfied by the results for CL presented in Figures 3.26 and 3.29. For the wind‐tunnel studies on the second Panama Bridge mast [20], for wind angles of attack between 5 and 6°, ![]() = −5,34. However, further stability studies have shown the resulting damping remains positive for a 100‐year wind return period, assuring aerodynamic stability [20].
= −5,34. However, further stability studies have shown the resulting damping remains positive for a 100‐year wind return period, assuring aerodynamic stability [20].
If wind‐tunnel tests are not available, the critical wind speed for galloping may be estimated for bridges with main spans up to 200 m by,

where fb is the natural bending frequency, Cg is a galloping coefficient, m is the mass per unit length of the deck, δs is the logarithmic decrement of structural damping, ρ the density of the air = 1.25 kg m−3 and d is the depth of the cross section of the deck. Galloping coefficients Cg may be taken from specific literature [15, 21]. In Ref. [21], values equal to 1.0 or 2.0 are proposed, respectively, for bridges with side overhangs less than or greater than 0.7 d, where d is the depth of the bridge deck. For aerodynamic stability problems, the logarithmic decrement δs may be taken to be 3% for steel bridges, 4% for composite bridges and 5% for concrete bridges. It should be noted that the damping coefficient is ξ ≅ δs/(2π) [17], results in ξ = 0.5% for steel bridges and 0.8% for concrete bridges.
Flutter in a single mode, stall flutter, is similar to gallop. It is a self‐induced vibration in a single periodic torsion mode of the deck; it is induced by a periodic torsion oscillation originating from a periodic variation of the flow around the deck. The stall flutter critical wind speed may be evaluated from the torsion natural frequency ft (Hz) on the basis of the following simplified formula [19, 21]:
where τ is a coefficient depending only on the type of the cross section, such that τ = 5 in most cases. But, for cases of slab or box girder sections with b < 4 d, then τ = 12.
Classical flutter is mainly an aerodynamic instability due to the interaction of the bending and torsion forced vibration modes of the deck under wind action. In slender bridge decks, namely with large values of the length/width ratio (L/b) as is often the case in suspension bridges, and with a low frequency ratio ft/fb between the torsion and bending natural frequencies, there is risk of interaction between the basic oscillation modes of the deck. The structure, for a certain critical wind speed, may experience large amplitude coupled oscillations and in these cases, structural damping may not be enough to avoid a collapse by aerodynamic instability by classical flutter.
The theoretical background of this phenomenon goes to the interaction of two oscillation modes in dynamic stability of structures, as shown in a schematic form in Figure 3.22 for a simple two degrees of freedom system [22]. The excitation load parameter λ is, for example, the dynamic wind pressure, inducing a forced oscillation in the dynamic equilibrium of the structure. For λ = 0, the system has two natural vibration frequencies, f01 and f02; under increasing load λ, these frequencies tend to coalesce, but above a certain load level dynamic equilibrium is no longer possible, inducing unlimited amplitude oscillations. The critical load for flutter instability is then associated to the load at which the two forced vibration frequencies tend to coalesce, as shown in Figure 3.32. Classical flutter of bridge decks may be investigated by a variety of approaches, namely simple analytical approaches [15, 17, 19, 21] – Selberg formula, Kloopel diagrams, CECM (Convention Européenne de la Construction Métallique) tables, Scanlan Derivatives, Numerical Approaches or Wind tunnel testing [23].

Figure 3.32 Flutter in a 2 DOF nonconservative system (F – follower force; f0i – natural frequencies).
The simplest approach, for the critical wind speed of flutter instability of a bridge deck, is to adopt the basic case of an ideal thin plate aerofoil for which the Selberg formula [21] holds,

where m is the mass per unit length of the deck, r is the polar radius of gyration of the bridge cross section, that is, ![]() , with Io = ρ(Iy + Iz) the polar mass moment of inertia of the cross section and A its area, ρ is the air unit mass = 1.25 kg m−3, b is the width of the cross section and fb and ft are the natural bending and torsion frequencies of the deck. The Selberg formula can also be adapted to evaluate the flutter critical wind speed of bridges with main spans less than 200 m through a correlation factor η [19] (Figure 3.33),
, with Io = ρ(Iy + Iz) the polar mass moment of inertia of the cross section and A its area, ρ is the air unit mass = 1.25 kg m−3, b is the width of the cross section and fb and ft are the natural bending and torsion frequencies of the deck. The Selberg formula can also be adapted to evaluate the flutter critical wind speed of bridges with main spans less than 200 m through a correlation factor η [19] (Figure 3.33),

Figure 3.33 Values of the reduction factor η to determine the critical classical flutter velocity with respect to the critical velocity of a thin plate (η = 1.0) by the Selberg formula.
The Selberg formula gives good approximations for the critical wind speed, provided that the ratio fb/ft > 1.5 and δs is about 0.05. From Eq. (3.41) the influence of the following parameters is apparent:
- the ratio fb/ft, yielding a low critical wind speed when the frequencies are close to each other; in practice, it is convenient to have fb/ft > 2.5 as a starting point to warranty aerodynamic stability; the η values may vary between 0.2 for a slab girder type deck to 0.6 for a standard box girder deck; for a streamline box girder deck the values may approach 0.9. Some values are given in Figure 3.33 and more detailed values may be taken from [19];
- the parameter m r/ρ b3 = [m/(ρ b2)] (r/b), from which the influence of the ratios m/(ρ b2) and (r/b) are apparent; the former m/(ρ b2) is dependent on the cross section of the deck but it varies approximately inversely with the width b; the last (r/b) is about 0.3 for a practical range of bridge decks varying only between 0.27 for single box girders with large deck overhangs to 0.32 for decks supported by main girders or cables at the outer edges, as referred to in [21].
It is clear from the Selberg formula that aerodynamic stability is very much improved by the torsion stiffness of the deck, which increases the torsion frequency, ft. This is the case for modern suspension bridges with ‘streamline’ box deck sections as shown in Figure 3.22b.
For all cases of aerodynamic phenomena (gallop, stall flutter or classical flutter), safety should be checked by assuring a safety factor for the critical wind speed of at least 1.5 with respect to the mean wind velocity measured at the deck level.
3.12 Hydrodynamic Actions
Bridge piers and foundations located in river beds are subjected to hydrostatic and hydrodynamic actions. The hydrostatic action on an immersed element is an upward vertical force equal to the weight of the volume of water occupied by the element. Hydrodynamic actions are determined from the water pressure against the element. If v is the water flow velocity in (m s−1), ρ the unit weight of the water and g the acceleration of gravity, one has:
where c is a shape factor dependent on the geometry of the immersed element. Taking g = 9.81 m s−2 and γ = 10 kN m−3, one has from Eq. (3.43): p = 0.51 c v2 (kN m−2).
Figure 3.34 presents values for the coefficient c for typical pier shapes. In flood conditions, it is quite important to take into consideration the effect of the solid material being transported by the water, yielding an equivalent unit weight (density) with values between 10 and 12 kN m−3. Another relevant effect of hydrodynamic actions, as referred to in Chapter 2, is the scour effect around bridge pier foundations.

Figure 3.34 Hydrodynamic actions on immersed piers. Shape factors.
3.13 Thermal Actions and Thermal Effects
3.13.1 Basic Concepts
Temperature actions in bridges are due to temperature distributions within the structural elements, namely induced by solar radiation, as shown in Figure 3.35a. The heat of hydration of cement in concrete bridges is another relevant action, in particular up to three to four days after concreting the element. In general, one has to deal with a nonlinear distribution of temperature within the element (Figure 3.35b), which is dependent on several parameters, namely related to local climatic conditions, the orientation of the element, geometrical and material properties of the element as well as on specific characteristics of the surfacing of the bridge deck. The effects of thermal actions may be evaluated by splitting it into the following components:
- the uniform temperature variation, measured from a reference temperature, T0, being the temperature with respect to which the action effect is considered; for example, the erection (or completion) temperature or more generally the temperature at the relevant stage of the structural element at its restraint.
- the differential temperature variation, which yields a thermal gradient within a bridge component, namely in a bridge deck due to solar radiation or due to the heat of hydration of cement in a concrete bridge. This is illustrated in Figure 3.36, where a nonlinear distribution of the temperature in a bridge deck results from a certain period of heating and cooling of the upper surface of the bridge deck under the solar radiation effect, while at the bottom surface the temperature is controlled by the shade temperature [24].

Figure 3.35 Effect of sun radiation on a bridge deck: (a) Parameters influencing the temperature distribution and (b) nonlinear temperature distribution in a prestressed concrete bridge girder.

Figure 3.36 Theoretical (numerical) and measured results for the temperature distribution in a concrete bridge deck cross section [24].
The uniform temperature variations are associated with seasonal changes, while the thermal gradients within the deck, or within any other bridge element such as a pier shaft, are associated with daily thermal variations.
The uniform and differential temperature actions in bridges are specified in codes for actions. These temperature distributions are dependent on a set of parameters, namely, solar radiation, air temperature, the degree of nebulosity and wind velocity, bridge location and its orientation, the shape of the cross section, thermal properties of the material and the type and colour of the surfacing of the bridge deck.
Formally, the temperature distribution, T, in a bridge deck is determined from the Fourier heat equation [25]:
Where:
- ΔT = ∂2T/∂x2 + ∂2T/∂y2 is the Laplacian of the temperature T (x,y,t) at each instant, t, if assumed only dependent on the cross section coordinates x and y; that is, the same for all cross sections,
- k is the thermal conductivity, representing the rate of heat flow per unit area and per unit temperature gradient, k (W m−1 °C),
- Q is the amount of the heat generated inside the deck per unit volume and per unit time, Q (W m−3), as for example the heat of hydration of cement in a concrete bridge deck,
- ρ (kg m−3) is the material density (unit weight), and finally,
- c is the specific heat of the material, that is, the quantity of heat required to increase the temperature of the unit mass by one degree, c (J kg−1 °C−1).
Equation (3.44) is a partial differential equation to be solved taking into consideration the temperature and the heat flow conditions at the boundary of the deck surface, which may be expressed as
where ![]() is the derivative of temperature in the direction normal to the boundary defined by the unit vector n, that is,
is the derivative of temperature in the direction normal to the boundary defined by the unit vector n, that is,
where nx and ny are the direction cosines of n and grad T denotes the temperature gradient at the boundary. In Eq. (3.45), q denotes the amount of heat transfer per unit time and per unit area of the boundary, with the units W m−2.
To solve Eq. (3.46), the quantity of heat q in Eq. (3.44) has to be defined as the sum of three basic quantities – solar radiation, qs, which is dependent on the total heat from solar rays reaching the surface per unit area and per unit time, the amount of heat transfer by convection, due to the temperature difference between the bridge surface and the air, which is dependent on the wind speed, the type of material and on the configuration and orientation of the surface, and finally on the amount of radiation from the surface to the surrounding air. The reader is referred to Ref. [26] for a detailed discussion on thermal and meteorological properties involved in the use of Eq. (3.44). This equation may be solved, for example, on the basis of a finite element approach, to find the temperature at the bridge deck at each instant and at each point. Standard computer programs [27] may be adopted for specific bridge problems and for parametric studies to define the thermal field in typical bridge decks. Figure 3.36 shows a typical example for a bridge deck. The temperatures at several hours of the day were evaluated from a finite element program along the depth of the cross section and measured in a deck model. The basic geometrical and thermal characteristics adopted for the numerical model are referred to in the figure.
3.13.2 Thermal Effects
For design practice, the temperature distributions in bridge decks are usually defined from values defined in the codes. Only in very particular cases numerical models based on the approach referred in the previous section to evaluate the thermal field have to be developed. Let the effect of a nonlinear temperature distribution T(z, t) be assumed in the case of a statically determinate structure as shown in Figure 3.37 – a simply supported bridge deck with a constant cross section. One assumes the temperature distribution T at each time instant t, as being the same for all the cross sections and dependent only on the z coordinate of the sections. For the case under consideration, the nonlinear temperature distribution yields a self‐equilibrated stress field (eigenstresses) in the bridge deck, but no internal forces since the structure is statically determinate. To show this, one may consider the evaluation of these stresses, by using the principle of superposition of elastic effects, as shown in Figure 3.37. Firstly, one introduces a longitudinal restraint at the end sections by introducing applied stresses defined by:
where E is the Young’s modulus of the material and α is the coefficient of thermal expansion. The thermal strains ε = α T(z, t) are restrained by σ0. At the end sections with area A of the cross section, the stress resultants are given by:

Figure 3.37 Nonlinear temperature distribution in a simple supported bridge deck – Analysis scheme to determine the self‐equilibrated normal stresses.
By applying a force N1 = − N0 and a moment M1 = − M0 at the end sections and superposing the two stress fields, σ0 and σ1 (due to N1 and M1), the stress field as indicated in Figure 3.38 is obtained by simple beam theory:

where Iy is the moment of inertia with respect to the neutral y‐axis of the cross‐section. By introducing the definitions of N1 and M1 and taking into consideration Eq. (3.48), one obtains the stress distribution

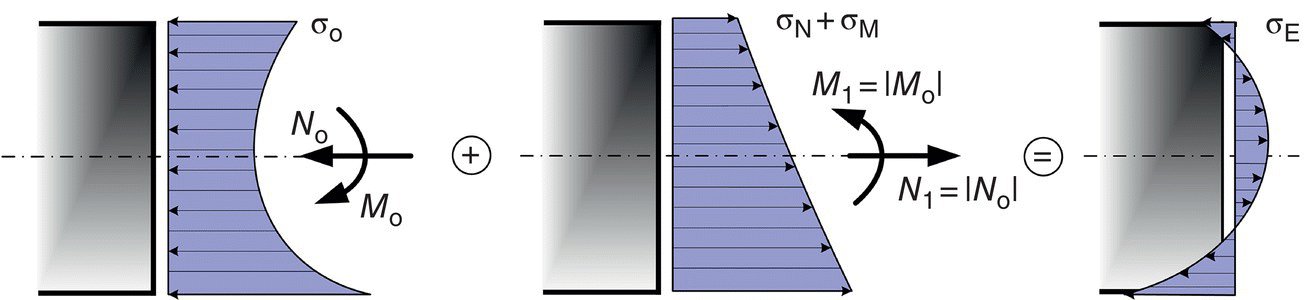
Figure 3.38 Self‐equilibrated thermal stresses in a simple supported deck.
So, the resulting stresses may be defined as
where ∆TU and ∆TM are the average (uniform) and linear temperature components defined as:

and ∆TE is a nonlinear temperature component defined as
In conclusion, the temperature distribution within a specific bridge element T(z, t), may be split into an uniform temperature component, ∆TU, a linear varying temperature component, ∆TM, and a non‐linear temperature difference component, ∆TE, the last one giving rise to a self equilibrated stress field σE – eigenstresses. On a more general form, as represented in Figure 3.39, the linear varying temperature component, ∆TM, is a temperature gradient along the vertical z‐axis, ∆TMz, but also a temperature gradient along the y‐axis, ∆TMy.

Figure 3.39 Decomposition of a nonlinear temperature distribution in a uniform, linear and self‐equilibrated component.
For statically determined structures, ∆TU and ∆TM do not induce any internal forces or stresses in the structure, but only strains and deflections. The uniform temperature only affects the design of the bearings and expansion joints through the imposed displacements.
Effectively, ∆TU and ∆TM induce an elongation and a constant curvature deflection in the beam, according to the Bernoulli hypothesis of plane sections in a remaining plane. Since the structure is statistically determined, these deformations, as shown in Figure 3.40, do not induce any internal forces. The bridge deck elongates with a total displacement u at the free end section and takes a constant curvature, 1/RM, given by

where ε represents the strain at a distance z of the neutral axis and ∆TM is the difference of temperature between the top and bottom surfaces of the bridge deck with depth h, as shown in Figure 3.40. Only the nonlinear temperature component gives rise to a nonlinear stress field σE, which has the same shape of ∆TE distribution as results from Eq. (3.51).

Figure 3.40 Effect of a uniform and a linear temperature distribution in a simple support bridge deck with a rectangular cross section. Analysis scheme to determine the self‐equilibrated normal stresses.
Let the case of statistically undetermined structures be considered. If the same bridge deck is now assumed to be longitudinally built in at the end sections (Figure 3.41), which, however, are assumed to be free for the displacements in the plane of the cross section, the uniform and linear thermal components do not induce any deformations (the longitudinal displacements are totally restrained) but internal forces are generated that are equal to the stress resultants, N0 and M0, due to the stresses, σ0, restricting the longitudinal displacement and curvature in the simply supported case:

Figure 3.41 Thermal actions and actions effects of a linear temperature distribution on a built‐in deck with a rectangular cross section.
Now let the case of a continuous bridge deck be considered, as shown in Figure 3.42. The uniform temperature component induces a total displacement at the expansion joint, u, which is still given by Eq. (3.54), now with 2.5L being the length of the bridge deck. The nonlinear temperature distribution, ∆TE, induces the same stresses as in the simply supported case shown in Figure 3.37.

Figure 3.42 Linear temperature distribution in a continuous bridge deck.
The linear temperature component, ∆TM, induces a linear bending moment diagram in the bridge deck, as shown in Figure 3.43, due to the induced reactions R that may be easily evaluated (Figure 3.44) by the force method of linear structural analysis. Using the symmetry and the principle of virtual work for evaluating displacements for the deflections at the internally supported sections of the released structure, one assumes a simply supported beam and, as ![]() given by Eq. (3.54),
given by Eq. (3.54),


Figure 3.43 Bending moment diagrams, due to permanent loads (Mp) and a linear temperature distribution (MT) in a three span continuous bridge deck.

Figure 3.44 Evaluation of the bending moment diagram by the Force Method in a three span continuous bridge deck.
The displacements ![]() in the base system due to the forces
in the base system due to the forces ![]() are
are

From compatibility ![]() , one obtains
, one obtains

Figure 3.43 shows the final elastic bending moments due to the dead load p and the linear temperature variation ∆TM. Then, for a positive ∆TM, the bending moments increase at the span sections due to ∆TM and are reduced over the supports.
3.13.3 Design Values
The uniform temperature component depends on the maximum and minimum temperature variation experienced by the bridge, which is dependent on the maximum and minimum shade air temperature, Tmax and Tmin, and on the initial bridge temperature, T0. So, the maximum expansion and contraction ranges of uniform bridge temperatures are defined as:
where the values of Te, max and Te, min are the uniform bridge temperature components that are dependent on Tmax and Tmin, as well as on the type of structural material. Figure 3.45 shows the correlation between the characteristic values of the shade air temperature and the uniform bridge temperature component, for steel, composite and concrete bridge decks. Characteristic values of shade air temperatures shall be obtained at the site location with reference to national maps of isotherms usually given in each country national annex of Part 1‐5 of EC1 (denoted as EC1‐1‐5 [28]).

Figure 3.45 Correlation between Tmax and Tmin site temperatures and bridge deck uniform temperature on steel (type 1), composite (type 2) and concrete (type 3) bridge decks.
As an example, for the case of a bridge site where Tmax and Tmin are, respectively, 40 and −10°C, if one assumes T0 = 10°C, one obtains for a steel bridge deck, using Eq. (3.59) and Figure 3.45, ∆TU, exp = 55−10 = 45°C and ∆TU, cont = 10 − (−13) = 23°C. For the same site conditions but for a concrete bridge deck, one obtains ∆TU, exp = 42 − 10 = 32°C and ∆TU, cont = 10 − (−2) = 12°C.
The vertical temperature component with nonlinear effect is defined as well in EC1‐1‐5 for steel, composite and concrete bridge decks on the basis of typical temperature diagrams along the depth of the deck. An example of these diagrams for a steel box girder deck is represented on Figure 3.46. It is important to note that these diagrams include the linear temperature gradient ∆TM and the nonlinear temperature gradient ∆TE, together with a small part of component ∆TU, which is included in the uniform bridge component. So, from Eqs. (3.52) and (3.53), these diagrams may be used to evaluate ∆TM and ∆TE.

Figure 3.46 Nonlinear temperature distribution in a box girder steel deck according to EN1991‐1‐5.
In practice, the most important component of the non‐uniform temperature variation is the linear component ∆TM. Reference values of the linear temperature difference component for different types of bridge decks – steel, composite and concrete decks – are given in the Table 3.2, based on upper bound values of the linear temperatures for representative samples of bridge geometries. In this table, ∆TM represents the characteristic value of temperature difference between the top and bottom surface of the deck.
Table 3.2 Recommended values of linear temperature difference component for different types of bridge decks for road, foot and railway bridges, in EC1‐1‐5.
| Top warmer than bottom | Bottom warmer than top | |
| Type of deck | ∆TM,heat (°C) | ∆TM,cool (°C) |
| Type 1: Steel deck | 18 | 13 |
| Type 2: Composite deck | 15 | 18 |
| Type 3: Concrete deck: Concrete box girder Concrete beam Concrete slab |
10 15 15 |
5 8 8 |
These values are based on depth of surfacing of 50 mm for road and railway bridges. For other depths of surfacing, these values should be multiplied by the factor ksurf as proposed in EC1‐1‐5 [28]. For example, for the case of a concrete box girder roadway bridge with a surface thickness of 75 mm the linear temperature difference is 8.5°C (= 0.85 × 10°C) for the top warmer than the bottom, and 5°C (= 1.0 × 5°C) for the bottom warmer than the top.
It is sometimes necessary to consider horizontal temperature gradients, for example, taking into consideration possible action effects due to different temperatures between the webs of a box girder deck or between opposite outer faces of concrete piers. If no other information is available, a linear temperature difference of 5°C between the outer edges of the bridge independently of the width of the bridge, or between the outer faces of concrete piers, is recommended.
Differences in the uniform temperature components between different main structural elements may have to be considered, for example, between the stay cables and the deck of a cable‐stayed bridge with values in the order of ±15°C.
3.14 Shrinkage, Creep and Relaxation in Concrete Bridges
Shrinkage and creep effects may be considered in the design of concrete and composite bridges, namely according to EC2‐1 [29], CEB‐FIP Model Code 90 [30] or fib Model Code 2010 [31]. Using this last code, the total shrinkage strain of concrete between the age t, in days, and the age ts at the beginning of drying, is given by:
where εcbs0 and εcds0 represent, respectively, the basic and drying shrinkage occurring in the long term. The basic shrinkage takes place at concrete young ages as the time function βbs(t) converges to 1 in the first year, that is, usually during bridge construction.
Therefore, it is the drying shrinkage that really influences the bridge behaviour, and this depends on the mean concrete compressive strength, the type of cement and the ambient relative humidity. The function βds(t − ts) represents the time development of drying shrinkage ranging between 0 and 1, and is a function of (t − ts) and of h0 = 2Ac/u – the notional size of the member in mm (dependent on the area Ac of the cross section and the perimeter u of the member in contact with the atmosphere). All these functions and coefficients are defined by mathematical expressions in the codes. The shrinkage strain at long term (εcds0) ranges usually between −10 × 10−5 and −40 × 10−5 (as shown in Figure 3.47 for a typical twin girder concrete bridge deck), that is equivalent to a temperature reduction of −10 to −40°C.
![Graph of εcds[×10−5] vs. t [days] displaying 3 ascending curves for ho = 0.34 m for slab (short dashed), ho = 0.43 m for deck (solid), and ho = 0.74 m for girder (long dashed), with schematic of a concrete deck (inset).](http://images-20200215.ebookreading.net/1/2/2/9780470843635/9780470843635__bridge-design__9780470843635__images__c03f047.gif)
Figure 3.47 Evolution of free shrinkage in a concrete deck for the slab and for the girder independently, as a function of time t after casting, and the equivalent shrinkage at the centre of the gravity of the composed section.
However, in practice, a considerable difference is frequently observed between measured and calculated values; in particular, concerning the time development of shrinkage. In fact, shrinkage development may be two to three times quicker, even if εcds0 in the long term is not far from that predicted. This is likely to be due to the particular type of additives adopted in prestressed concrete bridge construction to allow rapid concrete hardening for stressing prestressing cables. For segmental bridges built by the cast in place cantilever method, the prestressing cables are very often stressed after 36–48 hours of concreting the segment.
The effect of shrinkage in concrete bridges is twofold – at the level of the structure and at the level of the cross sections. The former is illustrated in Figure 3.48 by the bending moments induced in the piers by the shrinkage of the deck in a concrete viaduct, as well as by the axial forces in the deck, which is subjected to bending moments as well if the eccentricity of the tensile forces introduced by the bearings is considered. The shrinkage effects at cross sections is exemplified by the case of a beam‐slab bridge deck of Figure 3.47, where the differential shrinkage between the slab and the girders – the uniform shrinkage is higher for the slab than for the girders if considered as independent –due to h0 or if the slab is not cast in a single stage with the girders. Normal stresses at the cross sections are induced by differential shrinkage effects. These stresses may be evaluated by the same method – the principle of superposition, explained in Section 3.11.2 for the effect of non‐linear temperature distribution. Hence, first one restraints the uniform shrinkage at the level of the slab and at the girder – the stresses at the restraints end sections are shown in Figure 3.49a – then, the resultant force and moment at the level of the cross section are evaluated. These stress resultants are then eliminated by applying N1 = −N0 and M1 = −M0 at the end sections, and the two stress states are added (Figure 3.49b) to obtain the self‐equilibrated stresses due to differential shrinkage between the slab and the girders (Figure 3.49c).

Figure 3.48 Self equilibrated elastic stresses due to differential shrinkage effects between the slab and the girders in the deck of Figure 3.47.
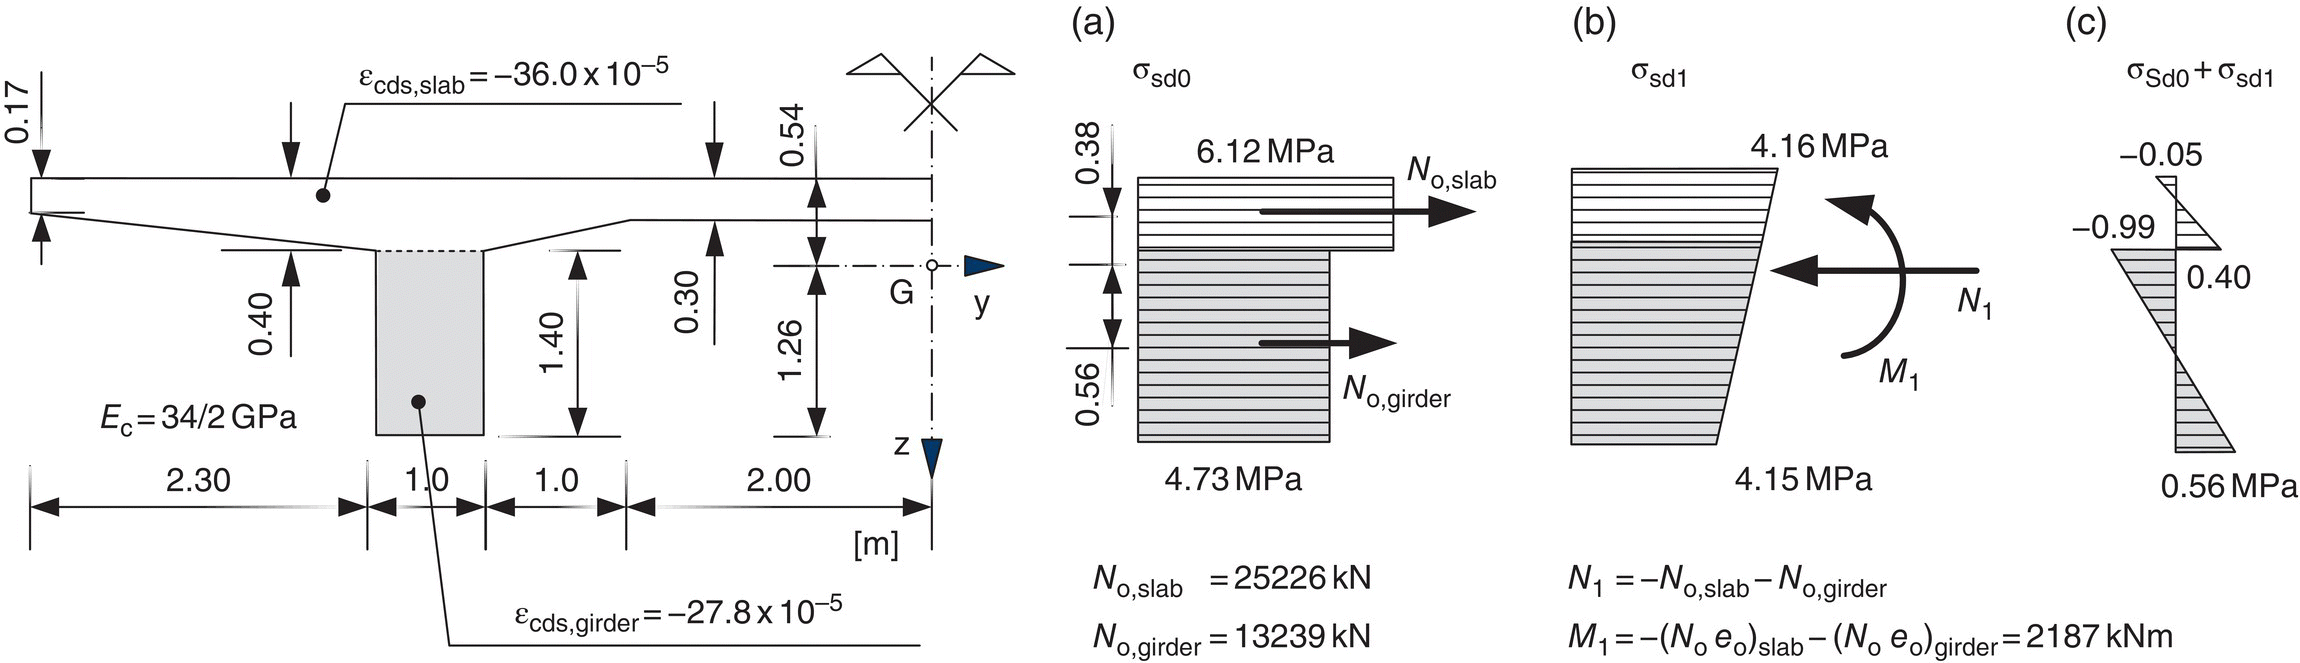
Figure 3.49 Induced bending moments in piers and deck in a concrete bridge frame structure due to uniform shrinkage of the deck and effect of relaxation of concrete stresses in the piers.
A similar example of differential shrinkage may be given for a composite bridge deck where the free uniform shrinkage is restricted to the slab, which, however, induces (bending + axial) stresses in the girders as shown in Figure 3.50. In bridge decks where precasted girders are adopted, the effect of differential shrinkage between the slab and the girders also induces a state of normal stresses that should be considered at the SLS.

Figure 3.50 Normal elastic stresses induced in a composite bridge deck due to differential shrinkage between the concrete slab and the steel girders.
In reinforced concrete sections with a symmetric distribution of steel reinforcement, the effect of shrinkage in the concrete induces compressive stresses in the steel and tensile stresses within it. If the steel reinforcement is not symmetrically distributed, the concrete shrinkage induces a curvature at the cross section that may be expressed as [26]
where d is the effective depth of the concrete section and ks is a nondimensional coefficient depending on the geometrical characteristics of the cross section of the areas of concrete and steel reinforcement and on the ratio n between the modulus of elasticity of steel reinforcement and concrete n = Es/Ec. For cracked sections, the extension of Eq. (3.61) and diagrams for the evaluation of curvature due to shrinkage are available [26].
The structural overall effects or the cross sections effects of shrinkage of concrete cannot be separated from the creep effect. Basically, creep represents the increase in strains under sustained constant applied stress as illustrated in Figure 3.51. The creep function ϕ(t,t0) is defined from the strains ε(t,t0) at time t0 due to a constant applied stress σ0 at time t0
The creep function is usually defined from the creep coefficient φ(t,t0) by
where Ec0 and Ec28 represent the modulus of elasticity of concrete at the age of loading t0 and at 28 days. The creep coefficient φ(t,t0), defining creep between time instants t0 and t, is evaluated from
where φ0 is the notional creep coefficient and βc(t − ts) is a function describing the development of creep with time after loading. These coefficients depend on the class of concrete and type of cement, the relative humidity, on the notional size of member h0, and other parameters as defined in [26, 29, 30]. Figure 3.52 shows the evolution of the creep function with time for the deck cross section of Figure 3.47 after casting based on the creep parameters as per [29].

Figure 3.51 Creep deformations and definition of creep function Φ(t,t0).

Figure 3.52 Creep function for the concrete deck of Figure 3.47.
Let the case of imposed deformations, such as thermal strains or foundation settlements, be considered. These may be interpreted from an imposed strain at a certain time instant or along a certain time interval. Hence, let a strain ε0 be applied at time t0 and kept constant along time t, as shown in Figure 3.53. The induced stress σ0 at time t0, which is dependent on the instantaneous modulus of elasticity E0 at time t0, is reduced with time due to the relaxation effect; in some way an inverse of the creep effect. The relaxation function is defined as
where r(t,t0) is the relaxation function of concrete, representing the variation of stress due to an applied ‘unit’ strain at time t0. This function may be determined from the creep function as is shown in the sequel.

Figure 3.53 Stress relaxation in concrete and definition of the relaxation function r(t,t0).
Up to now, we have been considering the cases of creep or relaxation under constant stress or strain, respectively. In practice, one has to consider the cases of variable applied stress or variable imposed strain. The principle of superposition of viscoelastic effects, by Boltzmann, is used as illustrated in Figure 3.54 for creep effects. The stress at time t due to a series of increments of stresses ∆σi, applied from t0 to t, is given by

Figure 3.54 Superposition of viscoelastic effects – time dependent deformations, due to stress increments Δσ applied at different time instants τ.
Mathematically, the stress ‘history’ may be defined as a continuous function σ(τ) where τ denotes the time variable. So, to pass from the discrete case to the continuous one, one replaces Σφi(t, τi) in (3.66) by an integral ![]() and ∆σi by dσ = (∂σ/∂τ) dτ, yielding
and ∆σi by dσ = (∂σ/∂τ) dτ, yielding

A similar equation may be written for the case of relaxation, as illustrated in Figure 3.55,

The relaxation function, taking into consideration the fact it represents the stress developed at time t due to a unit strain applied at time t0, may be determined, knowing the creep function, by solving the integral Eq. (3.68) for σ(t) after setting ε(t) in (3.67) as a unit function.

Figure 3.55 Superposition of relaxation effects.
A method of viscoelastic analysis, from Trost and Bazant [26], consists of rewriting Eq. (3.67) in the form
where ∆σ = σ (t) − σ (t0) is the total variation of stress between t0 and t, and Ec* and Ec** are, respectively, the so called effective modulus and adjusted effective modulus given by
where χ is the ageing coefficient defined next. It may be shown, under certain simplified assumptions [26], that the ageing coefficient is independent on the history of stress and may be written in terms of the relaxation function r(t,t0) by
The functions φ(t, t0) and χ(t, t0) for practical applications are calculated and plotted graphically [26] for different values of the creep coefficient and of the notional size of the section h0.
Equation (3.69) is written in Ref. [26], including a term εn(t) independent of the stress and denoting an imposed deformation like the shrinkage or a thermal strain, as
In current cases the ageing coefficient χ may be taken as 0.8, at least for cases of pure relaxation and in cases where only long‐term effects are considered. Besides, if the stresses in concrete only vary slightly one obtains from Eq. (3.73), neglecting the second term correspondent to the stress variation, and introducing the concept of effective modulus of elasticity (Ec,eff),
Equation (3.69) may be adopted to understand the effect of creep on stresses developed due to shrinkage effects. For that case σ(t0) = 0 and therefore the stress developed at the instant, t, σ(t) = Δσ is given by,
Equation (3.61) may be shown [26] to include the effect of creep on curvatures developed due to shrinkage. In this case, the coefficient kc is dependent on χ φ. The reader is referred to Refs. [26, 29, 30] for additional information on creep and shrinkage effects in concrete structures.
3.15 Actions Due to Imposed Deformations. Differential Settlements
Let's take the case of the prestressed concrete bridge represented in Figure 3.48. Due to the shortening of the deck induced by shrinkage, elastic and creep deformations due to prestressing, also due to negative temperature variations, the top of the piers experience imposed horizontal displacements, dependent on time t, that is,u = u(t), and bending moments develop along the pier shaft. If one assumes a pier of constant cross section, with a bending stiffness EI << (EI)deck, the maximum induced elastic bending moment at the base section is given by
If the displacement had been imposed with its final value u and kept constant along the time, the stresses σ0 at time t0 at the base section, are (as per Section 3.13) reduced proportionally to the relaxation function r(t, t0). Since the bending moments are

Hence, the elastic bending moments are then reduced proportionally to the relaxation function. The same conclusion holds for the bending moments induced in the deck due to differential settlements of the pier foundations, as illustrated in Figure 3.56. However, in both problems the displacement u or the settlement Δ does not occur immediately with its final value but the tendency is for the final values to increase continuously with time t from 0 at age t0, to its final value Δ at age t1. The superposition principle of viscoelastic effects and the concept of ageing coefficient previously introduced allow a solution for this problem as presented in [26]. The values at t1 and at subsequent time t2 of the action effects (reaction, bending moment etc.) due to support movements may be determined from the following equations
where te is a time instant determined by solving the following equation
The effective time te represents the instant such that, if a stress increment is introduced at that instant and kept constant up to t1, it produces the same deformation of a gradually introduced stress increment introduced from zero at t0 to the final value at t1.

Figure 3.56 Bending moments induced in a bridge deck due to settlements of a pier foundation.
Figure 3.57 presents an example of the variation of the bending moment at support in a continuous bridge deck due to a sudden or a gradually introduced foundation settlement [32]. As may be concluded from the figure, the maximum bending moment if the settlement is introduced gradually is not more than 50% of the correspondent value if introduced suddenly with the final value. Of course this percentage tends to decrease with time corresponding to period of settlement. Another relevant aspect is the effect of cracking in reducing the elastic effects introduced in concrete structures due to imposed deformations.

Figure 3.57 Effects of sudden or gradually pier foundation settlements in bending moments in a bridge deck
(Source: Adapted from Ref. [32], with permission from IABSE).
A simplified approach to the effect of imposed gradually deformations in concrete‐bridge thermal strains or foundation settlements, consists of considering the values obtained from an elastic analysis replacing the elastic modulus of concrete by the reduced modulus of elasticity. Imposed deformation effects may be considered, according to some codes and recommendations, with its elastic values divided by 2, that is, with Ec,eff = Ec/2.
3.16 Actions Due to Friction in Bridge Bearings
The loads transferred from the superstructure to piers and abutments by bearings, induce friction forces dependent on the type of bearing namely, a roller bearing or a sliding bearing; see Figure 3.58. The former are usually metal bearings while the latter are elastomeric bearings nowadays (‘neoprene bearings’) with a sliding thin layer of a low friction material like polytetrafluorethylene (PTFE). These bearings are designated in practice as ‘neoprene‐teflon bearings’ as will be discussed in Chapter 7.

Figure 3.58 Friction in bridge bearings.
The friction forces developed at the bearings should be quantified from the vertical force reactions V, by the well‐known friction law H = μ V, where μ is the friction coefficient. For PTFE sliding bearings, a design value of 5% (i.e. μ = 0.05) may be adopted.
3.17 Seismic Actions
3.17.1 Basis of Design
The design of bridges in seismic zones, such as in southern European countries, requires earthquake actions to be taken into consideration at concept, analysis and details of a design. At the concept stage, one aims to achieve a structure with a reliable response under seismic actions. During analysis, by modelling the seismic actions by static equivalent forces (acceptable for simple and small bridges) or by a dynamic analysis based on response spectrums, power spectrums or by a time history analysis [8]. In the detail design stage, by considering structural elements and connections with sufficient resistance and ductility under seismic actions.
It is understood bridges generally behave well for earthquakes of moderate intensity, say up to a magnitude in the order of five to six. For earthquakes with a higher magnitude, the following types of damage have occurred in several cases:
- collapse of the foundations by soil liquefaction under seismic actions
- damage in abutments
- falling of superstructure elements
- structural damage in piers or, less frequently, in the deck
Damages in abutments are generally caused by dynamic overpressures of the adjacent soil or due to forces induced by the deck. Falling of deck elements is usually due to characteristics of bridge bearings not being compatible with the order of magnitude of the horizontal displacements induced by the earthquake. Finally, damages in bridge piers are usually due to lack of ductility of these structural elements.
For current bridges, it is sufficient to consider the seismic action in horizontal directions; the vertical component should be considered in a few structures. That is the case for structures with vertical vibration modes associated to natural frequencies less than 1 Hz. In these cases, if seismic action is considered by response spectrums, the ordinates of the response spectrum correspondent to the vertical component may be considered to be two‐thirds of the ordinates of horizontal components. The simplified methods of seismic analysis, based on static equivalent forces, are currently limited to bridges with vertical piers, bridges with a straight or almost straight in plan alignment or slightly skew bridges.
Besides, the span lengths should not be significantly different and should be approximately symmetrical with respect to a vertical plan perpendicular to the axis of the bridge. Static equivalent seismic analyses are not applicable to curved bridges, frame bridges with inclined piers, arch bridges, cable‐stayed bridges and suspension bridges.
In the static equivalent seismic force method, actions may be considered separately in two horizontal directions, one along the longitudinal axis and the other perpendicular to the bridge axis. The equivalent static forces are obtained by multiplying the permanent loads of the bridge by a seismic coefficient β, currently with values between 0.02 and 0.3. This coefficient depends on the seismicity of the bridge site, namely on the peak rock acceleration, the type of soils at the foundations, the natural frequencies of the bridge (in particular, the fundamental natural frequency) and the behaviour coefficient to be adopted.
For simple bridges, the longitudinal seismic action in the deck may be simulated by a horizontal force applied at the deck with a value βG, where G represents the permanent load of the deck. This may be done because the longitudinal mode of vibration of the bridge may be modelled by a single degree of freedom system, represented by the deck translation.
However, for the transverse direction, one must take into consideration the transverse mode of vibration and a discrete model is adopted with concentrated masses (mi) localized at the most flexible parts of the structure.
The static equivalent force distribution, which is close from the inertia force distribution associated to the fundamental mode of vibration, may be obtained by evaluating the deformed configuration of the structure under the action of forces β Gi proportional to the permanent loads and acting along the direction under consideration.
The discrete model of the deck is as shown in Figure 3.59 and the effective acceleration of a mass m for a SDF system is aef = (2πf)2 u, where u(t) is the time dependent displacement and f the fundamental frequency. The associated inertia force is F = m aef = (2πf)2 m u.

Figure 3.59 Transverse horizontal forces due to seismic actions induced in a bridge deck as a function of masses in a discrete deck model.
For a MDOF system with masses mi, the characteristic value of the static equivalent forces are
where di are the displacements due to the loads Gi acting simultaneously in the direction where the seismic action is being considered and g the acceleration of gravity. In loads Gi, one includes the permanent loads as well as the quasi‐permanent values of the variable loads correspondent to the masses mi.
Longitudinal and transverse behaviour should be analysed, due to different influences of the support conditions of the superstructure. Another aspect of seismic actions refers to the hydrodynamic forces induced by water surrounding piers. This is a complex solid–fluid interaction problem, but the simplest model consists of considering a mass of a cylinder of water, which vibrates with the pier.
When response spectrums or power spectrums need to be considered for the seismic analysis of bridges, a modal analysis is considered. The reader is referred to the specific literature [8, 33, 34] for these methods of seismic analysis. Design codes such as the Part 2 of Eurocode 8 (denoted as EC8‐2 [35]) establish the basis for seismic analysis of bridges.
3.17.2 Response Spectrums for Bridge Seismic Analysis
The most adopted method for seismic analysis of bridges is the Response Spectrum Method. The basis of the method is outlined here. A SDF system may be considered, for example, for a bridge with a three span continuous deck supported by two flexible piers and with longitudinal sliding bearings at the abutments. The deck under seismic longitudinal actions is assumed to be rigid and hence the structure can be modelled by a SDOF system (Figure 3.60). Under a seismic action defined by the ground motion record in terms of accelerations, ![]() ‐acting accelerograms, and the relative displacements of the mass M with respect to the foundation level is u. Hence the dynamic equation of motion (3.13) for P = 0 but with the inertia term
‐acting accelerograms, and the relative displacements of the mass M with respect to the foundation level is u. Hence the dynamic equation of motion (3.13) for P = 0 but with the inertia term ![]() replaced by
replaced by ![]() is written as
is written as

Figure 3.60 Seismic actions induced in a bridge: (a) longitudinal modelling by SDOF and (b) transverse modelling by MDOF.
Taking into consideration, C = 2 Mω ξ and k = Mω2 where ω = 2πf, (3.82) is rewritten as
This differential equation may be solved for a certain ground motion record ![]() to find the displacements u = u(t) of the mass M. The value of peak response (maximum displacement) of the SDOF defined by its frequency f and damping coefficient ξ defines the response spectrum of displacements Sd (f, ξ). Solving for different frequencies f, a diagram (Sd = Sd (f) or in terms of the period T = 1/f, (Sd = Sd (T)) can be plotted for the response spectrum for different damping ratios ξ. The response spectrums are defined in codes (EC8‐1, e.g. Figure 3.61) for different geotechnical conditions and zones usually associated to peak ground accelerations
to find the displacements u = u(t) of the mass M. The value of peak response (maximum displacement) of the SDOF defined by its frequency f and damping coefficient ξ defines the response spectrum of displacements Sd (f, ξ). Solving for different frequencies f, a diagram (Sd = Sd (f) or in terms of the period T = 1/f, (Sd = Sd (T)) can be plotted for the response spectrum for different damping ratios ξ. The response spectrums are defined in codes (EC8‐1, e.g. Figure 3.61) for different geotechnical conditions and zones usually associated to peak ground accelerations
![]() at the bridge site.
at the bridge site.

Figure 3.61 Typical Elastic Response Spectrum Se in EC8 – TB,TC,TD in (s) depending on geotechnical ground conditions; ag is the peak ground acceleration at the bridge site and η is the damping correction factor (η = 1.0 for ξ = 5% viscous damping ratio).
If the maximum displacement of the mass M is designated by Sd (f, ξ), the SDOF system is subjected to a maximum force
The term Sa (T, ξ) = (4 π2/T 2) Sd is the acceleration spectrum of the mass; for T = 0, that is, a system with infinite frequency (totally rigid system) like a rigid mass supported directly on the rock, Sa is the peak ground acceleration of the mass M. Figure 3.61 shows different response spectra in terms of damping ratios.
For a Multi Degree of Freedom System (MDFS), a modal analysis [8, 35] has to be carried out and Eq. (3.83) is generalized for each normalized modal coordinate Ui = 1, with i = 1 to n, as
where ![]() is the participation factor [8, 35] of mode i in the response, for a specific direction of ground motion, depending on the mode shape and mass distribution. Denoting the modal displacement j in the mode i by φij, one has
is the participation factor [8, 35] of mode i in the response, for a specific direction of ground motion, depending on the mode shape and mass distribution. Denoting the modal displacement j in the mode i by φij, one has

The effective masses in mode i are defined as

A multi degree spectrum analysis is carried out for the complete seismic analysis of the structure. By defining the spectral acceleration for each mode i as Sa (Ti, ξi), the maximum elastic forces in mode i may be calculated by using the participation factors. The simplest approach to obtaining a 2D bridge structure modelled as n lumped masses (Figure 3.59 or the bridge structure in Figure 3.60 under a horizontal seismic action transverse to the plane of the structure), the maximum base shear due to mode i is obtained from the response spectrum and generalized masses, as Fmax, i = Meff, iSa (T, ξ). However, total response cannot be obtained by adding maximum force values at each mode, because these maximum values do not occur at the same time. The simplest and most adopted combination rule to obtain maximum values is the square root of the sum of the squares of the modal responses. The reader is referred to [8, 35] for developments on the subject.
A final remark is made concerning the use of response spectrums as defined. These are elastic response spectrums that should be modified by ductility/behaviour factors to take into consideration the nonlinear behaviours of the bridge structure during an earthquake. The nonlinear behaviours are associated to cracking or yielding reducing the stiffness and modifying the effective vibration frequencies of the bridge structure. The spectrum accelerations are then modified and this nonlinear effect is usually considered by reducing the elastic forces calculated on the basis of the elastic spectrums or reducing directly the spectrum by the behaviour factor. In bridge structures these behaviour factors q depend on piers and abutments ductility, and are in the order of 1.5–2.5, yielding a considerable reduction in the force values obtained from the elastic spectrums. Indicative values can be found in EC 8‐2 [35]. However, inaccessible parts of the bridge, like foundations, and bearing design in general, total elastic forces are usually required by the codes. The reader is referred to [34–37] for further developments.
3.18 Accidental Actions
Accidental actions were already referred to in Section 3.1. The impact on bridge piers due to vehicles collision is the most current case. Ship impact, for bridges with piers near navigation channels, is another example of an accidental action. Mitigation measures for ship impact are currently adopted by designing ship impact defences. A variety of accidental actions are quantified by nominal values in Part 1‐7 of Eurocode 1 [38].
3.19 Actions During Construction
During bridge construction the evolution of the static system should be considered in conjunction with specific actions due to construction equipment, like formwork launching girders or moving scaffoldings. These actions are referred in next chapter, for execution and construction methods for concrete and steel bridge decks. Construction live loads and accidental actions should also be considered when checking the bridge safety during erection stages. The reader is referred to specific literature on the subject [39, 40].
3.20 Basic Criteria for Bridge Design
A bridge must be designed to attain its functional objectives; resisting permanent, variable and accidental actions during its life span with minimum maintenance costs. Three types of design situation should be considered for checking the safety of the structure; namely,
- persistent, correspondent to normal functional conditions during its life span;
- transitory, correspondent to the execution period or time for repairing or strengthening the structure, that may be taken as having a time duration of one year;
- accidental, which may be considered to be instantaneous situations.
As referred to in Section 3.1, bridges should be designed to warranty safety at the ULS and an acceptable behaviour at SLS. The former (ULS) are associated to loss of static equilibrium, rupture and fatigue, while the last (SLS) are associated to excessive deformations, vibrations and crack width limitations in concrete and composite bridges. In prestressed concrete bridges, a SLS is defined when attaining a zero compressive stress in the concrete for certain duration of the SLS, as referred in Section 3.1 for the characteristic (rare), frequent, or quasi‐permanent load combinations. In steel and composite bridges, one should consider at SLS the localized plastic deformations, which may induce damage and irreversible deformations, as well as the SLS, associated with the slip resistance of prestressed bolted connections. The basic expressions for load combinations for ULS and SLS were presented in Section 3.1.
Design criteria for prestressed concrete decks, steel or composite decks will be developed in Chapter 6, after introducing the concept design and execution methods in Chapter 4.
References
- 1 EN 1992‐2 (2005). Eurocode 2 – Design of Concrete Structures – Part 2: Concrete Bridges – Design and Detailing Rules. Brussels: CEN.
- 2 EN 1993‐2 (2006). Eurocode 3 – Design of Steel Structures – Part 2: Steel Bridges. Brussels: CEN.
- 3 EN 1994‐2 (2005). Eurocode 4 – Design of Composite Steel and Concrete Structures – Part 2: General Rules and Rules for Bridges. Brussels: CEN.
- 4 EN 1990 (2002). Eurocode – Basis of Structural Design, and Amendment A1 (2005) Annex A2 – Application for Bridges. Brussels: CEN.
- 5 EN 1991‐2 (2005). Eurocode 1: Actions on Structures – Part 2: Traffic Loads on Bridges. Brussels: CEN.
- 6 EN 1991‐1‐1 (2002). Eurocode 1 – Actions on Structures – Part 1–1: General Actions Densities, Self‐Weight, Imposed Loads for Buildings. Brussels: CEN.
- 7 TR 1317‐6 (2012). Technical Report – Road Restraint Systems – Part 6: Pedestrian Restraint System – Pedestrian Parapets. Brussels: CEN.
- 8 Clough, R.W. and Penzien, J. (1993). Dynamics of Structures. New York: McGraw Hill.
- 9 Irvine, H.M. ed. (1986). Structural Dynamics for the Practicing Engineer. London and New York: E&FN Spon.
- 10 Frýba, L. (1996). Dynamics of Railway Bridges. London: Thomas Telford.
- 11 Goicolea, J. M. (2007). Dynamic behaviour of high speed railway bridges; Research at Escuela de Caminos, UPM. Seminar at Instituto Superior Técnico. Lisbon, 6 November 2007.
- 12 Frýba, L. (1999). Vibration of Solids and Structures under Moving Loads. London: Thomas Telford.
- 13 Frýba, L. (2001). A rough assessment of railway bridges for high speed trains. Engineering Structures 23: 548–556.
- 14 Menn, C. (1990). Prestressed Concrete Bridges, 536. Springer.
- 15 EN 1991‐1‐4 (2005). Eurocode 1: Actions on Structures – Part 1–4: General Actions – Wind Actions. Brussels: CEN.
- 16 Branco, F., Mendes, P. and Ferreira, J. (1997). Ensaios em Túnel de Vento do Tabuleiro do Viaduto sobre o Caminho do Comboio – Report IC‐IST, EP N°10/97 (in Portuguese).
- 17 Dyrbye, C. and Hansen, S.O. (1997). Wind Loads on Structures. New York: Wiley.
- 18 Jurado, J.A., Hernández, S., Nieto, F., and Mosquera, A. (2011). Bridge Aeroelasticity. Sensitivity Analysis and Optimal Design. WIT Press.
- 19 CECM (1987) Recommandation pour le calcul des effets du vent sur les construction. CECM (Convention Européenne de la Construction Métallique), N°52, 2nd edn.
- 20 Svensson, H. (2012). Cable‐Stayed Bridges – 40 Years of Experience, 430. Germany: Wilhelm Ernst & Sohn.
- 21 ICE (1981). Bridge Aerodynamics. London: Thomas Telford Limited.
- 22 Ziegler, H. (2013). Principles of Structural Stability, vol. 35. Birkhäuser.
- 23 Cremona, C. and Foucriat, J.C. (2002). Comportement au vent des Ponts. Presses des Ponts et Chaussées, AGFC.
- 24 Mendes, P., Reis, A. J. and Branco, F. (1988). Acções Térmicas Diferenciais em Tabuleiros de Pontes em Laje: Caracterização da Situação Portuguesa. Revista Portuguesa de Engenharia de Estruturas n. 28 – 1ª Série, pp. 23–30 (in Portuguese).
- 25 Scanlan, R.H. and Tomko, J.J. (1971). Airfoil and bridge deck flutter derivatives. Journal of the Engineering Mechanics Division 97 (EM6): 1717–1737.
- 26 Ghali, A., Favre, R., and Elbadry, M. (2002). Concrete Structures: Stresses and Deformations, 3e. London and New York: E&FN Spon.
- 27 SAP2000® v18 (2016). Integrated software for structural analysis and design. Available online at https://www.csiamerica.com/products/sap2000 (accessed July 2018).
- 28 EN 1991‐1‐5 (2003). Eurocode 1: Actions on Structures – Part 1‐5: General Actions – Thermal Actions. Brussels: CEN.
- 29 EN 1992‐1‐1 (2004). Eurocode 2 – Design of Concrete Structures – Part 1‐1: General Rules and Rules for Buildings. Brussels: CEN.
- 30 CEB‐FIP (1991). Model Code 1990, Design Code. Comité Euro‐International du Béton, Paris.
- 31 fib (2013). Model Code for Concrete Structures 2010. Wilhelm Ernst & Sohn.
- 32 Schlaich, J. and Scheef, H. (1982). Structural Engineering Documents SED 1: Concrete box‐girder bridges. IABSE, International Association for Bridge and Structural Engineering, Zurich, Switzerland.
- 33 SETRA (2012). Ponts en zone sismique – Conception et dimensionnement selon l'Eurocode 8 – Guide méthodologique.
- 34 SETRA (2000). Ponts Courants en Zone Sismique. Guide de Conception.
- 35 EN 1998‐2 (2005). Eurocode 8 – Design of Structures for Earthquake Resistance – Part 2: Bridges. Brussels: CEN.
- 36 Maguire, J.R. and Wyatt, T.A. (1999). ICE Design and Practice Guide – Dynamics: An Introduction for Civil and Structural Engineers. Thomas Telford.
- 37 EN 1998‐1 (2004). Eurocode 8 – Design of Structures for Earthquake Resistance – Part 1: General Rules, Seismic Actions and Rules for Buildings. Brussels: CEN.
- 38 EN 1991‐1‐7 (2006). Eurocode 1: Actions on Structures – Part 1–7: General Actions – Accidental Actions. Brussels: CEN.
- 39 EN 1991‐1‐6 (2005). Eurocode 1: Actions on Structures – Part 1–6: General Actions – Actions during Execution. Brussels: CEN.
- 40 Calgaro, J. A. (2000). Projet et construction des ponts – Généralités, Fondations, Appuis et Ouvrages courants. Presse des Ponts et Chaussées, Paris.