The topic of this chapter is tools to support the strategic aspects of program management. To be clear, it is not the program manager who develops and owns the strategic tools. The strategic tools are owned by senior managers who use them to supervise and manage programs at the strategic level. Why, then, do we bother to discuss these tools in the section of the book dealing with management of a single program, a level that is not the purview of senior management but of program managers? The significance of these tools is that program managers need to comprehend the information obtained from the tools to communicate with senior managers about their programs from a strategic perspective.
The conventional wisdom holds that tools are enabling devices to reach an objective or, more specifically, a deliverable. Like any other tool, strategic program management tools include procedures and techniques by which a deliverable is produced. Their core—either of a qualitative or quantitative nature—is in their systematic procedure.
We explain the following strategic program management tools in this chapter:
business case
alignment matrix
portfolio maps
road map
complexity assessment
The purpose of this chapter is to help practicing and prospective program managers achieve the following objectives:
Learn how major strategic program management tools are developed and utilized to increase program efficiency and effectiveness.
Be able to describe how strategic program management tools are selected to match the program situation.
Mastering the information contained in the tool description is essential for program managers. The information can help program managers understand how the company's senior management utilizes these tools to execute the organization's business strategy, program portfolio, and senior management-owned program decisions. This will enable program managers to comprehend the nature and position of their program in the context of all programs and of the company's business strategy.
For a user-friendly presentation of the tools, we designed the chapter in a way that enables maximum understanding of the development and utilization of each tool. Presentation of each tool will be segmented into sections that discuss the following:
Description of the tool: A brief description of the characteristics of the tool and how it is used by the firm.
Developing the tool: Steps that are involved in constructing or developing the tool are detailed in this section. They are made up of a series of substeps that describe specific activities.
Utilizing the tool: Multiple elements are involved in this section. The section called When to Use explains situations in which the tool can be applied. How much time is needed when utilizing the tool is described in Time to Prepare. The Benefits element specifies what value the tool creates for the user. By contrast, the Advantages and Disadvantages element generally concentrates on the simplicity/complexity and ease-of-use issues of the tool.
Summary and highlights of the tool: At the end of each tool section, a summary reminds the reader of the purpose, use, and benefits of the tool—offering highlights for appropriately using or structuring it.
At the end of the chapter, we offer a brief set of situations in which the strategic program management tools are used.
The program business case is a start-up document used by senior management to assess the feasibility of a program from multiple business perspectives. It establishes the program vision by describing a business opportunity in terms of alignment to strategy, market or customer needs, technology capability, and economic feasibility. It also provides a balanced view of business opportunity versus business risk. The program business case is used for the following purposes:
Gaining agreement on program scope and business success criteria.
Obtaining approval of funding and resource allocation for program planning and implementation.
Evaluating a program against others in the portfolio of programs.
Obtaining approval to proceed from the define phase to the planning phase of the PLC.
The program business case consists of the following five major elements: (1) Description of the business opportunity and product, service, or infrastructure concept; (2) program alignment to strategic, market, and technology goals; (3) business success criteria; (4) cost versus benefit analysis; and (5) risk analysis.
Step 1: Prepare information inputs: The business case for a program must be correct based upon the knowledge available at the time it is created, unbiased and clear. This requires quality information about the following:
The business environment
Customer requirements
The business strategy
Technology road map
Program targets
The business environment and customer requirements information is necessary to build the foundation of the business case. Understanding the needs of the customer, as well as the state of the environment within which the business operates, is needed to position and differentiate the product, service, or infrastructure capability being proposed. The business strategy specifies the strategic objectives that the organization is striving to achieve. The technology road map shows both internal and external technologies that will be available for the proposed program. The program targets consist of high-level directives from senior management to gauge initial feasibility of a program to meet the business needs. These typically consist of cost, schedule, and primary feature or functionality targets.
Step 2: Describe the business opportunity and product, service, or infra- structure concept: There are two steps to this action. First, a description of the opportunity that the program will fulfill is provided, with a focus on business opportunities. Second, a description of the product, service, or infrastructure capability concept is documented, with focus on how the concept addresses the business opportunity that is presented.
Step 3: Define program alignment: The purpose of programs is to serve as basic building blocks for the execution of an organization's strategy.[111] The premise is that if programs are aligned with the firm's strategy, they will better support the objectives of that strategy. Since one tangible way to express the strategy is to define its specific, measurable, attainable, relevant, and time-based objectives, one can use the stated objectives to assess how well an individual program supports them. This step describes how the program aligns to and supports achievement of one or more strategic objectives of the organization. Additionally, a description of how the program result fulfills documented customer and market needs is included. Finally, a description of any new technologies that will be included in the product, service, or infrastructure capability being developed is provided in this step.
Step 4: Define the program success criteria: Identification of the critical success factors for a program should begin during the define phase of the PLC. The critical success factors ensure that the product, service, or infrastructure capability under development supports key business objectives such as profitability, time-to-money, productivity gains, and technology advancement.[112] This step forms the genesis of the program strike zone, which is described in detail in Chapter 11.
Step 5: Perform the cost versus benefit analysis: The heart of the program business case is the feasibility assessment that results from the cost versus benefit analysis of the program. The cost/benefit analysis should identify both tangible and intangible benefits with the benefits expressed in quantifiable terms such as dollars gained or saved, hours saved, and gross margin increase. The cost versus benefit analysis should answer the following questions:
How much will this program cost to implement?
How much will this program contribute to the company bottom line?
Is the program worth investing in terms of achievement of specific business objectives?
Step 6: Analyze program risk: In this final step, all potential risk events that may affect the business success of the program are identified. At this stage of the program, it is a high-level look at the known risks. The risk events are then analyzed, and a plan to minimize the impact and probability of occurrence for the high-level risks is developed. The risk analysis should answer the following questions:
What is the probability of success for this program?
What will be done to maximize the probability of success?
How will the known risks be avoided or mitigated?
Does the level of risk prevent investment in the program?
The program business case is developed in the define phase of the PLC. Presentation of the business case to senior management stakeholders normally signifies the end of the define phase. The program business case, along with the market or customer requirements document, forms the basis on which the program plan is developed. The business case is updated as needed and reviewed as part of the implementation plan approval meeting. Prior to entering the implementation phase, in which maximum resources are expended, the business case needs to be reviewed for validity. During program implementation, the business case needs to once again be reviewed prior to releasing funds for large expenditures, such as factory tooling. Finally, the business case information is used during the program retrospective to evaluate if the program was successful in achieving the business objectives intended.
The time to prepare a program business case varies greatly, depending upon the size and complexity of the program; the type of product, service, or infrastructure capability being developed; and the company's industry. Depending upon these variables, duration to prepare the business case can range from two weeks to several months. Having stated this, however, one of the greatest opportunities to reduce development cycle time is in this arena. The more efficient a company can become in collecting and analyzing the inputs needed to develop the business case, the more efficient it will become in preparing the business case for a program. Any time saved on the front end of a program is an opportunity for decreased time to money.
The benefits of creating a good business case for a program are many. The primary benefits are fourfold. First, the business case answers the following critical question: "How will this program help our company meet its business and strategic goals?". In that way it helps senior management of a firm make sound decisions when considering development investment options. Second, it establishes alignment between strategic goals and program execution based upon multiple business perspectives. Third, consistent use of the business case for all programs helps to make the portfolio management process more effective by enabling the evaluation of programs within the portfolio on a consistent set of criteria. Finally, it establishes the vision—or future state—to effectively plan, execute, and deliver the output of the program.
An advantage of the business case is that all crucial information for the program decision making is conveniently included the case. However, time necessary for preparation of the business case can be a real disadvantage. In particular, the preparation can be time consuming, if discipline is not applied to effectively collect the data inputs as well as effectively analyze the cost, benefit, and risk information. The opportunity for analysis paralysis is great, and when it happens, it consumes critical time-to-money advantage.
The program business case is a critical tool used to assess the feasibility of investing in a program based upon cost, benefit, and business risk factors. Once prepared, the program business case provides the vision to guide program planning and execution and becomes the means to align execution to business strategy.
The alignment matrix helps establish the degree to which the program is aligned with the organization's business strategy (see Figure 10.1). This is, of course, also balanced against the specific customer needs that the firm is attempting to meet. The first column of the matrix contains the list of the organization's business objectives that serve as criteria to align programs with the organization's strategy. Then, in each of the remaining columns, the degree of alignment of individual programs with each objective is assessed using a qualitative scale. As an outcome, a qualitative goal-by-goal alignment evaluation for each program is generated that may be used for different strategic purposes.
Step 1: Prepare information inputs: The assessment of a program's alignment with an organization's business strategy calls for quality information that typically comes from three inputs, as follows:
Approved business strategy
The portfolio of programs
Program business case (or preliminary business case information)
The approved business strategy provides a list of the organization's business objectives that the strategy is striving to accomplish. To assess the degree of alignment of individual programs to the strategic objectives, a list of current and future programs is needed. This information is typically found in program portfolio documents. Finally, to understand how well each program is aligned with the strategic objectives, the program business case is needed.
Step 2: Identify the organization's strategic objectives: Strategic objectives are defined by the organization's senior management—sometimes formally in strategic plans but other times informally. In either case, the objectives should be used for the alignment matrix assessment. Because each organization is a unique entity, the strategic objectives found in the alignment matrix will be unique as well. Additionally, as the strategic objectives of an organization are updated and modified, the objectives in the alignment matrix need to be updated accordingly.
Step 3: Identify the programs: There are two steps to this action. First, the names of the new and existing programs are entered into the columns of the alignment matrix (see Figure 10.1). As stated earlier, the list of the programs is normally part of the portfolio of programs documentation. If a formal portfolio of programs does not exist, an active program roster will suffice. Second, the program strategy and goals should be developed and documented to secure the information needed to assess alignment of programs to strategy.
Step 4: Define the alignment scale: Scales of course vary, and the choice of scale is specific to the organization. We believe that a simple, qualitative scale is completely adequate and provides the value we want from this matrix. An example of a simple qualitative scale is a three-level scale shown in Figure 10.1. The scale includes the following rankings: fully supports for the highest degree of alignment, partially supports for the medium-level alignment, and does not support for no alignment of the program with a specific goal.
Step 5: Assess the degree of alignment: Now is the time to use the adopted scale of assessment and assess each program's alignment with each organizational business objective. Typically, decision makers who do the assessment should use a workshop format, in which information from multiple perspectives is exchanged and the assessment decisions are shared and consensual.

Typically, the alignment matrix is prepared for the program portfolio reviews. At that time, program selection and risk balancing, the first two goals of the program portfolio process, are completed first. What remains to be done are "strategic buckets," the third portfolio goal, which aligns programs with strategic objectives of the organization.[113] Based on the alignment information obtained, by means of a tool like the alignment matrix, the preliminary selection and risk balancing of programs may be changed, which may provide better alignment of programs with the strategic objectives of the organization.
Filling in the basic information of the matrix takes very little time, usually only a few minutes. However, a team of decision makers, usually the senior managers owning the program portfolio process, may easily spend a few hours developing and agreeing upon the level of alignment data for the alignment matrix. The true value of this tool is in the discussion that it generates between senior managers; therefore, we recommend a workshop format to facilitate the discussion.
The alignment matrix enables an organization to refine the selection of the preliminary portfolio of programs by pointing to programs that are best aligned with the organization's business objectives.[114] Based on that, one can eliminate some programs that are not strategically aligned; one can also add new programs that are better aligned. That's the matrix value, which is strategically precious given how difficult it is to select the most valuable programs that are risk balanced and aligned with the strategic objectives of the organization.
Additionally, it forces the senior managers of an organization to develop and document the organization's strategic objectives. The alignment matrix aids the program manager in understanding how well his or her program supports the strategic objectives of the firm. This knowledge will be useful, for example, when a program manager requests additional resources from a less strategically aligned program.
The alignment matrix is visual and easy to read. However, it is not easy to compare the alignment of multiple programs across multiple objectives, in the absence of one alignment score. This busy aspect of the matrix can be disadvantageous.
The alignment matrix helps to establish the degree to which a program is aligned with the organization's business strategy. This makes it possible to refine the portfolio of programs and for the program manager to fully understand the strategic significance of his or her program.
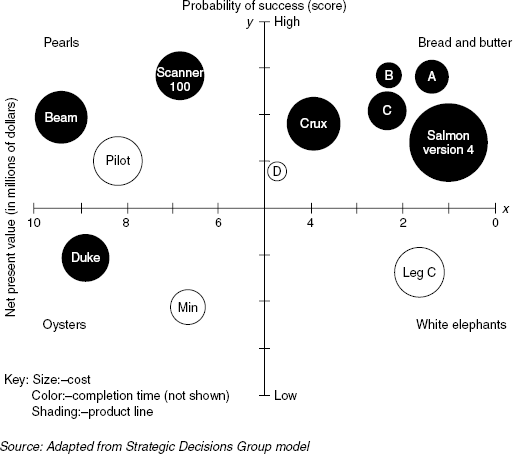
Portfolio maps—we refer only to the bubble diagram form of portfolio maps—are information displays that visually show key parameters necessary to successfully balance a portfolio of programs. Typically, the x and y axes of the diagram represent two of the key parameters of a program, as depicted in Figure 10.2. The bubbles in the diagram indicate the position of the program within the two dimensions, while its size and color may point to additional parameters such as program size, percent complete, or program type. The distribution of the programs on the diagram, visualized as bubbles, provides senior management with information needed to decide how to distribute their investment in the programs as they pertain to the parameters selected.
Step 1: Prepare information inputs: Balancing a portfolio of programs calls for quality information about the following:
Strategic and tactical plans
Program selection criteria
Program roster with programs' alignment to strategy
Step 2: Select the type of chart: Making a choice of the chart (see box titled, "This Is Not the Old BCG Matrix") begins with a clear understanding of the parameters on the axes of the portfolio map, such as the following:[115]
Program importance versus ease of execution (in scoring models-based charts)
Adjusted net present value versus the probability of technical success (in risk-return charts)
Program costs versus life cycle phases (in other bubble diagrams)
No single chart can comprehensively characterize a portfolio. By utilizing several charts with varying program parameters, one can accurately capture major strategic requirements of the portfolio.
Step 3: Chart programs: Draw the x and y axes (see Figure 10.2), label them with the chosen parameters from step 2, and enter the scale. This type of diagram is based on scores from program selection, and in this example, each parameter's scale is a numerical average of three constituent scales. For program value, these include strategic importance to company goals; organizational impact (for example, profitability impact); and economic benefits (for example, dollar savings). However, ease of execution relates to cost of execution; program complexity (for example, difficulty of implementation); and resource availability. The intent here is to assess the program in a comprehensive, multicriteria fashion.
Step 4: Interpret the diagram: Identify programs that are located in favorable quadrants (the upper, left in Figure 10.2), dissect those in the low importance and difficult quadrant (lower right in Fig. 10.2), and strive to balance ease and importance of programs. For example, in Figure 10.2, we interpret the information in the diagram as follows:
Easy-to-do programs are in short supply, just 3 out of 12. We need more of these "low-hanging fruit" programs, seeking a balance between easy and difficult programs.
There are only three programs in the most sought-after upper, left quadrant, an intolerably low number.
Another problem looms on the horizon with too many programs—seven precisely in the right quadrants. This is the most unpleasant place, and one should think about which to kill.
Two programs are of high importance but difficult to do. Perhaps, there are ways to remove some barriers to ease implementation.
In this relatively simple example, the bubble diagram demonstrates its forte, the ability to display program information well.
Step 5: Balance the portfolio: Managers, not the portfolio map, need to make a decision to act and balance the portfolio. For the example shown in Figure 10.2, one can suggest that the following balancing actions be taken:
Increase the number of easy-to-do programs
Increase the number of the most sought-after programs
Kill programs with the lowest importance
Increase the ease of implementation of all programs in the high value, risk quadrant
Portfolio maps are versatile tools that can be employed in multiple ways. One way may be to start at the top of the company (a portfolio map for top strategic programs) and cascade through portfolios of different organizational levels. Good examples are new product, information technology, and manufacturing groups.[117] In this context, the portfolio maps are employed for periodic reviews of the program portfolios, quarterly or semiannually.
Provided that information about programs is available, constructing a portfolio map is a quick action. For a portfolio diagram consisting of 20 programs, a group of decision makers may need only a few minutes to create a portfolio diagram. The large portion of time consumed is in analyzing the position of programs in the diagram and making decisions to balance the portfolio of programs. These steps may take several hours to a full day.
The basic value of the portfolio map is its ability to act as a meaningful information display, helping discern programs in less-desired quadrants. Additionally, the sense for the utmost importance of balancing programs across the desired quadrants comes across clearly. Such a visual demonstration of the program portfolio is unmatched by other tools.
Portfolio maps offer substantial advantages through simplicity, with user-friendliness and a data-based view. The data is viewed and factual. The problems with portfolio maps may result from information overload, when too many diagrams are used.
This section is about portfolio maps in the form of bubble diagrams, which is information that visually shows key parameters necessary to successfully balance a portfolio of programs. The bubble diagrams cannot suggest actions to balance an unbalanced portfolio of programs. However, they can indicate the importance of balancing programs across the desired quadrants. The essence of constructing the diagrams is highlighted below.
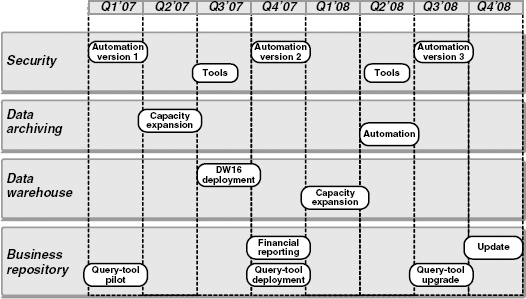
The Program Road map is an information display that visually shows the time phasing of the programs within the portfolio. Typically, the road map is segmented into product, service, or infrastructure type, or into market and customer segments. This is represented by the vertical grouping of programs, as shown in Figure 10.3. The horizontal axis of the program road map shows the distribution of program completions over a predefined time horizon, which may be months, quarters, or years. It should be noted that only programs selected through the portfolio management process are included in the program road map.
Step 1: Prepare information inputs: Developing the program road map requires accurate information about the following:
Program portfolio prioritization and balancing
Product, service, or infrastructure segmentation scheme
Estimated program launch dates
The results of the portfolio management selection and balancing process should be complete to accurately depict the programs that have been approved for planning and execution. A segmentation scheme by product, service, or infrastructure type (or by market segment) adds clarity to the program road map structure. Estimated program launch dates for product, service, or infrastructure availability drives the timeline for program completion dates.
Step 2: Assess market and customer need: Complete a thorough market analysis to determine the appropriate market or channel segments for each of the programs on the road map and the customer expectations of availability dates for the products, services, or infrastructure capabilities to be developed.
Step 3: Utilize the portfolio analysis results: The portfolio management process yields a prioritization of programs selected over a predetermined time horizon. It is recommended that the programs are added to the program road map in similar prioritization. In other words, the highest-value programs are given priority with respect to time phasing of resources.
Step 4: Assess the organizational development capacity: This step includes an analysis and understanding of the firm's capacity in the following areas:
Availability of adequately skilled resources
Planned availability of existing and new technologies
Availability of funding
Most firms' development appetites normally exceed their available resources. Part of the exercise of developing the program road map is to balance the timing of approved programs with the available resources so that the road map reflects what is possible and practical.
Step 5: Finalize time phasing of programs: Based upon the organization's development capacity, market or customer demand, and portfolio management prioritization, adjust the targeted timeline for each program on the road map accordingly. It should be noted that this is many times an iterative process.
The program road map tool is dynamic in nature and is prepared or updated in conjunction with the portfolio management process. Once the portfolio of programs has been updated, any programs added or removed from the portfolio are also added or removed from the road map in similar fashion. Program timeline targets are then adjusted accordingly. The road map represents the best and current view of the firm's product, service, or infrastructure schedule targets.
The estimated time to prepare the program road map depends upon the number of programs undertaken by the firm and the complexity of the markets served. Preparation time can range from a few hours to a few days.
This tool provides an organized and disciplined approach to characterize a firm's development strategies by balancing the timing of program demands with the availability of resources to maintain reality for what is practical and achievable. Additionally, it provides both senior and program managers with a view of the portfolio of programs over time. Also, this tool provides the completion and delivery targets from the market and business perspectives to help guide the program planning process. And, finally, the tool shows the grouping of programs by market segment or product, service, or infrastructure type to facilitate more effective resource allocation across the programs.
The program road map is visual and easy to read. However, developing and updating the program road map requires discipline that many organizations lack to keep the information current and relevant.
This section describes the program road map as an organized and disciplined approach to illustrate the time phasing of the programs within a portfolio. It is an effective tool for senior managers and program managers alike. For senior management, the tool provides a means to balance the market needs for products, services, or infrastructure capabilities with availability of development capacity over a predetermined time period. The program road map also provides target delivery dates that program managers can use to guide their program planning activities and end results.
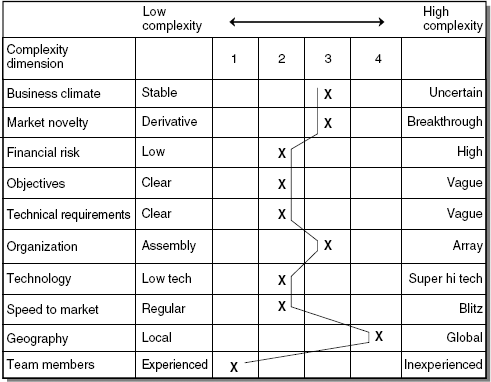
The program complexity assessment tool helps determine how a new program stands on multiple dimensions of complexity. To accomplish this purpose, the structure of the program complexity assessment tool features several parts. First, the tool includes the dimensions of complexity that reflect the program management strategy of the company from multiple perspectives, including program business environment, program strategy, and program characteristics. Each dimension of complexity is assessed on the anchor scale (second part), and when the complexity scores of each dimension are connected, a line called the complexity profile (third part) is obtained. The complexity profile is a graphical representation (Figure 10.4) of a program's multifaceted complexity used by management to make several major decisions, as described in the following benefits section.
Step 1: Prepare information inputs: Determining realistic program complexity takes quality information about the following:
Business environment
Program strategy
Program characteristics
The business environment information is necessary to establish and evaluate complexity dimensions related to the environment such as the business climate, market novelty, and financial risk of the program. Objectives and features set (part of technical requirements) are defined in the program strategy. Other dimensions such as organizational, technology and speed-to-market complexity are determined from program characteristics identified in the program business case.
Step 2: Identify complexity dimensions: What constitutes a complex program? According to Edmonds, a complex program can be defined as one whose variety and/or connection of parts or aspects have increased in multiple dimensions.[118] In particular, a program that features newer technology, faster speed to market, and total-market novelty is more complex than the one including mature technology, regular speed to market, and a known target market. In selecting the complexity dimensions with which to assess a program, choose those that systematically characterize the programs from varying angles. As illustrated in Figure 10.4, the dimensions should also reflect the company's business environment and strategy.
Step 3: Define complexity scales: First, choose a scale for each dimension. Alternatives for the scales abound; in Figure 10.4 we chose a scale in which the complexity for each dimension is measured on a simple four-level scale (1 is the lowest complexity and 4 is the highest complexity). Next, define anchor statements for each level of the scale. Anchor statements help build consistency when assessing the complexity for each dimension (see boxes titled, "Some Anchor Statements May Be More Detailed" and "Some Anchor Statements May Be Less Detailed"). Without anchor statements, each assessor may evaluate the levels differently, leading to inconsistent complexity evaluations. Well-defined anchor statements help to ensure all assessors approach the scale for each complexity dimension from a consistent frame of reference.
Step 4: Assess complexity: Relying on quality information inputs and using the established scales, decision makers are able to assess the complexity of each dimension. For example, in Figure 10.4, speed to market is assessed as a level-2 complexity, (fast and competitive). Once all complexity dimensions are assessed, connect the obtained scores for each dimension to produce the complexity profile, which helps to visually depict the overall program complexity. The profile in Figure 10.4, for instance, shows that the program is of medium complexity, with all dimensions at levels 2 and 3, except team members who are experienced (the least complex). The profile is important in making some decisions described in the following Benefits section.
Typically, the program complexity assessment tool is prepared during the program define and plan phases of the PLC to serve purposes discussed in the benefits section that follows. However, this tool should be utilized dynamically and updated periodically in high-velocity environments where the program scope and business climate may frequently change. It is crucial that the senior management team of an organization who manages the portfolio of programs uses this tool to approve the overall level of complexity for each program.
Once the information inputs are defined, it typically takes less that one hour to create and utilize the program complexity assessment tool. If you complete the complexity evaluation without the basic knowledge of the program and business environment, it will require significant time on the part of the assessors. It is highly recommended that the informational inputs be collected prior to assessing a program's level of complexity.
The program complexity assessment tool's value is multifold. First, knowing the program complexity helps balance the portfolio of programs with a mix of low- and high-complexity programs. Further, the complexity assessment aids in the planning process, indicating how to adapt one's management style to the level of complexity of the program. For example, a high-tech program that experiences scope freeze in the third quarter of the development cycle will require a rigorous change management process due to the high number of interdependencies that a change may affect. The program complexity assessment tool also helps the senior management team determine the level of skill and experience needed for the program manager and the key leadership positions on the team to successfully define and execute the program. Additionally, the tool may influence how much contingency buffer to build into the program budget and schedule—the more complex the program, the bigger the buffer. Finally, the tool may help identify the categories of risk and the level of robustness you will need in your risk management plan.
As an advantage, the program complexity assessment tool is easy to read. The senior management team and program manager can quickly get a feel for the level of complexity of each program within the organization. However, when there are too many complexity dimensions identified, or the scales are too vague, the tool can become unreliable and disadvantageous.
The program complexity assessment tool helps evaluate complexity of the program from multiple dimensions, spanning from program business environment to program strategy and to program characteristics. Understanding the level of complexity of a program helps to balance the portfolio of programs from a complexity perspective; aids in the determination of the skill set and experience level required of the PCT; guides the implementation of key program processes such as change management, risk management, and contingency reserve determination; and helps the program manager adapt his or her management style to the level of complexity of the program.
Details about situations in which to use each of the tools are described in Table 10.1. Specifically, we've identified several program situations and marked how each situation favors the use of the tools. (If additional situations are needed, brainstorm to identify them). Indicate which tools will support each program situation and then choose between the options.
Companies use strategic tools to support achievement of program deliverables, but the ultimate essence of using them is to help improve business results related to programs. Let's see how every tool from this chapter can be employed to improve results. This will help us better comprehend why program management elements' such as strategic tools' are so important for good business.
Consider the immense value of the information that the business case provides. First, information about how a program helps the company meet its business and strategic goals; second, information about alignment between strategic goals and program execution based upon multiple business perspectives; third, information about evaluation of programs within the portfolio on a consistent set of criteria; and fourth, information about the program vision to effectively plan, execute, and deliver the output of the program. Simply, the better the information contained within the program business case, the easier it is to determine if a program will help achieve the business results intended.
Table 10.1. A Summary Comparison of Strategic Program Management Tools
Situation | Favoring Program business case | Favoring Program alignment matrix | Favoring Program portfolio maps | Favoring Program road map | Favoring complexity |
|---|---|---|---|---|---|
Show future company business strategy | ✓ | ✓ | |||
Show program launch timeline | ✓ | ||||
Show program business and marketing viability | ✓ | ||||
Show program technical feasibility | ✓ | ||||
Show program aligned with business strategy | ✓ | ✓ | |||
Display program portfolio visually | ✓ | ✓ | |||
Show skill level required to manage the program | ✓ | ✓ | |||
Need to adapt program management style | ✓ | ||||
Indicate the level of contingency reserves | ✓ | ||||
Indicate robustness of the risk management plan | ✓ |
The alignment matrix enables senior management to select the most valuable programs that are risk balanced and are also aligned with the strategic objectives of the organization. Business results will be improved if the most valuable programs are chosen.
The program road map provides an organized and disciplined approach to characterize a firm's development strategies by balancing the timing of program demands with the availability of resources to maintain reality for what is practical and achievable. Additionally, it provides both senior and program managers a view of the portfolio of programs over time. Also, this tool provides the completion and delivery targets from the market and business perspectives to help guide the program planning process. Finally, the tool shows the grouping of programs by market segment or product, service, or infrastructure type to facilitate more effective resource allocation across the programs.
The basic value of the portfolio map is its ability to act as a meaningful information display of how well a portfolio of programs is balanced, according to multiple business dimensions. Such a visual demonstration of the program portfolio is unmatched by other tools.
A program map equips an organization with a characterization of its development strategies by balancing the timing of program demands with the availability of resources to maintain reality for what is practical and achievable. Logically, then, better program maps will provide more effective resource allocation across the programs, which leads to better business results.
The business results hinge on the following factors: (1) How well balanced the portfolio of programs is with a mix of low- and high-complexity programs, (2) knowing the level of skill and experience needed for the program manager, and (3) in what way to adapt one's management style to the level of complexity of the program. We can fairly state that higher-quality factors mean better business results. The quality of all three factors is determined by the quality of the program complexity assessment; therefore, we can conclude that the assessment can improve the business results.
The strategic program management tools enable program managers to comprehend the nature and position of their program in the context of all current and future programs in relation to a company's business strategy.
Each of the five tools is designed with a distinct purpose. The program business case is used to clearly define the program and program output, test the feasibility of the program against the business objectives and operating environment, and define the program success criteria. On the basis of the program business case feasibility, a program gets funded, is checked for alignment with the business strategy by means of the program alignment matrix, and then added to the portfolio of programs. The program portfolio map is utilized to evaluate, prioritize, and balance the portfolio of programs from multiple strategic vectors identified by the executive team of the organization. The program road map shows the time and sequence relationship of the portfolio of programs as they exit the company's development pipeline. The program complexity assessment is then utilized to gain an understanding of the skill level required of the program manager and PCT, of how to adapt the program management style to respond to the program's complexity, and to identify risks associated with the complexity detail.
[111] Cleland, David I. Project management: Strategic design and implementation. Blue Ridge Summit, PA: TAB BOOKS, 1990.
[112] Martinelli, Russ and Jim Waddell, "The Program Strike Zone: Beyond the Bounding Box". Project Management World Today (March-April 2004).
[113] Cooper, Robert G, et al. Portfolio Management for New Products, 2nd edition. Cambridge, MA: Perseus Publishing, 2001.
[114] Archer, N.P. and Ghasemzadeh F. "Project Portfolio Selection Techniques: A Review and a Suggested Integration Approach". Innovation Research Working Group, McMaster University, (1996).
[115] Benko, Cathleen and F. Warren McFarlan. Connecting the Dots: Aligning Projects with Objectives in Unpredictable Times. Boston, MA: Harvard Business School Press, 2003.
[116] Schwalbe, Kathy, Information Technology Project Management, 4th edition. Cambridge, MA: Course Technology, 2005.
[117] Cooper, Robert G., et al. Portfolio Management for New Products, 2nd edition. Cambridge, MA: Perseus Publishing, 2001.
[118] Edmonds B., "What is Complexity?" in F. Heylighen and D. Aerts The Evolution of Complexity, Dordrecht: Kluwer, 1996).
[119] Shenhar, Aaron J. "One size does not fit all projects: Exploring classical contingency domains", Management Science, Vol. 47, No. 3 (2001), 394–414.
[120] Shenhar, Aaron J., D. Dvir, et al., "Toward a NASA-Specific Project Management Framework", Engineering Management Journal, (2005).