The topic of Chapter 11 is program management tools of the operational nature, those that program managers need on a daily or frequent basis for managing a single program in collaboration with project managers on their core team. The operational tools are enabling devices for both program and project managers to reach an objective or, more specifically, a program deliverable. As stated in Chapter 10, the tools do not make decisions; program and project managers make the decisions using information provided by the tools. The operational program management tools, just like strategic program management tools, include systematic procedures and techniques by which they provide program information.
We explain the following operational program management tools in this chapter:
Program strike zone
Program map
P-I Matrix
Program review
Program dashboard
Most of these tools are used throughout the PLC. Two of the tools, the program dashboard and the program review, are also useful for senior management's use to evaluate multiple programs simultaneously under way in the organization.
The purpose of this chapter is to help practicing and prospective program and project managers, as well as other program stakeholders, achieve the following objectives:
Learn how to use major program management tools of the operational nature
Select program management tools that match their program situation
Mastering these skills is crucial to the management of a single program in creating a repeatable process of successful program definition, planning, coordination, monitoring, and control.
Note that there is a difference in the development and use of the operational and strategic program management tools. As mentioned in Chapter 10, program managers may not get involved in the development of the strategic program management tools. They use them primarily as a source of information that helps them comprehend the nature and position of their program in the context of all programs and the company's business strategy. In contrast, program managers spearhead the effort of developing and using the operational tools. However, it is worth emphasizing that the project managers on the program supply much of the information for most of the tools. This is very typical, considering that most of the program focus is on cross-project collaboration and dependencies. The case is the same in the use of the operational program management tools—the program manager and project managers jointly use the tools. Therefore, as some experts argue, knowing how to use these operational program tools is a factor of success for the program manager and project managers.
For a user-friendly presentation of the tools, we designed the chapter in similar fashion to Chapter 10, with the goal of maximum understanding of the development and utilization of each tool. Presentation of each tool will be segmented into the following sections: (1) Description of the tool, (2) developing the tool, (3) utilizing the tool, and (4) summary and highlights of the tool.
At the end of the chapter, we present a brief set of situations in which the operational program management tools are used.
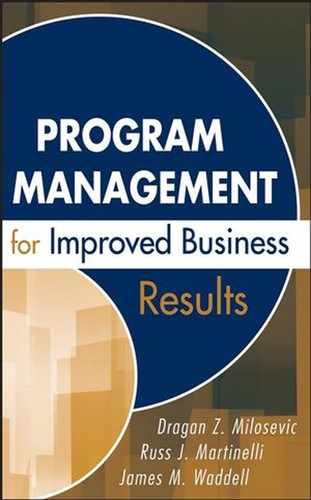
The program strike zone is utilized to identify the critical success factors of a program, to help the organization track progress toward achievement of the key business results, and to set the boundaries within which a program team can successfully operate without direct management involvement. It is an effective tool for ensuring the program is planned with the correct set of success criteria and that the program stays within those boundaries throughout the PLC. As shown in Figure 11.1, elements of the program strike zone include the critical success factors for the program, target and control (threshold) limits, and a high-level status indicator. The thresholds also serve as the dividing lines between program team empowerment and executive management intervention.[121] A green status indicator signifies progress is as planned, yellow status indicates a heads up to management of a potential problem, and red requires management intervention to proceed.
Bill Shaley, a senior program manager for a leading telecom company, described the program culture within his company this way: "Managing a program is like having a rocket strapped to your back with roller skates on your feet; there's no mechanism for stopping when you're in trouble." Sound familiar? The program strike zone is such a mechanism that is designed to stop a program, either temporarily or permanently, if the negotiated threshold limits are breached. At which point, the program is evaluated for termination or reset for continuation.
Developing an effective program strike zone is a critical activity for ensuring that the program manager, executive management, and program team all understand and agree upon the critical success factors of the program. It is also critical for establishing the boundary conditions that will drive effective decision making on the program. Developing the program strike zone consists of the following steps:
Prepare information inputs
Identify critical success factors
Set the target and threshold values
Negotiate and ratify the final target and threshold values
Adjust the program strike zone as needed
Step 1: Prepare information inputs: Defining a meaningful program strike zone requires quality information from the following sources:
Approved business case and objectives
Program road maps
The team's capabilities, experience, and past track record
The program's complexities and risks
The initial set of success factors are derived directly from the approved business case and program road maps. To be able to establish and later negotiate the control limits for each success factor with the program manager, the GM needs to know the program team's capabilities, experience, and past track record. Then he or she must use that information to balance thresholds against the new program's complexities and risks.
Step 2: Identify critical success factors: Identification of the critical success factors begins during the define phase of the PLC. The factors represent a subset of the metrics normally tracked by a program team. The program strike zone should include only the few critical success factors that represent business objectives. Each organization will have a unique set of factors, based upon its products or services, and way of measuring success. The factors deemed as "must haves" often include market objectives; financial and schedule targets; value proposition of the program output (for example, product, service, or infrastructure capability); and technology objectives.
Step 3: Set the target and threshold values: The target and threshold control limits shown in Figure 11.1 form the strike zone of success for each critical success factor. The target value for a critical success factor is based on the program business case and baseline plan. The threshold value represents the upper or lower limit of success for a particular critical success factor.
Step 4: Negotiate and ratify the final target and threshold values: Once the program manager and PCT establish the recommended target and threshold values for each critical success factor, the program manager presents the information to the senior executive sponsoring the program. Based upon the complexity and risk level of the program, and upon the capability and track record of the program manager and team, the executive sponsor will adjust the values accordingly. For example, on a program that is low complexity, low risk, and is being managed by an experienced program team, the range between target and threshold values will be opened up to allow for a higher degree of decision-making empowerment for the program manager. Conversely, on a program that is of higher complexity, risk, or is being managed by an inexperienced program manager and team, the range between target and threshold values will be tightened-up to limit the decision-making empowerment of the program manager and team. Once the targets and boundaries are negotiated, the team is empowered to move rapidly, as long as they do not violate one of the strike zone threshold values.
Step 5: Adjust the program strike zone: The program strike zone is dynamic in nature and may be adjusted or changed as the business or environment evolves during the life of the program. As stated earlier, the program strike zone is initiated in the define phase to align the program business case to the critical success factors that represent key business objectives. During the planning stage, it is expanded to contain a full set of critical success factors that align the program plan to business objectives. During the implementation phase, the program strike zone is utilized to guide the decisions of the program team and to gauge overall program progress. Finally, during program closure, it is utilized to determine program completion and success. Throughout the PLC, changes to the operational or business environment may require alterations to the data elements in the program strike zone.
The program strike zone is used by executive managers and program managers. It establishes executive management's role in the program decision-making process and provides a catalyst to keep them actively engaged in the success of the effort. Executive managers utilize the program strike zone as a "no-surprises" tool to ensure that a new program's definition supports business objectives; it is also used to establish control limits and check that the program team's capabilities and performance are in balance with the complexity of the process. As long as the program progresses within the strike zone of each critical success factor, the program is considered on target and the program manager remains empowered to manage the program through its life cycle. However, if the program does not progress within the strike zone of each critical success factor, the program is not considered on target and the executive managers must directly intervene. The executives can either reset the critical success factor target or thresholds; modify the scope of the program to bring it within the current targets; or, in the worst case, cancel the program to prevent further investment of resources.
Program managers utilize the program strike zone to establish the program vision based upon the critical success factors for the organization; to negotiate and establish their empowerment boundaries with executive management; to communicate overall program progress and success; and to facilitate various trade-off decisions throughout the PLC (see the box titled, "Using the Program Strike Zone"). As indicated in Figure 11.1, the structure of the tool allows the program manager to communicate program progress with a dashboard or status-light reporting method that quickly summarizes program status for executive management.
Development of a program strike zone can be accomplished within an hour, provided the information inputs are available. Establishing the critical success factors and negotiating the threshold values can be more time consuming and easily take a full workday to complete.
The program strike zone is an important communication and management tool that helps program managers keep a program aligned with the business objectives as it progresses throughout the PLC. Its major value is setting and communicating the vision for the program team by identifying the elements of program success as gauged by a business unit. The program strike zone also fosters a "no surprises to management" behavior by increasing the flow and relevance of information between the program team and executive management. This results in an efficient means of elevating critical issues and barriers to success for rapid decision making and resolution. Finally, the program strike zone provides a mechanism for stopping a program, if it is no longer aligned to the objectives of the company.
The program strike zone is user-friendly in terms of its simplicity and graphical appeal for its high-visual power. It is flexible from a usage standpoint, in which both senior managers and program managers consider it a useful tool. A disadvantage may arise when too many critical success factors are fed into it, causing the tool to lose its simplicity.
A challenge historically plaguing business management has been the ability to convert comprehensive strategic objectives into effective execution that delivers tangible results. The program strike zone bridges the chasm that can exist between strategic planning efforts, program planning, and execution output within an organization. If implemented properly, the program strike zone will help to keep senior management and the program team focused on issues critical to the success of the program. This tool is used to identify the critical business success factors of a program, help the program and executive managers track progress toward achievement of the key business results desired, and set the boundaries within which a program team can operate without direct senior management involvement.
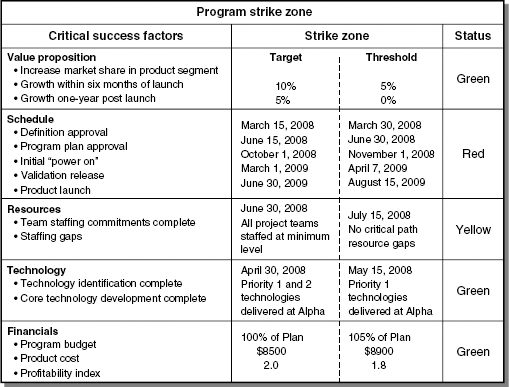
The program map is a tool that indicates critical cross-project dependencies with respect to time (Figure 11.2). In particular, the map shows the critical deliverables of each project team throughout the PLC. It then illustrates through the use of arrows the project teams that are dependent upon each deliverable. This mapping of deliverables from one team to another helps the program team to determine and fully understand the cross-project interdependencies that exist on the program. As an example, in Figure 11.2, power control SW is a deliverable generated by the software development project team, which is then delivered to the enclosure project team for further development. In turn, the enclosure design files deliverable is generated by the enclosure development project team and delivered to the manufacturing project team. This mapping of deliverables shows the critical interdependency between the software, enclosure, and manufacturing project teams of the program.
The crux of the program map is to show the big-picture view of the cross-project dependencies throughout the PLC, one that will serve as the critical target for the program deliverables. However, this big picture hinges on the knowledge of many details and the application of the following steps:
Prepare information inputs
Identify project deliverables
Map the deliverables
Establish cross-project dependencies
Step 1: Prepare information inputs: Successful mapping of cross-project deliverables is dependent upon the availability and full understanding of the following program information:
Key elements of the program strategy and requirements
Project managers' inputs
Knowledge of the program technology
Clearly one needs to understand the program strategy and the details of the product, service, or infrastructure requirements in terms of the program feature set; program scope (preliminary- or mature-program WBS); and program goals (for example, schedule goals) to be able to identify the projects that make up the program and their critical deliverables. The project managers, in turn, use this information to identify their teams' deliverables and estimate the time and resources required to develop each deliverable. In addition, to fully understand the definition and work to generate a deliverable, a firm understanding of the technology employed on the program is also a critical input to the mapping process.
Step 2: Identify project deliverables: Using the information contained in the program WBS and the detailed requirements, each project team identifies its primary deliverables to the program. Obviously, this is a case in which the quality of the requirements and the WBS will affect this step. Poor requirements will lead to poor deliverable identification, which will ultimately lead to a poor plan and program execution. The message here is to take time to gather and analyze the program requirements before the program map is created, or be prepared to repeat the exercise at a later date. For each deliverable, document the critical information needed for the mapping process—deliverable name, time to develop the deliverable, and dependencies required to complete the deliverable.
Step 3: Map the deliverables: We have found that the most effective method for creating a program map is to use a team workshop format that is led by an independent facilitator. Necessary participants include the program manager and the PCT. It is important that the program manager does not take on the facilitation duties. It is best if he or she is a full participant in the activities and discussion during the workshop. We do recommend, however, that the program manager be prepared to supply plenty of coffee, donuts, pizza, and maybe dinner to keep the team engaged and willing to participate in a potentially lengthy exercise.
During the mapping session, utilize a large work area, such as a white board or wall, to create swim lanes along the horizontal axis that represent the various project teams on the program. Then create vertical partitions that represent the lowest level of schedule tracking that will take place on the program (day, weeks, months, or quarters), as shown in Figure 11.2 On the appropriate dates, enter the deliverables for each project team into the swim lanes of the program map. Using the example shown in Figure 11.2, the BIOS is a software project deliverable due in week three, and the manufactured circuit boards is a manufacturing project deliverable due in week six. Continue the mapping exercise until all program deliverables are entered on the program map.
Step 4: Establish the cross-project dependencies: This is the crucial time when the team sequences the deliverables and sets up the interdependencies among them. Essentially, cross-project dependencies will determine the sequence of development, interfaces, and responsibilities, as well as the initial timeline. For example, in Figure 11.2, the arrow from enclosure design files to manufacturing means the enclosure design files are delivered to the manufacturing team in week two. Multiple rounds of iteration are normally needed to refine the deliverables, interdependencies, and delivery dates. As a note of caution, once a timeline is established through the mapping process, it should not be considered the program schedule. At best, this exercise yields a schedule with a 50-percent confidence level. This should only be considered a first-pass timeline for the program (see Chapter 8).
For any program, small or very large, the program map is highly recommended to fully understand the deliverables and interdependencies between the project teams on the program. The best time to create the program map is during the planning phase of the program, after the program scope and requirements are well defined. To repeat, the team workshop approach for creating the program map yields information-rich exchange, cross-project discussion, face-to-face interactions, and reciprocal iterations; it also has no equal when it comes to developing a quality program map.
If the facilitated workshop approach is used to develop the map, one workday is a typical time duration. However, large programs can take multiple days. If the facilitated workshop method is not utilized, allow a full work week to complete a program map for small- to medium-sized programs and multiple work weeks for large programs.
The value of the program map lies in showing cross-project dependencies and enables benefits that stem from knowing the dependencies. These enabling benefits include a clear sequence of the program implementation, established commitments for each project team, and critical interactions between PCT members.
As an advantage, the program map gives a clear visual representation of the cross-project deliverables and dependencies. As stated earlier in the book, a critical role of the program manager involves managing the cross-project dependencies on the program; the program map, therefore, establishes his or her plan for management of those dependencies. Creating and revising the program map can be a large investment of program resources; thus, it could be disadvantageous if the prerequisite information is not available and reasonably stable prior to creating the mapping process.
The focus of this section is the program map, which indicates critical cross-project dependencies over the program timeline. This tool helps establish a clear sequence of the program implementation, commitments, interactions, and responsibilities of critical team members.
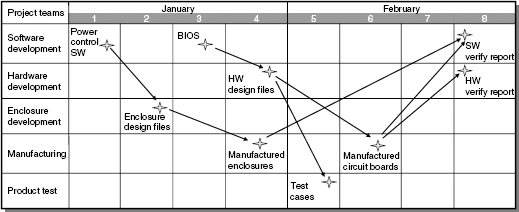
The program P-I matrix is a tool used to identify program risks, assess their probability and potential impact, and provide a representation of risk severity to facilitate effective program decision making (Figure 11.3). The matrix is usually divided into red, yellow, and green zones, which represent high-, medium-, and low-severity risks respectively, based on the organization's thresholds for risk severity. The position of a risk in the matrix determines its ranking or severity. The higher the value of a square, the higher is its rank and the more severe is its impact. To be effective, the matrix must be realistic (as to the severity of the risk), timely, and brought to life by the joint effort of the program and project managers who own the program matrix.
Making decisions is perhaps the toughest job for program managers and the PCT. Many times decisions are made with incomplete information and uncertain outcomes, which is one reason why decision making can be so difficult. The P-I matrix is a tool that can be developed and utilized to provide a more complete representation of information in support of program decision makers. Development of the P-I matrix involves the following steps:
Prepare information inputs
Identify program risks
Assess risks
Establish risk response strategies
Step 1: Prepare information inputs: Ideally, preparation of the P-I matrix should start with the following rigorous inputs:[125]
Risk management policies
Program planning outputs
Historical information
Project managers' risk assessments
Risk management policies provide recommended methods for dealing with risk throughout the program's life. The second input, program planning outputs, include performance baselines such as program goals and specification baselines, which is what is at risk on a program. Having full knowledge of the baselines is crucial in developing the P-I matrix. Because risk management tends to be data intensive, reliable historical information such as past program records, postmortems, or published sources (for example, benchmarking studies) is vital. It is also important for all project managers to express their assessment of cross-project risks because these risks make up a large portion of the P-I matrix (see Chapter 8).
Step 2: Identify risks: The purpose of this step is to identify all the potential risks that may significantly influence the success of the program. As discussed in Chapter 8, program risks are those that either jeopardize the critical success factors of the program or affect multiple projects. The latter type of risk is referred to as cross-project risks. Risk events that are contained within a single project are referred to as project-only risks, and should not be included in the program P-I matrix.
It is crucial that the program manager and the project managers collaborate to identify the program-level risks with which to populate the program P-I matrix. To begin this exercise, the team reviews each project-risk list to determine which of the identified project risks need to be elevated to the program level. A brainstorming exercise by the PCT is recommended to identify any other program-level risks with which to populate the program P-I matrix.
Step 3: Assess risks: At this stage of the risk management process, it's likely that a large number of risks have been identified, depending upon the type of program. The challenge for the program manager is to identify those that have both the highest impact on the program and those that are most likely to occur. Therefore, the impact, probability, and severity of each risk needs to be analyzed. In this assessment, we tend to use a nonnumeric probability scale. For example, on a five-level scale, the ratings are 1=very unlikely, 2=low likelihood, 3=likely, 4=highly likely, and 5=nearly certain.[122] Consequently, one will qualitatively assess each risk's probability of occurrence. When this is completed, the next step is to assess the potential impact of each risk, again on a discrete scale. One example is a scale rating impact, such as 1=very low, 2=low, 3=medium, 4=high, and 5=very high. To illustrate its use, let's assume a risk that will be assessed has a simple program schedule slip impact. The scale can define the levels of impact, as shown in Table 11.1.
After all risks are assessed in this manner, it is time to use a formula to combine the probability and impact of each risk to establish a measure of severity. Although nonlinear formulas can be employed, linear formulas such as severity = probability + N x impact are easier to apply. For example, n can be equal to two, meaning that impact is twice as important as probability in establishing risk severity. In this case, the assessed probability and impact for each risk would be entered in the formula severity=probability+2 x impact and the obtained value input into the P-I matrix, which consists of 5×5 squares. This is the formula utilized for the risk severity calculation in Figure 11.3
Some larger programs commonly focus on the top ten highest-ranked risks. In contrast, some smaller programs decide to manage the top three risks, arguing the lack of resources prohibit taking on a larger number of risks. Both approaches may be dangerous. So, what is a reasonable way out? The answer is in the P-I matrix—respond to the highest-ranked risks in the matrix, down to an agreed level.[123] For example, focus on handling risks down to risk score of 11 (see Figure 11.3) and treat other risks as noncritical. With this approach, one neither squanders resources nor disregards significant risks. It should be noted that noncritical does not mean not important. Rather, it means that scarce program resources are not immediately needed to address the risk event but may be needed in the future.
Step 4: Establish risk response strategies: Risk response is not normally part of the P-I matrix development; however, developing the P-I matrix only makes sense if risk response planning is performed, and culminated into its most crucial action—determining the preventive action, trigger point, and contingent action for the critical risk events. The preventive action is the primary for strategy risk response, or plan A. When executed, however, it may or may not work. The point at which we establish that the primary strategy doesn't work is the trigger point. At that time, the backup strategy or contingency action, plan B, is taken to counter the risk.
Not surprisingly, the dominant mode of using the matrix is normally informal in practice. However, best practices have shown that it is advantageous to first develop the P-I matrix in the define phase of the PLC and present it as part of, or in conjunction with, the program business case. The P-I matrix should then be updated through the planning phase and utilized as part of the program plan. Periodic reevaluation of the matrix throughout the implementation phase of the program is also a best practice. The information contained in the P-I matrix is crucial to review during the program launch approval meeting (see Chapter 7). Although at times it may seem to be overly simplistic for large and complex programs, the P-I matrix is abundantly applied in these programs focused on the larger number of highest-ranked risk events, with more formality.
Many teams running small and simple programs can expect to expend one to a few hours of their time to develop the P-I matrix. This time proportionately rises as programs get bigger and more complex. Tens of hours may be necessary for a team in charge of a large and complex program to devise the matrix. However, periodic updates can be accomplished as part of the regular PCT meetings and require a minimal amount of time.
The P-I matrix helps sift through the myriad of uncertainties and pinpoint and highlight the program areas of highest risk—both before work has begun and throughout the program.[124] This offers an opportunity to focus program resources and to identify effective ways of reducing risk events in a proactive manner, rather than being confronted by them if they turn into problems later in the program. In addition, the matrix generates information for more reasonable contingency planning.
The matrix's major advantages are visual presentation of risk information and simplicity. If you eliminate the advanced statistics, its quantitative part is still simple and adequate. But the matrix's major focus is on individual risk events, and it does not provide a reliable mechanism to deal with interacting risk events.
The P-I matrix helps pinpoint and highlight the program areas of highest risk and identify effective ways of reducing those risks in a proactive manner. It also enables more reasonable contingency planning and provides an early warning of risk.
A program review is a formal event in which senior management evaluates the status and progress of a program. The program review can be used in many ways. From the individual program perspective, the program review can be used to assess a major developmental milestone as part of the traditional phase/gate process such as a business-case approval milestone or engineering release milestone. It could also be used to request management's attention to address a significant barrier outside the control of the program team. Finally, a program review can be used as a normal operational status and progress update to management. Senior management can use the program review format to evaluate the status and progress of all programs currently under way within the organization.
Communication between the program manager and the senior management team is a critical element of program success. Early and often communication with senior management ensures they are actively involved in the program. The program review is an effective tool for facilitating good communication between the program manager and senior managers in the enterprise. Development of the program review involves the following steps:
Identify the type of program review
Determine the purpose of the review
Determine the attendees
Create the agenda
Conduct the meeting
Document the program review meeting results
Step 1: Identify the type of program review: Program reviews are most often defined as part of an organization's development process and can be several types, as follows: a formal PLC decision checkpoint, a progress and status update, or an unplanned review due to issues needing immediate attention. Formal PLC reviews are critical checkpoints in a program in which senior management approval is needed to progress from one phase of development to the next. Progress and status reviews are used to keep senior and functional mangers informed of program status. Depending upon the number and frequency of formal phase/gate reviews, a company may or may not employ progress and status reviews. As an example, Daimler-Chrysler's phase/gate process has ten formal gate reviews. Due to this high number of decision checkpoints, the program team is free to operate without progress and status reviews between gates.[125] By contrast, Intel has only four formal gate reviews in their PLC process and employs monthly progress and status reviews between gates.[126] Unplanned reviews are required when the program team encounters problems or barriers to progress and requires senior management intervention to proceed.
Step 2: Determine the purpose of the review: One of the biggest complaints about most organizations is that there are too many meetings that waste time and reduce worker productivity. One of the easiest ways to combat unnecessary program reviews is to clearly determine the purpose of the meeting. As noted in the first step, the type of program review should be identified to drive the overall purpose of the review. For example, the purpose of a formal decision-checkpoint review will be to make decisions and obtain authorization from senior management. The purpose of an unplanned review may be to solve a problem or choose between multiple courses of action. Once the overall purpose of the meeting is determined, a clear statement of the review objectives and desired outcomes should be established.
Step 3: Determine the attendees: An important part of the program review, as well as the objectives and desired outcomes, is to determine the attendees. Careful selection of the presenters, reviewers, and decision makers will go a long way toward achieving a successful program review. Generally speaking, the smaller the audience and the fewer the number of presenters, the better.
Step 4: Create the agenda: An effective agenda is the means to achieve the objectives and desired outcome of the program review. The agenda should consist of a list of activities that needs to take place in the review to achieve the outcome. It is a good idea to include the type of action (for example, decision, authorization, action assigned to someone) needed for each agenda item. Most organizations use a predetermined agenda for formal PLC program reviews (see box titled, "Predetermined Product Program Review Agenda) and less formal agendas for progress and status reviews. Agendas for unplanned program reviews need to be created based upon the problem, barrier, or decision driving the need for the review.
Step 5: Conduct the meeting: Begin the program review by communicating the purpose (objectives and desired outcome) of the review and stating the agenda items. Next, clarify the participant roles, identify the decision makers, and set the ground rules for engagement. The role of the individual chairing the review is to keep the discussion on target, ensure all points of view are heard, and make sure the desired outcomes are achieved. It is highly recommended that a common format is used and consistent information is presented for each program under review. Prior to closing the program review meeting, all decisions should be noted and documented and all action items assigned—relative to what is to be accomplished by whom and by what due date.
Step 6: Document the program review meeting results: At the close of the program review meeting, it is generally the responsibility of the meeting chairperson to document the results of the meeting. This person is responsible for keeping track of all the key decisions and actions directed by senior management relative to each program. A copy of the notes of this meeting should be disseminated to all parties who are being directed to take action, as well as a copy to all interested senior managers. The meeting chairperson should also follow up on all key actions with the specific owners to check that they have appropriately accomplished their action item. Unresolved issues from the program review meeting normally are addressed at the next review. See the example below for an example of monthly program review notes.
As pointed out earlier, there are several events that may require formal program reviews. Generally, they should be used as required by the formal development process utilized by the firm, or when unplanned events occur and either senior management or program management deems that the program needs intervention by senior management.
A consistent program review format can greatly reduce the amount of preparation time prior to the review. With this in place, preparation for the review can be completed within two hours. Time to conduct the review varies from organization to organization, but a good rule of thumb is 30–40 minutes is adequate to review a single program.
The program review facilitates the flow of program information between the program team, senior management, and key stakeholders of an organization. It keeps senior management fully involved in the development process early and often during the PLC. It helps clarify the role of senior management as reviewers of program information, decision makers at key phase transitions, and problem solvers when risks and barriers are encountered by the program manager and his or her team. Also, it distills discipline by requiring that the program manager continuously knows and is able to communicate the current state of all aspects of a program; it is also an effective tool for communicating and resolving program risks and barriers to success.
The advantages of the program review include the commonality and consistency of both format and content of program status. However, without commonality and consistency of both format and content, the program review can be time consuming and an overhead burden for the program manager.
The formal program review is a useful tool for program managers to communicate program status and progress of a program, or to deal with specific unplanned events in which management intervention is necessary. The program review helps to ensure senior management of an organization is actually involved with the program and fulfilling their role as decision maker and champion.
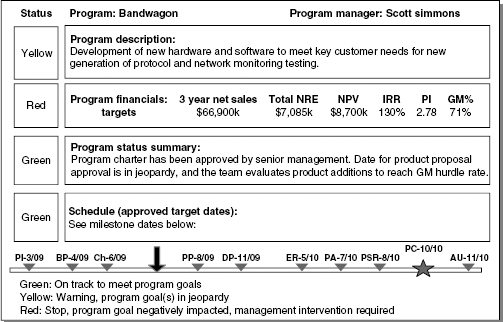
The Program dashboard highlights and briefly describes the status of the program by reporting on progress toward achievement of the major business goals of the program. Colors—green, yellow, and red—are used to indicate the progress toward reaching the program goals. Green indicates the program is on track to meeting the goals, yellow indicates a goal is in jeopardy, and red indicates a goal has been compromised and immediate action is needed to recover (see Figure 11.4). The use of colors to indicate program status reminds many users of the automobile dashboard, in which color lamps indicate the status of all major car systems, hence the name of this tool.[127] A program summary that includes status of work completed, significant accomplishments, and risks and issues currently being addressed by the program team may also be shown. At times the program dashboard predicts trends and states actions required to overcome issues and reverse negative trends. In this case, the program dashboard is used to predict the future state of the program based upon past and current performance. The program dashboard can be used for individual programs and also for multiple programs under way to give senior management a quick understanding of the status of all programs within their organization. This broader use of the tool is covered under variations in a later section.
The program dashboard can be developed to show a concise overview of a program's status and, in doing so, serve as a primary communication device between the program manager and all program stakeholders. Development of the program dashboard involves the following steps:
Prepare information inputs
Design the dashboard
Determine the variance
Identify issues and risks
Predict trends
Specify actions
Step 1: Prepare information inputs: Producing a meaningful dashboard is dependent upon the following program information:
Integrated program plan
Work results and program records
Proactive cycle of program control (PCPC). This is needed only in case of the proactive program dashboard (see Chapter 7)
The program plan with various baselines—business goals, cost, schedule, and so on—is necessary to compare actual progress of the program against planned expectations, assess performance, and indicate current status of the program. The actual state is derived from work results and other program records such as minutes of meetings and progress statements.[128]
Literally, the program dashboard's design is no more than an application of the proactive cycle of program control, a control method that includes the following five steps:[129]
What is the variance between the baseline and the actual program status (program status summary, program financials, schedule, and program cost)?
What are current issues causing the variance (program status summary)?
What risks may pop up in the future and how could they further derail the program (program status summary)?
What is the trend—the predicted completion date, budget, scope, and quality—if current issues and risks persist (program status summary)?
What actions should be taken to prevent the red light events from happening and deliver on the baseline plan (program summary status)?
Obviously, the majority of the questions are about the program future, attesting to our intent of giving the program dashboard a proactive nature. With all this information in hand, the PCPC can be utilized to provide the algorithm for processing information in the dashboard.
Step 2: Design the dashboard: The starting point for designing the dashboard is determining which stakeholders will receive the information communicated by the program dashboard (for example, business-unit general manager), and what information they wish to see. For example, they may use the program dashboard to measure the progress of a program toward its contribution to the company strategic goals. The stakeholders' informational needs drive the design in terms of the purpose, functionalities, frequency, responsibilities, and distribution of the program dashboard. Consistent design in the form of format and content enables comparison with current, previous, and future program dashboards for all programs.
Step 3: Determine the variance: This step determines the variance between the program baseline and the actual program status. A comparison of the baseline plan and the actual work results should easily yield the variance, which is the difference between the two. Once the variance has been determined, use a scale that translates the amount of variance into a status color. For example, a schedule variance of more than 5 percent behind the program plan yields red-light status indication. Referring to the example program dashboard in Figure 11.4, status indicators are shown for the program status summary, program financials, schedule, and cost.
Step 4: Identify issues and risks: If there is an unfavorable variance, the issues causing the variance need to be identified in the program dashboard. Additionally, the most critical risks for the program (determined from the P-I matrix) need to be identified. Current issues are meant to communicate the present problems that the program team is dealing with and what the impact is on the program. Program risks look into possible future troubles and assess the potential impact. In Figure 11.4, this would be shown in the program status summary box.
Step 5: Predict trends: What is the trend—the predicted financials, schedule, and cost—if current issues and risks persist (see box titled, "Forgetting Trend Analysis: Déjà Vu?"). Although forecasts of this type are notoriously vulnerable, their essence is less in their accuracy and more in creating early warning indications of where program results may end up if the issues and risks are not resolved and mitigated.
Step 6: Specify actions: If trends are unfavorable, what actions should be taken to prevent them and deliver on the program baseline? With a look into the future, we need to specify corrective actions, assess the impact, and assign the owner. Along with the trend, the specification of corrective actions is perhaps the most valuable part of the dashboard.
All programs, small or large, can benefit from the use of the program dashboard to evaluate and communicate program performance. It is effective if the program dashboard is completed and presented as an element of the communication section of the program plan to establish a baseline for program status. Post-baseline plan approval, the program dashboard is the primary tool for determining and communicating program status throughout the remainder of the PLC. Pressed for resources, small programs can gain additional benefit from the program dashboard by using it as the only program status reporting tool.
One hour is normally sufficient for a program team—on a simple and small program—to prepare a program dashboard. Even as preparation time requirements increase with the size and complexity of programs, it is clear that a few hours of a large program team's time should suffice for the program dashboard production, with additional time required to develop backing data.
If the time spent on the development of the program dashboard is viewed as an investment, then return on this investment can be lucrative in multiple ways. First, the program dashboard process ensures proactive cycle of program control. Second, the tool is a vehicle to preserve stakeholders' involvement in the program.[131] Third, the program dashboard instills discipline, takes out daily firefighting of program problems, and introduces the clear essence of program management—think, predict, act. Fourth, by covering program status on a single page, the program dashboard provides the crucial points of the program status, while enabling senior management to review performance progress and trend at a glance.
Major advantages include simplicity and visual power, enabling readers to easily glance and grasp where the program is and where it is going. Preparation of the dashboard may be a disadvantage because it is time consuming for larger programs. This is a trade off worth taking when one is aware of the program dashboard's benefits.
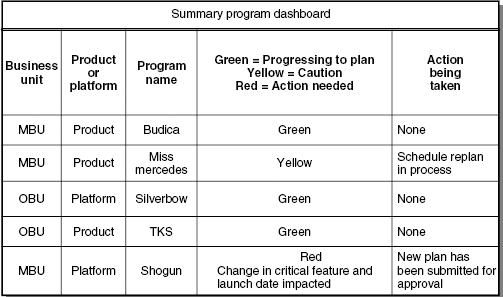
A significant variation of the program dashboard used in many organizations is a dashboard targeted at multiple programs that are simultaneously under way in the organization. (see Figure 11.5). It contains many of the same elements as the individual program dashboard but is primarily focused on a quick understanding of the status of the program. Senior management can quickly determine if the program is tracking as planned or is in need of their intervention due to problems outside the span of control of the program manager and team. Generally, the summary dashboard is focused on the key success criteria, as described in the program strike zone.
The program dashboard is a tool that highlights the status of the program, predicts trend, and states actions to overcome negative trends. Several benefits may ensue. First, the process that results in the program dashboard development ensures PCPC. Also, the dashboard helps preserve stakeholders' involvement in the program and creates a historical trail and record. In addition, the program dashboard instills discipline in reporting program status. Below we highlight the key points about the dashboard.
Details on situations in which to use each of the tools are described in Table 11.2. Specifically, we've identified several program situations and indicated how each one favors the use of the particular tools. If they do not provide enough details to decide which tool to deploy, brainstorm to identify more situations. Indicate which tools will support each program situation and then choose between the options.
As is the case with strategic tools, operational program management tools support a specific program management deliverable. Fundamentally, everything accomplished on a program has a business purpose. Hence, the crux of employing operational tools is to improve business results related to programs.
By keeping a program aligned with the business objectives, setting and communicating the vision for the program team through the elements of program success, and fostering the concept of "no surprises to management," the program strike zone results in an efficient means of elevating critical issues and barriers for rapid decision making and resolution. This creates the climate for improved business results.
The program map with its cross-dependencies enables a clear sequence of the program implementation, established commitments for each project team, and critical interactions between PCT members. For example, it is likely that target profitability for a program is not going to be achieved, if the sequence of implementation or which functional team provides what deliverables is unknown. In contrast, if the sequence and owners of deliverables are known and there is adequate management of the program, it is likely that there will be better business results.
Table 11.2. A Summary Comparison of Program Management Tools
Situation | Program strike zone | Program map | P-I matrix | Program review | Program dashboard |
|---|---|---|---|---|---|
Indicate critical success factors | ✓ | ✓ | ✓ | ||
Show how to achieve business results | ✓ | ✓ | ✓ | ||
Indicate critical cross-project dependencies | ✓ | ||||
Show implementation sequence | ✓ | ||||
Need focus on most critical risks | ✓ | ✓ | |||
Treat risks independently from one another | ✓ | ||||
Show go, no go points, and major events | ✓ | ||||
Provide built-in proactive approach | ✓ | ✓ | |||
Display trend | ✓ | ✓ | |||
Provide early warning signal | ✓ | ✓ | |||
Short time to train how to use the tool | ✓ | ✓ | ✓ | ✓ | ✓ |
Take little time to apply | ✓ | ✓ | ✓ | ✓ |
When we use the P-I matrix it helps us sift through the myriad of uncertainties and pinpoint and highlight the program areas of highest risk. The purpose is to prevent the risks from turning into problems later in the program and diminishing the business results. If we successfully deploy the risk plans and avoid the problems, we will accomplish better business results, such as faster time-to-money performance.
If there is a constant flow of program information between the program team, senior management, and key stakeholders of an organization, it is quite clear that the business results are likely to be better. For example, the information provided by the program review at key phase transitions or when risks and barriers are encountered by the program manager will definitely ensure better decision making and problem solving and, thus, improved business results.
The program dashboard is useful because it provides improved information of the essence of PCPC—plan, detect, predict, and act—and stakeholders' involvement in the program and the team cohesion. Therefore, the point is to have a high-quality program dashboard, to help improve business results that a program generates. A simple example is a dashboard that tracks the staffing levels for the program team. If the level is too low, and the dashboard indicates it, a triggered corrective action will improve staffing and, consequently, enable achievement of better-related results such as time to money.
The five operational program management tools—program strike zone, program map, P-I matrix, program review, and program dashboard enable the program manager to effectively define, plan, monitor, report, and control progress of individual programs.
Each of the five tools comes with a purpose. The program strike zone identifies the program's critical success factors. The program manager can use the program map to find the critical cross-project dependencies within the program that need to be coordinated, and the P-I Matrix is used to pinpoint and highlight the program areas of highest risk. When the program gets under way, the program review is employed to verify phase gates and other major program events. In between those major program events, the program dashboard helps report program status. Using all the tools as a toolset is preferred, although they may be employed individually.
Program Management in Practice
Using Tools on a Mercedes
Sabin Srivannaboon and Dragan Z. Milosevic
Prologue
This industry example focuses on a company called Rolling Sys. This U.S.-based company is relatively small, with approximately 1000 employees, but is a market leader in the design and manufacturing of embedded computers. The company is highly advanced in its program management practices and provides an excellent example of the effective use of program management metrics and tools.
This example first demonstrates how business strategy should drive the selection of metrics and tools. RollingSys pursues an first-mover business strategy based upon technology innovation and fast time-to-market delivery. Priority selection of schedule performance, features, gross margin, profitability index, development expenses, manufacturing costs, market share, and resource allocation metrics support this strategy.
The alignment process of the Miss Mercedes program is also discernable. The business strategy begins with the strategic plan and continues with the selection of strategically focused tools such as the portfolio map and business case.
This example also demonstrates the use of many operational tools presented in Chapter 11. For example, the program strike zone and program map are used during program planning, and the program dashboard is used for program monitoring and control. We also present a tool used by RollingSys called the wiggle chart, which is an excellent tool that supports proactive program management practices by providing program trends.
Finally, this industry example presents the use of some common tools such as the work breakdown structure and the program schedule. However, details about these tools are not covered in this book, as they are readily available in existing project management literature.
Background
RollingSys is a privately held corporation that provides computer solutions to help customers design, build, deploy, and manage next-generation numerically controlled tool machines. These products require a lot of customization, resulting in each order being organized as a program. For this reason, the products are well known and have earned many outstanding awards.
RollingSys has seen an increase of orders from Asia and Europe, which puts a lot of pressure on their six program managers. After a long discussion, a decision was made to hire Keith Richardson, an experienced program manager. Mick Beggar, the director of the program management office (PMO) for RollingSys, prepared a plan for Richardson to transition to the new job, including familiarizing him with RollingSys's program management system. Following is part of the familiarization relating to the strategy and program management tools and metrics. Taking part in the discussion are Richardson; Beggar; and Charles Waters, a longtime program manager.
All Roads Lead to the Business Strategy
BEGGAR: I want to make something clear from the very start. RollingSys's choice and application of program management tools, like all managerial processes and actions, is driven by the business strategy. Therefore, we should first talk a bit about RollingSys's real strategy—not the company's public relations word on strategy but such things as the company's strategic uniqueness and what makes it successful.
As director of the PMO, I often interpret the strategy of RollingSys to my program managers. So, at this time, I feel obliged to put on the hat of the director of PMO and explain the business strategy. First of all, RollingSys is unique in terms of breaking the components of the business down and understanding what makes it successful and what doesn't make it successful. Our products are often recognized as the best products on the market. If you think of an airplane seat analogy, they are in the first class-section. Also, the ability of RollingSys to get customer input makes a huge difference. What our customers want to use the product for often becomes clear through the ability of the company to get engineers in front of customers. Our business is moving from the old traditional 'here is the computer we build' to "what are the features you need in the computer we are going to build?." Moreover, we have repeatability across different product lines. The repeatability allows the company to shift the program manager from one product line to another with an adequate understanding of performance criteria and his or her responsibilities.
What, then, is RollingSys's business strategy, and what is the role of program managers in the context of such strategy? RollingSys is often a first mover, so it is technology innovation and to be first in time to market. In that context, the program managers are responsible for more than just getting from program start to program finish. They are required to deliver the program on time, meet all the objectives of the program, and are responsible for business results. Therefore, you are expected, as any other program manager, to be a visible and seasoned business manager, aligning your programs with the strategy.
RICHARDSON: That having been said, can we now talk about tools? I would like you to take an example of a program and tell me how using specific tools in that program helped make it successful. Give me the background of the program.
Miss Mercedes
WATERS: I suggest using a program called Miss Mercedes as an example. The customer had all sorts of requirements, one being the program name. They said, 'In our country, a Mercedes car is the ideal of high quality. We want this program product to be of high quality, like a Mercedes car. In order for you to keep our high-quality expectations in mind at all times, let's call this program Miss Mercedes.' Basically, they wanted to have a capability added to RollingSys's existing product. RollingSys got an opportunity to win a large competitive sale in Spain, if the program was delivered on the particular date. So, RollingSys formed a team to execute this program. I was the program manager for it.
The program went from conception to completion in eight months, which is not normal. It is probably the best example of how our process works at optimum. More importantly, it brought the company several million dollars in revenue to date. In RollingSys, managers believe that the program was successful partly because it used all the tools of the program management knowledge base that's available at the company. So there is a belief that the program management system as a whole works very well here.
Selecting and Approving a Program
RICHARDSON: Can you explain what strategic tools were used in Miss Mercedes to make sure that it was well aligned with RollingSys's business goals and strategy?
BEGGAR: RollingSys uses both strategic and operational tools, divided per major program activities. But there is a word of caution here. Typically, program managers would not be involved in the development of strategic tools. Generally, executives do them. However, each program manager needs to know them well because he or she will use them in communicating with executives about program status.
The whole alignment process begins with the strategic plan and continues with portfolio maps and the business case. RollingSys's practice differs from some companies in, for example, the business case. The strategic plan drives the alignment. In other words, it is a tool or mechanism to ensure the quality of the alignment in RollingSys.
RollingSys's strategic plan usually includes the product road map, technology road map, customer-technology road map, and the business model for the next three years. It addresses things like mission, objectives, long-term strategy, market size, segmentation, competition assumptions, and market share. In particular, the product road map proposes products within the three-year time frame and addresses those currently in development. For each product, it includes start and completion dates, milestone dates, total nonrecurring expenditure, and the three-year sales forecast.
The strategic plan of RollingSys drives its formal portfolio management process, where programs are prioritized in terms of the program portfolio needed for customers and for the business. Miss Mercedes was no exception. It was a program selected from the product road map and prioritized in the portfolio process, and its implementation was sped up by the customer requirement.
Generally, executives focus on the strategic plan to analyze the growth plan and determine what the right markets are for the company, where the company is the most successful, and where the customer gets the greatest value for the products. Then, the programs are planned in alignment with the strategic plan over the next three years with their expected sales and profit dollars identified. By looking at them, we are able to see the growth from different directions, such as its existing business (extend or upgrade), new products in new markets, and pure technology transition. As a result, the importance of certain products becomes more obvious than others. Then, depending on product complexity, market pressure, and other significant factors, programs are initiated and selected into the program portfolio. We don't really use any specific tools for the selection of a program into the portfolio, but there is a lot of discussion. Once a program is selected into our portfolio of programs, we use a tool called a portfolio map to display all of our selections. Each one has different parameters on x- and y-axis, for example, net present value (x-axis). The portfolio map helps us to balance the selected programs by visualizing all selected programs, comparing them, and seeing where we have to intervene to achieve product balance. This is very important for our organizational success.
Now, we begin to develop the business case for programs close to their implementation time. Some companies, as I said, use the business case differently than we do. They use it to select programs into the program portfolio. We use it to approve a program for actual implementation in the concept phase. If we do a good job using this tool, i.e., the business case, we will give the go-ahead to good programs and kill poor programs. So, the business case tool is of make or break importance to our program success. Choose a poor program, and you are kind of doomed. Choose the right one, and you are given an opportunity to succeed. Our program managers tend to be assigned to a program shortly after a concept is approved and are responsible for successful completion of the program. They will make trade-off decisions on features to make sure that the plan is actually aligned with its objective.
Program Planning
RICHARDSON: Once you selected a program into the portfolio and a program manager was assigned to execute program, what tools did you use to ensure the quality of the alignment during program planning, and how did they contribute to the program's success?
WATERS: A lot of tools were used in Miss Mercedes. First, a tool called the program strike zone was used. The strike zone is simply a set of agreed upon program critical success factors and business results established to help executives and program managers monitor the programs by specifying quantitatively the boundary conditions under which the program can operate. Metrics such as time to market, target market, net present value and key milestone dates were included in the strike zone. In Miss Mercedes, the priority success factors were schedule, features, profitability. You see here how the business strategy (i.e., time to market) shapes the program strike zone, making schedule its first priority. Simply speaking, it was our primary alignment tool, and it helped me to develop a program plan and, at the same time, make sure that the program met the business needs. By doing all this, the program strike zone contributed to a successful program.
During a one-day workshop called Map Day, the core team developed a program map, which is a tool showing critical cross-project dependencies related to the program schedule and the critical deliverables of each project team throughout the PLC. The program map was used for two things:—to do a program preliminary work breakdown structure (WBS) and a preliminary master program schedule. Actually, the critical deliverables went into the WBS, which then served as a guideline to project teams to develop their project WBSs, which I took back and, after a thorough review with project managers, merged into a detailed program WBS.
Based on the critical cross-project dependencies from the program map, the initial program schedule was developed. Once the master program schedule was completed, it was decomposed into the seven project schedules. In this way, a hierarchical schedule with two levels was obtained—the first being the master program schedule, the second being the project schedules.
In terms of scheduling, standard project management tools were used for the master program schedule and the project schedules. The business strategy of being the first in time to market had a key role in determining which tool was chosen.
Program Monitoring and Control
RICHARDSON: What about tools used for monitoring programs?
WATERS: One of the tools we use is called the program dashboard. The dashboard is a management tool visualizing the status of programs, by using red, yellow, and green indicators. Red means management intervention is needed, yellow means warning, and green means that the program is progressing well. Tools like the dashboard and the program strike zone are commonly used everywhere in the organization to help executives communicate with program managers. The executives want to see if the programs are still aligned with the business strategy and determine if any corrective actions are needed to recover them from misalignment. In many instances, when there's an issue that pushes the program out of the success criteria limits, one of the program indicators will turn red. Then, executives and program managers will have to develop corrective actions and/or adjust the success criteria limits.
In Miss Mercedes, we also used the program review, which is a tool used to communicate program progress or to involve senior management when they to need to step in and make some tough decisions. We used periodic program reviews, in addition to the phase gate milestone reviews.
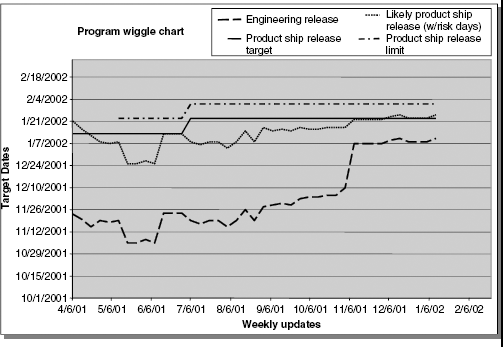
Lastly, a mandatory tool we use is the wiggle chart. The chart anticipates the expected rate of future program progress, focusing on predictions of major program events, like milestones and program completion. Let me show you an example (Figure 11.6). The vertical axis shows the team's predicted completion date for a specific program milestone (for example, the engineering release or product ship release), while on the horizontal axis we can see the actual date the prediction was made. The beginning point on the horizontal axis is the time when the schedule baseline is prepared and the high-level program milestone dates are marked on the vertical axis. After the beginning point, the program work is kicked off, and the horizontal axis represents the actual program timeline. The team reviews progress regularly and makes milestone predictions. By connecting all predictions for a particular program milestone into a line, we can obtain the milestone trend line. Should the line go upward, the program manager would know that there is a milestone schedule slip. Delivering the program milestone on time would produce a horizontal line. If we estimate an early program milestone completion, the trend line would go downward. Although it is effective in predicting milestone progress, the chart is even more effective if used to develop actions required to eliminate any potential deviation from the baseline schedule. In general, the wiggle chart acted like a compass, helping Miss Mercedes by warning us early of potential schedule slips so we could take corrective action and navigate toward success.
Metrics
RICHARDSON: I read somewhere that man is a tool-using animal. In Miss Mercedes, you seem to confirm that. Now, what about metrics? Could you please elaborate more on the topic with regard to balancing the program and company needs, and how they helped the program success?
BATTS: Program performance is mostly measured by the ability of the program to meet major milestones, such as the launch target date. Since RollingSys wants to be a first mover and technology innovator, other metrics are important but not as important as schedule metrics. But there are some differences among programs and the metrics they focus on.
For example, in Miss Mercedes, the priorities of metrics were schedule, features, gross margin, PI (profitability index), development expenses, manufacturing costs, market share, and staffing levels. The schedule was so important that progress was measured by the ability to meet the milestones and delivery date, together with the feature sets requested from customers. In parallel with satisfying customer needs, the company's bottom line is of primary concern. So executives use the program strike zone to specify the boundary conditions that match the company's business needs, like ROI, in the form of the PI, or profitability index. The other metrics such as performance to development cost, manufacturing cost, and market share were of second level importance compared to time to market, feature set, gross margin, and PI.
Overall, what I am trying to say for Miss Mercedes is that customer needs, time to market, and feature set are balanced with our business needs, which is to make money—to be brutally honest. We combined those things together and created the business results. That also has another loud message: Our metrics, like tools, were driven by the business strategy. We did this properly, and metrics contributed to the program success by letting us know if we were heading to success and should stay the course, or if we needed to take corrective action.
[121] Martinelli, Russ and Jim Waddell. "The Program Strike Zone: Beyond the Bounding Box". Project Management World Today (March-April 2004).
[122] Vose, David. Risk Analysis: A Quantitative Guide, 2nd edition. Hoboken, NJ: John Wiley & Sons, 2000.
[123] Milosevic, Dragan Z. and P. Patanakul. Standardization May Help Development Projects, International Journal of Project Management, Vol. 23, No. 2 (2005).
[124] Meredith, Jack R. and Samuel J. Mantel Jr. Project Management: A Managerial Approach, 6th edition. Hoboken, NJ: John Wiley & Sons, 2006.
[125] Concurrent Engineering User Group Benchmarking Study. Detroit: MI. (September 2005).
[126] Martinelli, Russ and Chris Galluzzo. "Program Management and the Intel Product Life Cycle", Conference on Project and Program Management. Portland, OR. (July 2002).
[127] Meyer, Chris. "How The Right Measures Help Teams Excel", Harvard Business Review (May–June 1994): pp. 95–103.
[128] Wideman, Max. Project and Program Risk Management. Newton Square, PA: Project Management Institute, 1992.
[129] Milosevic, Dragan Z. Project Management Toolbox: Tools and Techniques for the Practicing Project Manager. Hoboken, NJ: John Wiley & Sons, 2003.
[130] Summers, Donna C. S. Quality, 2nd edition. Upper Saddle River, NJ: Prentice Hall, 2000.
[131] Meyer, Chris. Fast Cycle Time: How to Align Purpose, Strategy, and Structure for Speed. New York, NY: Free Press Publishers, 1993.