In this chapter
| Introduction |
| Inside the Microsoft Dynamics AX 2012 reporting framework |
| Plan your reporting solution |
| Create production reports |
| Create charts for Enterprise Portal |
| Troubleshoot the reporting framework |
Reporting is critical for any organization because it is a primary way that users gain visibility into the business. Reports help users understand how to proceed in their day-to-day work, make more-informed decisions, analyze results, and finally take action. Microsoft Dynamics AX 2012 provides a variety of reporting tools that developers can use to create appealing and useful reports for both the Microsoft Dynamics AX Windows client and the Microsoft Dynamics AX Enterprise Portal web client.
Microsoft Dynamics AX 2012 and Microsoft Dynamics AX 2012 R2 have introduced some important enhancements to the Microsoft Dynamics AX reporting framework.
Microsoft SQL Server Reporting Services (SSRS) was introduced in Microsoft Dynamics AX 2009. In Microsoft Dynamics AX 2012, the SSRS reporting framework has become the primary reporting engine for Microsoft Dynamics AX. The SSRS platform provides customers with access to an expanded pool of resources, including developers, partners, and documentation to support this standard industry solution.
Note
Microsoft Dynamics AX 2012 continues to offer the MorphX platform as a fully integrated solution and to allow customers enough time to transition their existing reporting solutions to the SSRS framework.
Microsoft Dynamics AX 2012 also offers enhanced integration with Microsoft Visual Studio 2010. New Visual Studio report templates are available for Microsoft Dynamics AX, and you can use Visual Studio to create both auto-design and precision design reports more easily. The Enterprise Portal (EP) Chart Control is a new chart data visualization tool introduced in the Microsoft Dynamics AX 2012 R2 release. This tool provides a high-performance alternative to SSRS reports in Role Centers and other pages in Enterprise Portal. The EP Chart Control is the recommended solution for interactive presentations for large volumes of data in Enterprise Portal. This new utility is an extension of the ASP.Net Chart Control and provides access to all of its underlying functions, including 35 distinct chart types. The EP Chart Control provides automatic element formatting to make charts look appealing and offers declarative solutions for accessing Microsoft Dynamics AX data that is captured in both online analytical processing (OLAP) and online transaction processing (OLTP) databases, simplifying the developer experience.
This chapter focuses on using Visual Studio to create SSRS reports for the Microsoft Dynamics AX client and charts for EP. For a complete list of new developer features for this release, see “What’s New: Reporting for Developers in Microsoft Dynamics AX 2012,” at http://msdn.microsoft.com/en-us/library/gg724100.aspx.
This section compares client-side and server-side reporting solutions, and provides insights into how the Microsoft Dynamics AX reporting framework offers seamless integration that enables easy access to OLTP data and aggregated data that is managed in SQL Server Analysis Services (SSAS). This section also identifies the key components of the Microsoft Dynamics AX 2012 reporting framework and describes their functions.
In the realm of reporting, there are two primary architectures to compare when considering a solution: client-side and server-side. Briefly stated, client-side reporting uses the power of the client to carry the bulk of the load when reports are constructed. The MorphX reporting framework is an example of a client-side reporting solution. For the most part, server requests are made simply to access the data. Server-side reporting, on the other hand, uses various server resources to aid in the processing and construction of a report. The Microsoft Dynamics AX 2012 reporting framework is a server-side reporting solution. As you might expect, there are many trade-offs between the two models. The next sections discuss some of the benefits and limitations that are associated with each design.
As mentioned earlier, the MorphX framework is a proprietary client-side solution that is fully integrated into the Microsoft Dynamics AX integrated development environment (IDE). In this model, reports contain references to data sources that are bound to local Microsoft Dynamics AX tables and views. They also define the business logic.
Figure 9-1 illustrates the architecture of a client-side reporting solution.

The key benefits of a client-side reporting solution include the following:
Business logic is executed along with the design definition, allowing for programmable sections in reports.
No deployment is needed: you import the report, and it’s immediately available to the client.
X++ developers can use familiar tools to construct report designs.
Notable disadvantages of a client-side reporting solution include the following:
Client components must be installed for a user to be able to view a report.
Users outside the domain, (outside the network boundary shown in Figure 9-1), must connect to a Microsoft Dynamics AX client through Remote Desktop Connection to access reports.
Access is limited to the data that is accessible from the client.
Components such as business logic, parameter management, and designs cannot be shared across reporting solutions.
SSRS, the primary reporting platform for Microsoft Dynamics AX, is a server-side reporting solution. This framework takes advantage of an industry solution that offers comprehensive reporting functionality for a variety of data sources. This platform includes a complete set of tools that you can use to create, manage, and deliver reports. With SSRS, you can create interactive, tabular, graphical, or free-form reports from relational, multidimensional, or XML-based data sources.
Figure 9-2 illustrates the architecture of a generic server-side reporting solution.

The key benefits of a server-side reporting solution are as follows:
It provides access to external data sources, including SSAS and web services.
It supports reporting in thin clients, with no additional client components required. Users outside the domain (shown as the network boundary in Figure 9-2) can connect to Enterprise Portal to access reports, instead of having to connect remotely to the Microsoft Dynamics AX client, as in a client-side reporting solution.
The workload for report rendering is performed on the server.
Design caching improves the overall performance of report generation.
The key limitations of a server-side reporting solution are as follows:
Figure 9-3 illustrates the architecture of the Microsoft Dynamics AX 2012 reporting framework.

The following list corresponds to the numbered items in Figure 9-3:
Menu item An entry point into the report execution sequence. Menu items contain predefined hyperlinks that are used to instantiate and execute reports. Configuration keys can be linked to menu items to manage user access.
Report definition (.rdl file) An XML representation of an SSRS report definition, containing both the data retrieval and design layout information for a given report.
Application Object Server (AOS) The core of the Microsoft Dynamics AX server platform. The query web service is used to access OLTP data.
Customization extension Design customizations are applied to produce a personalized view of the report.
Report viewer The report is rendered for the user in the client.
Applying a well-thought-out design will greatly simplify the development process and ongoing task of maintaining your report. This requires planning based on your unique set of report requirements.
You can create two types of reports in Microsoft Dynamics AX: production reports, which present data that is predefined, and ad hoc reports, which present data that is selected by users. When planning out your reporting solution, ask yourself the following questions:
You can categorize reporting functions on two axes: data depth and business activity. As shown in Figure 9-4, the roles that users play in an organization and their unique reporting requirements fall at one point (or perhaps several points) on these axes.

Figure 9-4. An illustration of how users in various business roles work with different views of business data that require different kinds of reports.
Here are some details about the reporting needs of the roles shown in Figure 9-4:
The CEO, who is interested in monitoring the health of the business, periodically uses strategic reports that provide summarized views of data across time periods.
The analyst examines the business, looking for patterns that might lead to a change in business plans and priorities. Analysts rely on reports that allow the data to be interactive, so that data can be sliced by department or region. They also value visuals that simplify the process of detecting patterns and trends that may feed into the CEO’s decisions.
The shop floor worker is primarily concerned with the day-to-day activities of the business and uses reports that reflect the immediate needs of his or her area. An inventory list is a simple type of report that the shop floor worker finds great value in.
The role of report developer can literally be split into two distinct functions:
Constructing the report dataset This task consists of identifying all data elements that are either visualized in the report dataset or used to support user interactions. This task is well suited to developers who are familiar with the MorphX development environment and the structure of the customer’s business data.
Defining the report design Authoring report designs requires familiarity with the report design experience provided by Visual Studio 2010.
Dividing these tasks among more than one individual is ideal because it encourages a clear separation between the business logic and the presentation layer.
Figure 9-5 provides a high-level view of the report development process.
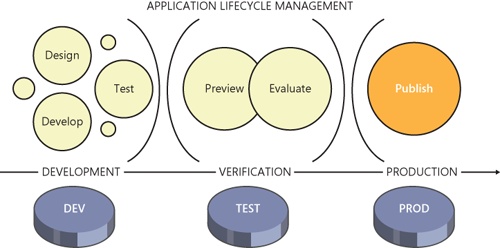
Traditionally, reports are developed in a contained environment that is shared by a team of developers. When the developer feels that the solution satisfies the reporting requirements, he or she uses the Visual Studio tools to publish the report in the DEV, or development environment, for verification from within the client. When the developer is satisfied, the reporting project is packaged as a model or project and moved into the TEST environment. This is where the new report is put to the test in a simulated production environment, to ensure that both the functionality and performance are sound. Finally, the report is published to the PROD, or production environment, so that it is accessible to the designated set of users.
To learn more about creating a report for Microsoft Dynamics AX by using Visual Studio 2010, see the detailed step-by-step instructions in the reports section of the Microsoft Dynamics AX 2012 SDK at http://msdn.microsoft.com/en-us/library/cc557922.aspx. These topics have comprehensive descriptions for all the core scenarios that report developers are likely to encounter.
You use Visual Studio 2010 to create and modify Microsoft Dynamics AX SSRS reports. In Microsoft Dynamics AX 2012, the report development tools have been augmented to offer a fully integrated experience. These tools provide report designers the benefit of working with the familiar Visual Studio 2010 IDE and the ability to use the rich reporting features in SSRS.
The Microsoft Dynamics AX 2012 report development tools offer a model-based approach for creating reports that is based on fully customizable templates that define the layout and format of the reports.
The Microsoft Dynamics AX reporting development tools consist of a modeling tool, Model Editor, that you can use to visualize the report elements as you develop a report. The reports that you create are stored in the Report Definition Language (RDL) format specified by SSRS. By using this widely adopted format, you can take advantage of the many features (for example, charting, interactivity, and access to multiple data sources) that make SSRS a popular choice for production reports. You can store, deploy, manage, and process reports on the report server by using the integrated Visual Studio report development tools.
The Microsoft Dynamics AX reporting tools also include a new Visual Studio project template called Microsoft Dynamics AX Reporting Project. This new project type simplifies the process of creating SSRS reports that bind to data in Microsoft Dynamics AX.
The Dynamics AX Reporting Project template has the following features:
It allows a report to retrieve Microsoft Dynamics AX data from the AOS by using either a Microsoft Dynamics AX query or a Report Data Provider object.
It defines the report parameters and layout of the controls.
It uses references to Microsoft Dynamics AX labels to produce localized strings based on the user’s current Microsoft Dynamics AX language.
It allows SSRS reports to be created and modified in the Application Object Tree (AOT).
It can be used to deploy report customizations to the report server.
Three basic components make up any SSRS report: the controls, the design definition, and, of course, the data:
The controls, often referred to as the parameters or inputs, can be either provided by the user or derived from the context of the session. For example, the reporting framework automatically selects the language for a report based on the user’s settings in Microsoft Dynamics AX. Controls are used to select the design, alter the format and layout of the report, and influence the dataset that is ultimately rendered in the report.
The design of the report contains a collection of elements, such as text boxes, tables, matrices, and charts that define the look and feel of the report. You construct the report design by using an augmented Visual Studio 2010 Report Designer experience.
The data to be displayed in a report can be derived from a number of sources, including the Microsoft Dynamics AX OLTP database, SSAS, external databases, .NET service providers, and XML data files. Datasets are used to establish data connections to various sources, and they can be used interchangeably by one or more report designs.
Figure 9-6 illustrates an example of a Report model in Visual Studio 2010, showing the three components of an SSRS report. The following sections describe each component in more detail.

Controls are used to filter the data that is displayed in a report, connect related reports, and control report presentation. For example, you can write an expression to change the font based on a parameter that is passed to the report. Design parameters can be directly bound to dataset controls or used in run-time evaluations that affect the report design. You use Model Editor to define the grouping and order of report parameters when a scenario is complex; for example, if you want to use multiple nested groups. The order in which the report parameters are listed in a group is the order that the user sees them on the report. This makes the grouping and order in Model Editor easy to see as you define the report. For more information, see “How to: Group and Order Report Parameters by Using Visual Studio” (http://msdn.microsoft.com/EN-US/library/gg731925).
A report design represents the layout of a report. A report can have multiple designs that share datasets and parameters. This is appropriate in scenarios where you have similar reports based on the same dataset. You can create the following types of report designs:
Auto design A report design that is generated automatically based on the report data. You create an auto design report using Model Editor. The auto design functionality provides an efficient way to create the most common types of reports, such as a customer list or a list of inventory items. An auto design layout consists of a header, a body that contains one or more data regions, and a footer, as shown in Figure 9-7.
You control the content that is displayed in each area in an auto design. For example, you can include a report title and the date in the header and display the page number in the footer, or you may not want to display anything in the header and footer.
The data regions that are displayed in an auto design depend on the datasets that you created when you defined the data for the report. When you define a dataset, you can specify the type of data region that will be used to render the data whenever the dataset is used in an auto design. Data can be displayed in table, list, matrix, or chart format. One way to create an auto design is to drag a dataset onto the node for the auto design in the model.
Precision design A report design that you create by using SQL Server Report Designer. Precision designs are typically used when a report requires a precise layout, as is the case for invoices or bank checks. With SQL Server Report Designer, you can drag fields onto a report and put them where you want them. A precision design is free-form. Therefore, the format of a precision design can vary, depending on the layout that is required.

A report dataset identifies the data that is displayed in a report. Dataset elements contain the information used to bind to a data source. After you define a dataset, you can reference the dataset when setting the Dataset property for a data region in the report design. If your report uses the predefined Microsoft Dynamics AX data source and a query that is defined in the AOT, be especially careful when updating the query in the AOT. For example, if you remove a field in the query and the field appears in the report, the report will display an empty column for the field. Whenever you make updates to a query, be sure to consider how those updates affect your reports. Updates to a query may also require updates to your reports.
The SSRS reporting framework supports five types of data connections:
Microsoft Dynamics AX queries Access OLTP data by using a modeled collection of field data and table display methods. Microsoft Dynamics AX query objects defined in the AOT are used to define the data source, including the fields that are returned, record ranges, and relations to child data sources.
Report data providers (RDPs) Access datasets derived from X++ business logic. An RDP data source is appropriate in cases where the following conditions are met:
You cannot query directly for the data that you want to render on a report.
The data to be processed and displayed is accessible from within Microsoft Dynamics AX.
SSAS OLAP queries Access pre-aggregated views of Microsoft Dynamics AX business data. Microsoft Dynamics AX includes more than 10 predefined cubes. Use an OLAP data source to access pre-aggregated business data. For more information about cubes, see Chapter 10.
Transact-SQL (T-SQL) queries Access data from external databases. With T-SQL–based connections, you can access data from external Microsoft SQL Server databases and use it within the report.
Internet services queries Use data methods to access the data feeds provided by Internet service providers. For example, you can access industry-related data to compare the health of your business against the competition.
You have the option of relying on a single data source or you can combine data derived from multiple data sources to produce the report dataset. Identifying the best fit to satisfy your data access requirements greatly simplifies the design development and experience and improves the functionality and performance of the report.
The Microsoft Dynamics AX reporting framework takes advantage of several custom extensions supported by the SSRS platform to provide a fully integrated reporting experience that automatically adheres to security access rights and data formatting standards. This section provides some insights into how the reporting extensions function in the Microsoft Dynamics AX reporting framework.
Figure 9-8 illustrates the standard report execution sequence without Microsoft Dynamics AX custom extensions. (Figure 9-11, later in this chapter, illustrates the report execution sequence with Microsoft Dynamics AX custom extensions.)

The Microsoft Dynamics AX Report Definition Customization Extension (RDCE) is a reporting framework component introduced in Microsoft Dynamics AX 2012. It is internal to the reporting framework and is not directly accessible outside the framework. This component enables the reporting framework to provide run-time design alterations based on Microsoft Dynamics AX metadata and security policies. Dynamic transformation of RDL is needed for the following set of actions:
Hide columns in reports if a user does not have access to those columns
React to metadata changes in Microsoft Dynamics AX
Use Microsoft Dynamics AX labels in reports
Automatically flip designs for Microsoft Dynamics AX languages such as Arabic and Hebrew, which require right-to-left (RTL) layouts
A typical reason for hiding a column is security. In Microsoft Dynamics AX 2009, if a user didn’t have access to a column, the data was not presented in the report but the column still appeared in the report (see Figure 9-9). This behavior is inconsistent with the legacy MorphX reporting framework and does not provide the ideal user experience.

In contrast, Microsoft Dynamics AX 2012 goes a step further and completely removes the column from the report design (see Figure 9-10). This is accomplished by means of the rendering extensions supplied by the reporting framework.

A number of features in Microsoft Dynamics AX 2012 require transformation of the RDL as part of the run-time processing. Conceptually, they are broken apart into separate RDL transformations; however, their implementation may be organized differently than the five discrete units shown in Table 9-1.
Table 9-1. RDL transformations.
Transformation | Auto design | Precision design | Transformation type |
|---|---|---|---|
Microsoft Dynamics AX labels | Yes | Yes | Text content |
RTL flipping | Yes | N/A | |
Auto size | Yes | N/A | Layout |
Field groups | Yes | No | Layout |
EDT column width | Yes | No | Layout |
EDT numeric formatting | Yes | Yes | Text content |
Task and role security | Yes | Yes | Layout |
Configuration keys | Yes | Yes | Layout |
Many reporting scenarios do not rely on run-time design alterations based on user context information; instead, they require fast performance because of their scale. This is the case for most document-based reports, such as those listing customer and vendor invoices, purchase packing slips, and checks. Although the overhead of dynamic formatting of report designs is barely noticeable in an interactive session, it may become an issue in bulk operations where a large number of reports are requested as part of a batch operation. The Microsoft Dynamics AX reporting framework includes a control in the Report Deployment Settings form (Tools > Business Intelligence Tools > Report Deployment Settings) that disables the custom rendering extensions for specific report designs. This setting is highly recommended for any large-scale transactional reports that run in batch operations and don’t require run-time design alterations.
If you select the Use Static Report Design check box in the Report Deployment Settings form, Microsoft Dynamics AX produces language-specific versions of the report design with labels and column sets fully resolved. This occurs the next time that the report is deployed to the report server. These reports are called static RDL reports. The Microsoft Dynamics AX reporting framework automatically uses the design that is appropriate given the context of the user running the report. However, no additional design alterations are performed when the report is invoked by the user. To make the report dynamic again, clear the Use Static Report Design check box or delete the entry in the Report Deployment Settings form.
Data processing extensions are used to query a data source and return a flattened row set. SSRS uses different extensions to interact with different types of data sources. A data source is simply the source of data for one or more reports. Data sources may be bound to Microsoft Dynamics AX or external databases, depending on the unique requirements of your reporting solution. Furthermore, you can display and interact with information from multiple data sources in a single report. Table 9-2 lists the types of data sources supported by the Microsoft Dynamics AX reporting framework.
Table 9-2. The types of data sources supported by the Microsoft Dynamics AX reporting framework.
Data source type | Data content |
|---|---|
Microsoft Dynamics AX query | Access Microsoft Dynamics AX data by using predefined queries in the AOT. |
Report Data Provider | Construct the data by using X++ business logic stored in specialized classes in the AOT. |
OLAP | Access pre-aggregated views of your business data through SSAS. |
SQL | Use T-SQL queries to access external databases. |
Data methods | Connect to .NET service providers by using C# business logic. |
The custom Microsoft Dynamics AX reporting extensions let you use a static design definition to produce dynamic reporting solutions that react to changes to Microsoft Dynamics AX metadata and user access rights.
Figure 9-11 illustrates the report execution sequence with the Microsoft Dynamics AX custom extensions in place.

This section discusses charting controls in Enterprise Portal and describes how they work. Charts provide a summary view of your data. With large datasets, charts often become obscured or unreadable. Missing or null data points, data types ill-suited to charts, and advanced applications such as combining charts with tables can all affect the readability of a chart. Before designing a chart, carefully prepare and understand your data and functional requirements so that you can design your charts quickly and efficiently.
Figure 9-12 shows some key elements that are used in a chart.

The Microsoft Dynamics AX chart development tools simplify the development experience, making visualizing data easier through the EP Chart Control. This .NET chart control is installed during setup and the reporting framework handles all the work to gain access to it. You have access to all the functions and event handlers provided by the ASP.NET chart control to produce interactive and graphically rich data visualizations. The reporting framework extensions also provide the following features:
Access to OLAP data sources by means of an MDX editor
Access to OLTP data by means of a data source provider picker
Built-in awareness of data partition integrations
Microsoft Dynamics AX security access rights and policies
Data formatting based on the Microsoft Dynamics AX Extended Data Type (EDT) definitions
The definitions for chart controls are maintained in the AOT and in a distributed development environment, you can share them as XPO files. They are available in the list of Microsoft Dynamics AX user controls in Enterprise Portal as soon as you save them in the AOT. EP Chart Controls are maintained in the AOT along with other types of Dynamics AX user controls and can be deployed directly from the Development Workspace.
Figure 9-13 illustrates how chart controls are managed in the AOT.

The Microsoft Dynamics AX development tools offer a new item template for Visual Studio called EP Chart Control (see Figure 9-14) to help get you started. This template contains all the required namespace definitions and the basic structure of a web control containing a single instance of the EP Chart Control.
The template adds an EP Chart Control to a project. The EP Chart Control has an empty chart area and series that are predefined. Pressing F5 starts the http://localhost script that you can use to debug your application. However, you will not see anything when you run your application because the series does not contain any data yet.

Note
If you encounter the error “Server Error in ‘/’ Application,” see the discussion of troubleshooting Microsoft SharePoint sandbox issues in the section Troubleshoot the reporting framework, later in this chapter.
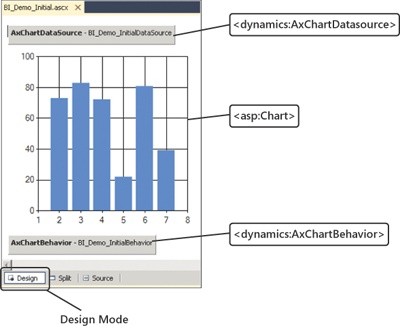
The standard ASP.NET chart control is represented in ASPX markup code by the <asp:Chart> element. In Visual Studio, the markup for the EP Chart Control includes two additional controls: <dynamics:AxChartDatasource> and <dynamics:AxChartBehavior>. You use these three elements in concert to define the appearance and functions of the EP Chart Control and manage the connection information to the underlying data source.
<asp:Chart> Maps to the ASP.NET chart control that is available as a download for Microsoft.NET Framework 3.5 and included with .NET Framework 4.0. This element is used to define the general structure of the control. For more information, see “Technical Reference: Chart Controls,” at http://msdn.microsoft.com/en-us/library/dd456726.
<dynamics:AxChartDatasource> Contains the data source connection type, along with the query that is used to access the data. This element is also where access parameters are defined to construct the query, if required. You can access the Visual Studio tools for defining data connections to Microsoft Dynamics AX data through the web control designer for this element.
<dynamics:AxChartBehavior> Supplies default formatting for chart controls. You can use this element to define custom color palettes for your chart solutions or to disable the reporting framework’s default formatting engine. You also use this element to define the structure of static and dynamic datasets by means of element properties.
Figure 9-15 contains a screenshot of the EP Chart Control in Design mode.
The first task in creating a chart control is to bind the chart control to the dataset. The Visual Studio development environment has been extended to include tools to simplify the process of binding to Microsoft Dynamics AX data. Two categories of data sources are derived from Microsoft Dynamics AX:
OLTP data sources Data that is managed in the AOS exposed through the AX Query Service interface. Declarative connections to Report Data Providers are made available using data source picker control.
OLAP data sources Aggregate data managed by the Microsoft Dynamics AX analytics framework. The Visual Studio extensions offer an MDX editor to help you create queries to access data stored in an SSAS database.
This section summarizes basic data binding strategies that you can use when visualizing data with charts. The EP Chart Control supports three basic data binding scenarios: single series datasets, multiseries datasets, and dynamic series datasets.
In a single series dataset, the source data for the chart can be described by using only two columns, as shown in Figure 9-16. A single series dataset is most commonly used when figures have a single pivot; for example, trending over time or distribution across segments. Stock performance over time is an example where only two columns are required. Pie charts, bar charts, column charts, and funnel charts are commonly used to visualize single series datasets.

Multiseries datasets require at least three columns, as shown in Figure 9-17. Individual series elements are bound to a set of columns defined by the dataset. With this type of dataset, you can compare figures by two pivots in that you can additionally gain relative analysis by comparing against related data. Bar charts and column charts along with many others are suitable for analyzing multiseries datasets. However, pie charts and funnel charts are not appropriate for visualizing multiseries datasets.

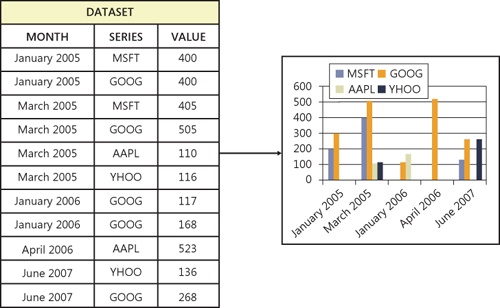
Often, the number of series is defined within the dataset itself. These datasets are referred to as dynamic series datasets and can be described using three or more columns, as shown in Figure 9-18. The biggest differentiator between a dynamic series dataset and a multiseries dataset is the inclusion of a column that identifies the unique series. Dynamic series datasets are appropriate in cases where the number of series is determined by the user or by attributes that are related to the data source. Dynamic series datasets can be viewed by using the same types of charts as multiseries datasets.
For more information about how to choose the right type of chart for your data, see “Chart Types (Report Builder and SSRS),” at http://msdn.microsoft.com/en-us/library/dd220461(v=sql.110).aspx.
Each series in a chart consists of a set of data points, which, for most chart types, is made up of two key attributes: X and Y values. Collectively, the control uses these data points to render the data series in a method that is consistent with the type of chart you select. In addition to X and Y values, data points can contain additional information, including drill-through URLs, tooltip text, and data point labels. As you would expect, when a data point contains a definition for a drill-through URL, the data point becomes clickable in the chart image. When the user clicks the data point, he or she is taken to the specified URL. Defining tooltip text for a data point automatically produces a tooltip containing the text when the user hovers over the data point in the chart. You can extend the original dataset by using a post-processing event handler to include additional data-point information that drives the interactive experience provided by the chart.
Follow these basic steps to expand the chart dataset to include interactive functions:
Access the data that you want to appear in the chart.
Add post-processing code that expands the schema of the underlying data table.
Format the data columns based on their intended use.
Bind newly created columns to the chart properties that control the interactive functions of the control when it is rendered for the user.
Figure 9-19 illustrates the sequence for expanding the dataset to add columns that are formatted for interactive use.

The reporting framework applies some default formatting to the most common types of controls. Default formatting is applied for three main reasons:
To promote consistency among charts that are displayed in Enterprise Portal
To simplify the development experience
To ensure that charts are visually compelling to users
At times, however, you may want to apply formatting that differs from defaults. You can override the default design formatting by using control event handlers.
It is recommended that you customize the EP Chart Control in response to the PreRender event. This is where you define code executed at run time to manage the format of the EP Chart Control. Customizations can include dynamic color palettes, custom label positioning, and text formatting.
Figure 9-20 demonstrates the basic steps in adding code to override the default formatting.

For more information about events, see “ASP.Net Page Life Cycle Overview,” at http://msdn.microsoft.com/en-us/library/ms178472.aspx.
This section contains some of the most common reporting framework issues and possible solutions. You can find related information posted on the Microsoft Dynamics AX Product Forum at https://community.dynamics.com/product/ax/f/33.aspx.
If you cannot validate the report server, do the following:
Click the Create button in the Reporting Servers form, which is located at Tools > Business Intelligence Tools > Reporting Servers, and make sure that a report folder and data source have been created on the report server. Click the Validate button.
Ensure that firewall settings are configured appropriately on the computer that is running the report server.
Ensure that both the report manager and report server URLs are correct.
Ensure that the Microsoft Dynamics AX user has permissions on the computer that is running the report server.
If you are connecting to the Microsoft Dynamics AX SQL Server database and the system will not generate a report, do the following:
Ensure that the report server account configured in the report data source on the report server has read permissions on the Microsoft Dynamics AX SQL Server database.
Ensure that firewall settings are configured appropriately on the computer on which the database is installed.
If you are connecting to an external or custom data source, make sure that the user name and password provided for the report server account in the data source on the report server are correct.
If you cannot debug a chart because of problems with the SharePoint sandbox, do the following:
Add a reference to the Microsoft.SharePoint.dll assembly to the project.
Establish the default web control to run in debug mode.
Add the ManagedContentItem property to the <dynamics:AxUserControlWebPart> element and set the value to the name of the web control.