
Chapter 14
Ten Tips for Working with Power Query
In This Chapter
![]() Getting information from the Workbook Queries pane
Getting information from the Workbook Queries pane
![]() Organizing queries
Organizing queries
![]() Referencing and duplicating queries
Referencing and duplicating queries
![]() Configuring Power Query options
Configuring Power Query options
![]() Boosting performance
Boosting performance
Over the past few years, Microsoft has added countless features to Power Query. It has truly become a rich tool set with multiple ways to perform virtually any action you can think of. This growth in functionality has paved the way to a good number of tips and tricks that can help you work more efficiently with your Power Query models.
This chapter presents ten of the more useful tips and tricks you can leverage to get the most out of Power Query.
Getting Quick Information from the Workbook Queries Pane
All the Power Query queries that live in a particular workbook can be views in the Workbook Queries pane. Choose Data ⇒ Show Queries to activate the Workbook Queries pane.
In this pane, you can see some quick information about a query by simply hovering the cursor over it. You can see the data source for the query, the last time the query was refreshed, and a sneak peek of the data within the query. You can even click on column hyperlinks to peek at a particular column (see Figure 14-1).

Figure 14-1: Hover the cursor over a query to get quick information, including sneak peeks of column contents.
Organizing Queries in Groups
As you add queries to your workbook, your Workbook Queries pane may start to feel cluttered and disorganized. Do yourself a favor and organize your queries into groups.
Figure 14-2 illustrates the kinds of groups you can create. You can create a group only for custom functions or a group for queries sourced from external databases. You could even create a group where you store small reference tables. Each group is collapsible, so you can neatly pack away queries that you aren’t working with.

Figure 14-2: Queries can be organized into groups.
You can create a group by right-clicking a query in the Workbook Queries pane and selecting Move To Group ⇒ New Group. As you can see in Figure 14-3, if you’ve already created a few groups, you also have the option of moving the selected query to an existing group.

Figure 14-3: Creating a new group.
Selecting Columns in Queries Faster
When dealing with a large table with dozens of columns in the Query Editor, it can be a pain to find and select the right columns to work with. You can avoid all that scrolling back and forth by choosing the Choose Columns command on the Home tab.
The dialog box shown in Figure 14-4 opens, showing you all available columns (including custom columns you may have added). You can easily find and select the columns you need.

Figure 14-4: Use the Choose Columns command to find and select columns faster.
Renaming Query Steps
Every time you apply an action in the Query Editor, a new entry is made in the Query Settings pane, as shown in Figure 14-5. Query steps serve as a kind of audit trail for all the actions you’ve taken on the data.

Figure 14-5: Right-click query steps to rename them.
Why not make sure that your query steps have names that aren’t generic names, like Uppercased Text or Merged Columns. Sure, you know what each step does now, but what about in six months? Why not take the time to add some clarity on what each step is doing?
 You can rename your steps by right-clicking each step and selecting Rename.
Figure 14-6 shows the same steps renamed, to provide a bit more insight about the purpose of each one.
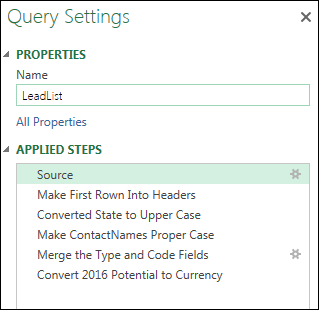
Figure 14-6: Add clarity by adding friendly names to query steps.
Quickly Creating Reference Tables
A handful of columns in a dataset always make for fantastic reference tables. For instance, if your dataset contains a column with a list of product categories, it would be useful to create a reference table of all the unique values in that column.
Reference tables are often used to map data, feed menu selectors, serve as lookup values, and much more.
While in the Query Editor, you can right-click the column from which you want to create a reference table and then select Add as New Query, as shown in Figure 14-7.

Figure 14-7: Create a new query from an existing column.
A new query is created, using the table you just pulled from as the source. The Query Editor jumps into action, showing only the column you selected. From here, you can use the Query Editor to clean up duplicates or remove blanks, for example.
Copying Queries to Save Time
It’s always smart to reuse work wherever you can. Why reinvent the wheel when your Workbook Queries pane is full of wheels you’ve already created?
Save time by duplicating the queries in your workbook. To do so, activate the Workbook Queries pane, right-click on the query you want to copy, and then select Duplicate. As you can see in Figure 14-8, you can also duplicate custom functions.

Figure 14-8: Duplicating a query.
Setting a Default Load Behavior
If you’re working heavily with Power Pivot and with Power Query, chances are good that you load your Power Query queries to the Internal Data Model a majority of the time.
If you’re one of those analysts who always loads to the Data Model, you can tweak the Power Query options to automatically load to the Data Model.
Choose Data ⇒ New Query ⇒ Query Options to open the dialog box shown in Figure 14-9. Select Data Load in the Global section, and then choose to specify a custom default load setting. This enables the options to load to the worksheet or Data Model by default.

Figure 14-9: Use the Global Data Load options to set a default load behavior.
Preventing Automatic Data Type Changes
One of the more recent additions to Power Query is the ability to automatically detect data types and to proactively change data types. This type detection is most often applied when new data is introduced to the query.
For instance, Figure 14-10 shows the query steps after importing a text file. Note the Changed Type step, which was automatically performed by Power Query as part of its type detection feature.

Figure 14-10: Power Query automatically adds a step to change data types when data is imported.
Although Power Query does a decent job at guessing what data types should be used, applied data type changes can sometimes cause unexpected issues.
Some veterans of Power Query, frankly, find the type detection feature annoying. If data types need to be changed, they want to be the ones to make that determination.
If you’d rather handle data type changes without help from Power Query’s type detection feature, you can turn it off.
Choose Data ⇒ New Query ⇒ Query Options to open the dialog box shown in Figure 14-11. Select Data Load in the Current Workbook section, and then deselect the option to automatically detect column types and headers for unstructured sources.

Figure 14-11: Disabling the type detection feature.
Disabling Privacy Settings to Improve Performance
The privacy-level settings in Power Pivot (explored in Chapter 11) are designed to protect organizational data as it gets combined with other sources. When you create a query that uses an external data source with an internal data source, Power Query stops the show to ask how you want to categorize the data privacy levels of each data source.
For a majority of analysts, who deal solely with organizational data, the privacy-level settings do little more than slow down queries and cause confusion.
Fortunately, you have the option to ignore privacy levels.
Choose Data ⇒ New Query ⇒ Query Options to open the dialog box shown in Figure 14-12. Select Privacy in the Current Workbook section, and then choose the option to ignore privacy levels.

Figure 14-12: Disabling the privacy-level settings.
Disabling Relationship Detection
When you’re building a query and choosing Load to Data Model as the output, Power Query, by default, attempts to detect relationships between queries and creates those relationships within the Internal Data Model. The relationships between queries are primarily driven by the defined query steps. For instance, if you were to merge two queries and then load the result into the Data Model, a relationship would be automatically created.
In larger data models with a dozen or so tables, Power Query’s relationship detection can affect performance and increase the time it takes to load the Data Model.
You can avoid this hassle and even gain a performance boost by disabling relationship detection.
Choose Data ⇒ New Query ⇒ Query Options to open the dialog box shown in Figure 14-13. Select Data Load in the Current Workbook section, and then deselect the option to create relationships when adding loading to the Data Model.

Figure 14-13: Disabling relationship detection.