
CHAPTER 41
Enhancing Power Query Productivity
This chapter offers practical tips for organizing queries and working more efficiently with Power Query. You will also discover a few pointers for optimizing query performance.
Implementing Some Power Query Productivity Tips
Over the past few years, Microsoft has added countless features to Power Query. It has truly become a rich toolset with multiple ways to perform virtually any data transformation you can think of. This growth in functionality has paved the way for a good number of tips that can help you work more efficiently with your Power Query models.
Getting quick information about your queries
All of the Power Query queries that live in a particular workbook can be viewed in the Queries & Connections task pane. Click Data ⇨ Queries & Connections to activate it.
Here, you can get some quick information about a query simply by hovering over it. You can see the data source for the query and the last time the query was refreshed, and you can get a sneak peek of the data within the query. You can even click a column hyperlink to peek at a particular column (see Figure 41.1).
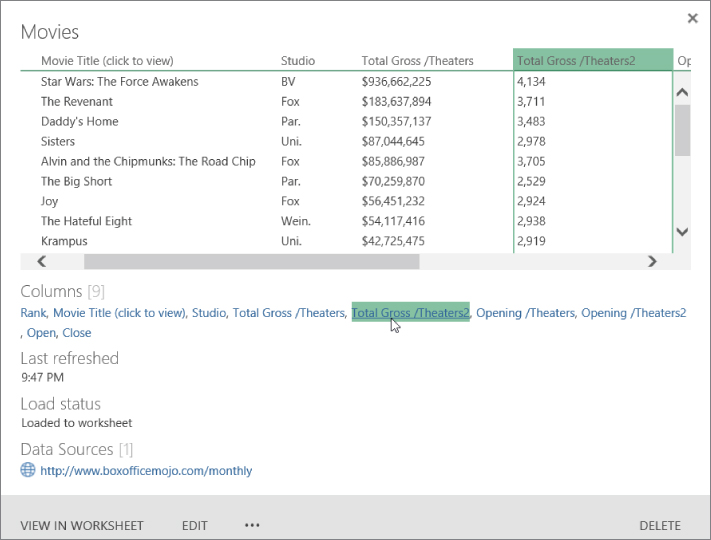
FIGURE 41.1 Hover over a query to get quick information including sneak peeks of column contents.
Organizing queries in groups
As you add queries to your workbook, your Queries & Connections pane may start to feel cluttered and disorganized. You can get organized by creating groups for your queries.
Figure 41.2 illustrates the kinds of groups that you can create. You can create a group for specific stages of data processing. Or how about a group for queries sourced from external databases? What about a group where you store small reference tables? Each group is collapsible, so you can neatly pack away queries that you aren't working with at present.

FIGURE 41.2 Queries can be organized into groups.
You can create a group by right-clicking a query in the Queries & Connections pane and selecting Move To Group ⇨ New Group. Right-clicking the group name will expose a set of options for managing the group itself (see Figure 41.3). You even have the option of refreshing all of the queries within the group at once.

FIGURE 41.3 Group-level options
Selecting columns in your queries faster
When dealing with a large table with dozens of columns in the Query Editor, it can be a pain to find and select the right columns to work with. You can avoid all that scrolling back and forth by clicking the Choose Columns command on the Home tab of the Power Query Editor.
The dialog box in Figure 41.4 will activate and show you all of the available columns (including custom columns that you may have added). Here, you can easily find and select the columns you need.

FIGURE 41.4 Use the Choose Columns command to find and select columns faster.
Renaming query steps
Each time you apply an action in the Query Editor, a new entry is made in the Query Settings pane (shown in Figure 41.5). Query steps serve as a kind of audit trail for all the actions you've taken on the data.

FIGURE 41.5 Right-click query steps to rename them.
Query steps are automatically given generic names like Uppercased text or Merged Columns. Why not take the time to add some clarity on what each step is doing? You can rename your steps step by right-clicking each step and selecting Rename.
Quickly creating reference tables
There are always a handful of columns in a data set that make for fantastic reference tables. For instance, if your data set contains a column with a list of product categories, it would be useful to create a reference table of all the unique values in that column. Reference tables are often used to map data, feed menu selectors, serve as lookup values, and much more.
While in the Query Editor, you can right-click the column from which you want to create a reference table and then select Add as New Query (see Figure 41.6). A new query will be created, using the table that you just pulled from as the source. The Query Editor jumps into action, showing just the column you selected. From here, you can use the Query Editor to clean up duplicates, remove blanks, and so forth.

FIGURE 41.6 Create a new query from an existing column.
Copying queries to save time
It's always smart to reuse work whenever you can. Why reinvent the wheel when your Queries & Connections pane is full of wheels that you've already created?
Save time by duplicating the queries in your workbook. To do so, activate the Queries & Connections pane, right-click the query you want to copy, and then select Duplicate.
Setting a default load behavior
If you're working heavily with Power Pivot as well as Power Query, chances are that you're loading your Power Query queries to the internal data model a majority of the time. If you're one of those analysts who always loads to the data model, you can tweak the Power Query options to load to the data model automatically.
Click Data ⇨ Get Data ⇨ Query Options to open the dialog box shown in Figure 41.7. Select Data Load under Global and then choose to specify a custom default load setting. This enables the options to load to the worksheet or load to the data model by default.

FIGURE 41.7 Use the Global Data Load options to set a default load behavior.
Preventing automatic data type changes
One of the more recent additions to Power Query is the ability to detect data types automatically and proactively change data types. This type detection is most often applied when new data is introduced to the query.
For instance, Figure 41.8 shows the query steps after importing a text file. Note the Changed Type step. This step was automatically performed by Power Query as part of its type detection feature.

FIGURE 41.8 Power Query automatically adds a step to change data types when data is imported.
Although Power Query does a decent job at guessing what data types should be used, automatic data type changes can cause unexpected issues. Some veterans of Power Query frankly find the type detection feature annoying. If data types need to be changed, they want to be the ones to make that determination.
If you'd rather handle data type changes without the help from Power Query's type detection feature, you can turn it off. Click Data ⇨ Get Data ⇨ Query Options to open the dialog box shown in Figure 41.9. Select Data Load under Current Workbook and then uncheck the option to Automatically detect column types and headers for unstructured sources.

FIGURE 41.9 Disabling the Type Detection feature
Avoiding Power Query Performance Issues
Because Power Query inherently paves the way for large amounts of data with fairly liberal restrictions, it's possible to end up with queries that are unbearably slow.
When you're wrangling a few thousand records, query performance is not an issue. However, when you are importing and crunching hundreds of thousands of records, performance becomes an issue. There is no getting around the fact that the larger the volume of data, the slower your queries will run. That being said, there are steps that you can take to optimize query performance.
Using views instead of tables
When connecting to an external database, Power Query allows you to import views as well as tables. A view is essentially a predefined query on the server itself.
While tables are more transparent, allowing you to see all of the raw unfiltered data, they come with all available columns and rows—whether you need them or not. This often forces you to take extra steps and processing power to remove columns and filter out data that you don't need.
Views not only provide you with cleaner, more user-friendly data, but they can help streamline your data model by limiting the amount of data you import.
Letting your back-end database servers do some crunching
Most Excel analysts who are new to Power Query have a tendency to pull raw data directly from the tables on their external database servers. Once the raw data is in Power Query, they then build transformation and aggregation steps as needed.
Why make Power Query perform transformations that the back-end server could have handled? The reality is that back-end database systems like SQL Server have the ability to shape, aggregate, clean, and transform data much more efficiently than Power Query. Why not utilize their powerful capabilities to massage and shape your data before importing into Power Query?
Instead of pulling raw table data, consider leveraging server-side functions and stored procedures to perform as much data transformation and aggregation work for you as possible. This reduces the amount of processing Power Query will have to do and will naturally improve performance.
Upgrading to 64-bit Excel
If you continue to run into performance issues, there is always the option of getting a better PC. Better, in this case, means moving to a 64-bit PC with 64-bit Excel installed.
The 64-bit version of Excel can access more of your PC's RAM, ensuring that it has the system resources needed to crunch through bigger data sets. In fact, Microsoft recommends 64-bit Excel for anyone working with data models made up of millions of rows.
Before you start installing 64-bit Excel, however, you'll need to consider a few things:
Disabling privacy settings to improve performance
The privacy-level settings in Power Query are designed to protect organizational data as it gets combined with other sources. When you create a query that uses an external data source with an internal data source, Power Query stops the show to ask how you'd like to categorize the data privacy levels of each data source.
For a majority of analysts who deal solely with organizational data, the privacy level settings do little more than slow down queries and cause confusion. Fortunately, there is an option for ignoring privacy levels.
Click Data ⇨ Get Data ⇨ Query Options to open the dialog box shown in Figure 41.10. Select Privacy under Current Workbook and then choose the option to ignore privacy levels.

FIGURE 41.10 Disabling the privacy level settings
Disabling relationship detection
When building a query and choosing Load to Data Model as the output, Power Query will, by default, attempt to detect relationships between queries and create those relationships within the internal data model. The relationships between queries are primarily driven by the defined query steps. For instance, if you were to merge two queries and then load the result into the data model, a relationship is automatically created.
In larger data models with a dozen or so tables, Power Query relationship detection can affect performance and increase the time it takes to load the data model. You can avoid this hassle and even gain a performance boost by disabling relationship detection.
Click Data ⇨ Get Data ⇨ Query Options to open the dialog box shown in Figure 41.9. Select Data Load under Current Workbook and then uncheck this option: Create relationships between tables when adding to the Data Model for the first time.