
Chapter 27
MEASURING VALUE CREATION
Separating the wheat from the chaff
Creating value has become such an important issue in finance that a host of indicators have been developed to measure it. They come under a confusing array of acronyms – TSR, MVA, EVA, CFROI, ROCE, WACC – but most of these will probably be winnowed out in the years to come. Ultimately, they should be reduced to those few that best mirror and address the recent developments in cash flow statements.
The current profusion of indicators has its advantages, as normally we expect only the most reliable to survive. However, in practice some companies use the lack of clear guidelines and standards to choose indicators that best serve their interests at a given time, even if this involves the laborious task of changing indicators on a routine basis.
The chart below should help you find your way through the maze of indicators. It plots value creation measures according to three criteria: ease of manipulation, sensitivity to financial markets and category (accounting, economic or stock market indicators).

Section 27.1 OVERVIEW OF THE DIFFERENT CRITERIA
Value creation indicators fall into four categories:
- Accounting indicators. Until the mid-1980s, companies mainly communicated their net profit/loss or earnings per share (EPS). Regrettably, this is a key accounting parameter that is also very easy to manipulate. This practice of massaging EPS is called “window dressing”, or improving the presentation of the accounts by adjusting exceptional items, provisions, etc. The growing emphasis on operating profit or EBITDA represents an improvement because it considerably reduces the impact of exceptional items and non-cash expenses. It is regrettable that the IASB has refused to define EBITDA, which leaves companies free to choose their own definition, whereas for us there is only one: the difference between all operating revenues and expenses that sooner or later results in a cash inflow or outflow; and which has eliminated exceptional items that are now included in the various expense items.
The second-generation accounting indicators appeared as investors began to reason in terms of profitability, i.e. efficiency, by comparing return with the equity used. One such ratio is called return on equity (ROE). However, it is possible to leverage this value as well, since a company can boost its ROE by skilfully raising its debt level. Even though ROE might look more attractive, no “real” value has been created since the increased profitability is cancelled out by higher risk not reflected in accounting data.
Since the return on capital employed (ROCE) indicator avoids this bias, it has tended to become the main measure of economic performance. Only in a few sectors of activity is it meaningless to use ROCE (essentially in banking or insurance, where ROE is widely used).
These rates mainly fall into the field of accounting, rather than finance.
While NPV and other economic indicators represent valuable tools for strategic analysis and a good basis for estimating the market value of companies, they are based on projections that are frequently difficult to assess. Unfortunately, the cash flow for one single year is easy to manipulate and meaningless. Indeed, it is not intuitively interpretable. At the same time, we know that the major drivers of cash flows are the growth of earnings and revenues of the company and ROCE. By focusing attention on ROCE, there is a better intuitive grasp of how the company is performing. It is then easier to assess the firm's growth, both over time and relative to its industry.
- Accounting/financial indicators emerged with the realisation that profitability per se cannot fully measure value because it does not factor in risks. To measure value, returns must also be compared with the cost of capital employed. Using the cost of financing a company, called the weighted average cost of capital, or WACC,1 it is possible to assess whether value has been created (i.e. when return on capital employed is higher than the cost of capital employed) or destroyed (i.e. when return on capital employed is lower than the cost of capital employed).
But companies can also go one step further by applying the calculation to capital employed at the beginning of the year in order to measure the value created over the period. The difference can then be expressed in currency units rather than as a percentage. This popular measure of value creation has been most notably developed in the EVA, or economic value added, model. It is also known as economic profit.
These indicators are mainly used for decentralised management control and for the calculation of variable compensation, often linked directly or indirectly to economic profit.
- Financial indicators. Yet the best of all indicators is undoubtedly net present value (NPV, see Chapter 16), which provides the exact measure of value created. It has been repeatedly demonstrated that intrinsic value creation is the principal driver of companies' market value. But NPV has one drawback because it must be computed over several periods. For the external analyst who does not have access to all the necessary information, the NPV criterion becomes difficult to handle. The quick and easy solution is to use the above-mentioned ratios. It is important to remember that while the other ratios are simpler to use, they are also less precise and may prove misleading when not used with care.
They are mostly used for investment choices and valuation.
- Market indicators: market value added (MVA) and total shareholder return (TSR) are highly sensitive to the stock market. MVA represents the difference on the one hand between the value of equity and net debt, and on the other the book value of capital employed. It is expressed in currency units. TSR is expressed as a percentage and corresponds to the addition of the dividend yield on the share (dividends/value of the share) and the capital gains rate (capital gains during the period divided by the initial share value). It is the return earned by a shareholder who bought the share at the beginning of a period, earned dividends and then sold the share at the end of the period.
A major weakness with these two measures is that they may show destruction in value because of declining investor expectations about future profits, even though the company's return on capital employed is higher than its cost of capital. This is the case for Bic, which has seen its share price drop since 2015, despite having an average ROCE above 12% every year since then, for a cost of capital of roughly 7%. Conversely, in a bull market, a company with mediocre economic performance may have flattering TSR and MVA. In the long term, these highs and lows are smoothed out and TSR and MVA would eventually reflect the company's modest performance. Yet in the meantime, there may be some major divergences between these indicators and company performance.
TSR is sometimes used as an index for variable compensations. MVA is rarely used.
A clear distinction must be made between economic indicators and measures of stock market value creation (TSR and MVA). The former measure the past year's performance, while the latter tend to reflect anticipation of future value creation. The measures of stock market value creation take into account the share price, which reflects this anticipation. Yet the different measures of economic performance and stock market value are complementary, rather than contradictory.
Section 27.2 NPV, THE ONLY RELIABLE CRITERION
It should now be clear that the concept of value corresponds perfectly to the measure of NPV. Financial management consists of constantly measuring the net present value of an investment, project, company or source of financing. Obviously, one should only allocate resources if the net present value is positive; in other words, if the market value is lower than the present value. Net present value reflects how allocation of the company's resources has led to the creation or destruction of value. On the one hand, there is a constant search for anticipated financial flows – while keeping in mind the uncertainty of these forecasts. On the other hand, it is necessary to consider the rate of return (k) required by the investors and shareholders providing the funds.
The value created is thus equal to the difference between the capital employed and its book value. Book value is the amount of funds invested in the company's operations.
The creation of value reflects investors' expectations. Typically, this means that, over a certain period, the company will enjoy a rent with a present value allowing its capital employed to be worth more than its book value!
While NPV is widely used within companies to make investment choices (Chapter 28), it is hardly ever used by the company in its external communication on its value creation.
If it were to do so, it would be obliged to give precise details of its business plan and future cash flows to the public. No company is prepared to do so in order not to give confidential information to its competitors, nor to give the impression of making performance commitments that it might not keep because it is dependent on economic and financial conditions that are beyond its control.
Hence the development of value creation indicators, which are much less indiscreet, but also often much less effective and much easier to manipulate!
Section 27.3 FINANCIAL/ACCOUNTING CRITERIA
1/ ECONOMIC PROFIT OR EVA
Economic profit is less ambitious than net present value. It only seeks to measure the wealth created by the company in each financial year. EVA does not just factor in the cost of debt, such as in calculating net profit, but also accounts for the cost of equity.
Economic profit or EVA first measures the excess of ROCE over the weighted average cost of capital. Then, to determine the value created during the period, the ratio is multiplied by the book value of thecapital employed at the start of the reporting period. Thus, a company that had an opening book value of capital employed of 100 and an after-tax return on capital employed of 12% with a WACC of only 10% will have earned 2% more than the required rate. It will have created a value of 2 on funds of 100 during the period.
Economic profit is related to net present value, because NPV is the sum of the economic profits discounted at the weighted average cost of capital:
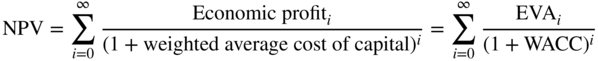
The table shows EVA for some European firms.
| Company | 2020 EVA (€m) | Company | 2020 EVA (€m) |
|---|---|---|---|
| Roche | 12,800 | Adidas | (26) |
| Nestlé | 6,912 | Bonduelle | (39) |
| L'Oréal | 2,831 | E.ON | (54) |
| AstraZeneca | 1,164 | Heidelberg Cement | (102) |
| Peugeot | 576 | Michelin | (312) |
| Carrefour | 278 | BASF | (759) |
| RTL | 245 | Shell | (974) |
| Carlsberg | 169 | LafargeHolcim | (1,222) |
| Proximus | 102 | Telecom Italia | (1,913) |
| Criteo | 46 | ArcelorMittal | (2,485) |
| BIC | 14 | ENI | (3,557) |
| Heineken | 0 | Deutsche Telekom | (3,784) |
Source: Data from Exane BNP Paribas, Factset
To calculate EVA, it is necessary to switch from an accounting to an economic reading of the company. This is done by restating certain items of capital employed as follows:
- The exceptional losses of previous years must be restated and added to capital employed insofar as they artificially reduce the company's capital.
- The goodwill recorded in the balance sheet must be taken as gross, i.e. corrected for cumulative amortisation or impairment, the badwill must be deducted from equity and assets.
- Other major restatements are for deferred tax liabilities and for depreciation (so as to be consistent with capital employed obtained through previously mentioned restatements).
Of course, the profit and loss account (operating profit/loss and taxes) must be restated to ensure consistency with the capital employed calculated previously.
The firms that develop economic profit tools for companies generally have a long list of accounting adjustments that attest to their expertise. Such accounting expertise typically represents a barrier to entry for others seeking to perform the same analyses.
EVA's novelty also lies in its scope of application, since it enables a company to measure performance at all levels by applying an individual required rate of return to various units. It is a decentralised financial management tool.
A firm may be tempted to maximise short-term EVA, which may be detrimental to future EVAs (underinvestment, artificial reduction of working capital). In general, it is very complex to pick annual criteria that will make it possible to measure value creation for a firm properly. Only the NPV of future cash flows allows us to take into account the long-term capacity to create value.
2/ CASH FLOW RETURN ON INVESTMENT
The original version of cash flow return on investment (CFROI) corresponds to the average of the internal rates of return on the company's existing investments. It measures the IRR earned by a firm's existing projects.
CFROI is the internal rate of return that equals the company's gross capital employed, i.e. before depreciation and adjusted for inflation, and the series of after-tax EBITDA computed over the lifetime of existing fixed assets (estimated by dividing the gross value of fixed assets by the depreciation). CFROI is then compared with the weighted average cost of capital. If CFROI is higher than WACC, then the company is creating value; if it is lower, then the firm is destroying value.
As with EVA, computing CFROI requires a number of restatements, which seem to exist mainly to convince their users to hire the founder of the concept (Holt) to implement it. It is sometimes used in a very simplified manner, which makes it very close to a mere accounting criterion (see Section 27.5).
Section 27.4 MARKET CRITERIA
1/ CREATING STOCK MARKET VALUE (MARKET VALUE ADDED)
For listed companies, market value added (MVA) is equal to:
In most cases, if no other information is available, we assume that net debt corresponds to its book value. Thus, the equation becomes simpler:
So, market value added is frequently considered to be the difference between market capitalisation and the book value of equity. This is the equivalent of the price-to-book ratio (PBR) discussed in Chapter 22.2 The table shows MVA for some large listed European companies.
| Company | 2020 MVA (€m) | Company | 2020 MVA (€m) |
|---|---|---|---|
| Adidas | 53,250 | NRJ | (170) |
| ABB | 36,716 | Peugeot | (533) |
| Sanofi | 36,080 | Heidelberg Cement | (1,124) |
| Deutsche Telekom | 35,286 | Stellantis | (5,268) |
| Ericsson | 23,974 | ENI | (6,594) |
| Cap Gemini | 15,299 | Natixis | (7,845) |
| Total | 8,900 | Orange | (8,502) |
| Michelin | 6,084 | ArcelorMittal | (11,992) |
| Telefonica | 6,056 | Renault | (14,197) |
| Nokia | 5,258 | Vodafone | (17,735) |
| Saint Gobain | 2,084 | NatWest | (20,146) |
| M6 | 616 | Porsche | (27,309) |
| Bonduelle | (12) | Crédit Agricole | (28,315) |
Source: Data from Exane BNP Paribas, Factset.
It is not complex to demonstrate the relationship between market value added and intrinsic value creation in equilibrium markets, since:

Economic profit being equal to capital employed × (ROCE − WACC). This is also equivalent to:

However, those who do not believe in market efficiency contend that MVA is flawed because it is based on market values that are often volatile and out of the management's control. Yet this volatility is an inescapable fact for all, as that is how the markets function.
2/ TOTAL SHAREHOLDER RETURN (TSR)
TSR is the return received by the shareholder who bought the share at the beginning of a period, earned dividends (which are generally assumed to have been reinvested in new shares) and values their portfolio with the last share price at the end of the period. In other words, TSR equals (share appreciation + dividends)/price at the beginning of the period.
In order for it to be meaningful, the TSR ratio is calculated on a yearly basis over a fairly long period of, say, 5–10 years. This smooths out the impact of erratic market movements, e.g. the tech, media and telecom stock bubble of 2000, the 2007–2010 or the Covid-19 crisis.
By way of illustration, here is the TSR of a few major groups over the last 10 years.
| Company | TSR over 10 years | Company | TSR over 10 years |
|---|---|---|---|
| Apple | 30.7% | Rio Tinto | 7.6% |
| L'Oréal | 16.2% | Vinci | 6.3% |
| Allianz | 11.2% | Total | 4.6% |
| Nestlé | 10.5% | ICBC | 3.7% |
| Infosys | 10.2% | IBM | 1.7% |
| Enel | 10.1% | General Electric | –1.3% |
| Sanofi | 9.4% | Vale | –1.6% |
| Toyota | 9.3% | Nokia | –1.8% |
| Siemens | 9.3% | Santander | –5.7% |
| Coca-Cola | 8.3% | Cathay Pacific | –6.5% |
Source: Data from DQYDJ and ycharts
Section 27.5 ACCOUNTING CRITERIA
Certain accounting indicators, like net profit, shareholders' equity and cash flow from operations, are more representative of a firm's financial strength. As such they are flawed to measure value creation.
Earnings per share and the accounting rates of return (ROCE, ROE), whilst systematically used as analytical criteria for all financial decisions, even at the board level, are not without faults as they largely ignore risk due to their accounting origin.
It is inappropriate to believe that by artificially boosting them you have created value. Nor is it correct to assume that there is a constant and automatic link between improving these criteria and creating value. In order to maximise value, it is simply not enough to maximise these ratios, even if they are linked by a coefficient to value or the required rate of return.
1/ EARNINGS PER SHARE
Notwithstanding the comments just made about earnings per share, many financial managers continue to favour using it, especially with regard to financial communication. Despite its limitations, it is still the most widespread multiple because it is directly connected to the share price via the price/earnings ratio. EPS's popularity is rooted in three misconceptions:
- the belief that earnings per share factors in the cost of equity and, therefore, the cost of risk;
- the belief that accounting data influence the value of the company. Changing accounting methods (for inventories, depreciation, goodwill, etc.) will not modify the company's value, even if it does change earnings per share; and
- the belief that any financial decision that lifts EPS will change value as well. This would imply that the P/E ratio3 remains the same before and after the financial decision, which is frequently not the case. Thus, value is not a direct multiple of earnings per share, because the decision may affect investors' assessment of the company's risks and growth potential.
Consider Company A, which, based upon its risks and growth and profitability prospects, has a P/E ratio of 20. Its net profit is 50. Company B has equity of 450 with net profit of 30, giving it a P/E of 15. Company A decides to acquire a controlling interest in Company B, paying a premium of 33% on B's value, i.e. a total of 600. Company A finances the acquisition entirely by taking on debt at an after-tax cost of 3%. Both Companies A and B are fairly valued. There are no industrial or commercial synergies that could increase the new group's earnings, and no goodwill.
Company A's net profit is thus:
Since A financed its acquisition of B entirely through debt, it still has the same number of shares. The increase in earnings per share, also called earnings per share accretion, is therefore equal to that in net profit; that is, +24%. This certainly seems like an extraordinary result!
But has A really created value by buying B?
The answer is no, since there are no synergies to speak of between A and B. Keep in mind that A paid 33% more than B's equilibrium price. In fact, Company A has destroyed value in proportion to this premium, i.e. 150, because it cannot be offset by synergies.
In fact, the explanation for the – apparent – paradox of a 24% rise in earnings per share matched by a destruction of value is that the buyer's EPS has increased, because the P/E ratio of the company bought by means of debt is higher than the after-tax cost of the debt. Here, B has a P/E ratio of 20 given the 33% premium paid by A on the acquisition. The inverse of 20 (5%) is much higher than the 3% after-tax cost of the debt for A.
Consider now Company C, which has equity of 1,400 with net profit of 140, i.e. a P/E of 10. It merges with Company D, which has the same risk exposure, equity of 990 and a P/E of 18 (net profit of 55), with no control premium. Thanks to very strong industrial synergies, C is able to boost D's net profit by 50%. Without doubt, value has been created. And yet, it is not difficult to prove (see Exercise 1) that C's EPS dropped 7% after the merger. This is a mechanical effect due simply to the fact that D's P/E of 18 is higher than C's P/E of 10, because D has better earnings prospects than C.
So, what was the net result of Company C's acquisition of Company D? The question is not whether Company C's EPS has been enhanced or diluted, but whether it paid too much for D. In fact, it did not, since there was no control premium paid and industrial synergies were created. After the operation, C's share will trade at a higher P/E ratio, as it should enjoy greater earnings growth thanks to the contribution from D's higher-growth businesses. In the end, C's higher P/E ratio should more than compensate for C's diluted EPS, lifting the share price. This is only logical considering that the industrial synergies created value.
If these three conditions are met, we can assume that EPS growth reflects the creation of value, and EPS dilution the destruction of value.
If just one of these conditions is lacking, then there is no way to infer that any increase in EPS reflects the creation of value, nor that a decrease is a destruction of value. In our example of a combination between A and B financed by debt, although A's EPS rose 24%, its risk increased sharply. Its position is no longer directly comparable with that before the acquisition of B.
Similarly, C's post-merger EPS cannot be compared with its EPS prior to the merger. While the merger did not change its financial structure, C's growth rate after the merger with D is different from what it was beforehand.
2/ EARNINGS PER SHARE ADJUSTED FOR THE COST OF CARBON EMISSIONS
Used for the first time by Danone in February 2020, this adjusted EPS makes the cost of the carbon footprint visible in financial performance. It measures the accounting enrichment of the shareholder, in relation to one share, once the cost of the carbon credits that the company would have to acquire to offset its greenhouse gas emissions is taken into account. Danone has estimated them on the basis of a cost of €35 per tonne of carbon.
The cost of the externalities that the company causes to the community is thus integrated into the company's financial performance, thus finally linking the two worlds of finance and non-finance.
At a constant cost of carbon credits, this EPS will grow faster than traditional EPS for companies that reduce their carbon footprint, which should enable investors to value them better. It is simply calculated from the net profit (group share) used to calculate EPS, from which the estimated greenhouse gas emissions multiplied by the price per tonne of carbon is subtracted, before dividing the balance by the number of diluted shares.
Once this calculation has been made, there is no reason why the other value creation indicators presented in this chapter cannot be adjusted in the same way.
It may be that the current EPS adjusted for carbon costs will not ultimately be the criterion retained by the market or the most relevant, but we have to start somewhere … and someone has to start.
3/ ACCOUNTING RATES OF RETURN
Accounting rates of return comprise:
- return on equity (ROE);
- return on capital employed (ROCE), which was described in Chapter 13; and
- cash flow return on investment (CFROI), the simplified version of which compares EBITDA with gross capital employed, i.e. before amortisation and depreciation of fixed assets.

This ratio is used particularly in business sectors wherein charges to depreciation do not necessarily reflect the normal deterioration of fixed assets, e.g. in the hotel business.
The main drawback of accounting rates of return on equity or capital employed is precisely that they are accounting measures. As shall be demonstrated below, these have their dangers.
Consider5 Company X, which produces a single product and generates a return of 20% on capital employed amounting to 100. X operates in a highly profitable sector and is considering external growth opportunities. Should it expect the present 20% rate of return to be generated on other possible projects? If it does, X will never invest because it is unlikely that any other investments will meet these criteria.
How can this problem be rationally approached? The company generates an accounting return of 20%. Suppose its shareholders and investors require a 10% return. Its market value is thus 20 / 10%, or 200.
The proposed investment amounts to 100 and generates a return of 15% on identical risks. The required rate of return is constant at 10%. We see that:
This yields an enterprise value of 35 / 10% = 350 (+150), with a return on capital employed of 35 / 200 = 17.5%.
The value of the capital employed has increased by more than the amount invested (150 vs. 100), because the profitability of Company X's investment (15%) is higher than the rate required by its shareholders and investors (10%). Value has been created, and X was right to invest. And yet, the return on capital employed fell by 20% to 17.5%, demonstrating that this criterion is not relevant.
The inverse example is Company Y, which has a return of 5% on capital employed of 100. Assuming the shareholders and investors require a 10% return as well, the value of Y's capital employed is 5 / 10% = 50.
The proposed investment amounts to 25 and yields a return of 8%. Since we have the same 10% required return, we get:
This results in capital employed being valued at 7 / 10% = 70 (+20), with a return of 7 / 125 = 5.6%.
The value of Y's capital employed has indeed increased by 20, but this is still less than the increase of 25 in capital invested. Value has been destroyed. The return on the investment is just 8%, whereas the required rate is 10%. The company has lost money and should not have made the investment. And yet the return on capital employed rose from 5% to 5.6%.
Similarly following an acquisition financed with a share issue, one could demonstrate that ROE increases when the target company's reverse 1 / (P/E) is higher than the buyer's current ROE.
Setting aside all these accounting concepts, to focus on financial concepts, such as requested rates of return (k).
Unfortunately, some corporate managers continue to view decision-making in terms of the impact on accounting measures (EPS and accounting profitability), even though it has just been demonstrated that these criteria have little to say about the creation of value. True, accounting systems are a company's main source of information. However, financial managers need to focus first and foremost on how financial decisions affect value.
Let's discuss synergy effects before mentioning EPS accretion!
Section 27.6 SYNTHESIS
As long as performance measures and their implementation remain so diversified, it is vital to have a good understanding of their respective flaws. By choosing one or another measure, companies can present their results in a more or less flattering light. Financial managers typically choose those measures that will demonstrate the creation, rather than the destruction, of value.
| Financial criteria | Financial/accounting criteria | Accounting criteria | Market criteria | |||||
|---|---|---|---|---|---|---|---|---|
| Ratio | Net present value | Economic profit | Cash flow return on investment | Earnings per share | Accounting rates of return | Market value added | Total shareholder return | |
| Acronym | NPV | EVA | CFROI | EPS | ROE, ROCE | MVA | TSR | |
| Strengths | The best criterion | Simple indicator leading to the concept of weighted average cost of capital | Not restricted to just one year | Historical data; simple | Simple concepts | Astoundingly simple; reflects total rather than annual value created | Represents shareholder return in the medium to long term | |
| Weaknesses | Difficult to calculate for an external analyst | Restricted to one year; difficult to evaluate changes over a period of time | Complex calculations | Does not factor in risks; easily manipulated; does not factor in the cost of equity | Accounting measures, thus do not factor in risks; restricted to one year; to be significant, must be compared with the required rate of return | Subject to market volatility; difficult to apply to unlisted companies | Calculated over too short a period; subject to market volatility | |
SUMMARY
QUESTIONS
EXERCISES
ANSWERS
BIBLIOGRAPHY
NOTES
- 1 See Chapter 29. Cost of capital is the weighted average cost of financial resources (equity and debt) available for the firm. It is therefore the minimum return that the company shall provide in order to satisfy the fund providers and hence create value.
- 2 The market-to-capital ratio is a variation of MVA expressed as a ratio rather than a unit amount, because it is obtained by dividing the market capitalisation of debt and equity by the amount of capital invested.
- 3 The P/E ratio is equal to price/earnings per share. It measures the relative expense of a share.
- 4 Before goodwill accounting.
- 5 To simplify the discount calculation, we assume that the planned investments will generate a return to infinity.