
Chapter 22
SHARES
One of a kind, or one of many?
As we saw in Chapter 4, the capital that is injected or left in the business by investors, which is exposed to the various risks of commercial or industrial ventures, and for which in return they receive the profits of, is called equity.
A share or a stock is a security that is not redeemed – the investment can only be realised through a disposal – and whose revenue flows are uncertain. It is in compensation for these two disadvantages that shareholders have a say in managing the company via the voting rights attached to their shares.
The purpose of this chapter is to present the key parameters used in analysing stocks and show how the stock market operates. For a discussion of stock as a claim option on operating assets, refer to Chapter 34, and to find out more about stock as a claim on assets and commitments, see Chapter 31 on company valuation.
Section 22.1 BASIC CONCEPTS
This section presents the basic concepts for analysing the value of stocks, whether or not they are listed. Remember that past or future financial transactions could artificially skew the market value of a stock with no change in total equity value. When this happens, technical adjustments are necessary, as explained in Section 22.5 of this chapter. We will then assume that they have been done.
1/ VOTING RIGHTS
Shares are normally issued with one voting right each. For our purposes, this is more of a compensation for the risk assumed by the shareholder than a basic characteristic of stock.
A company can issue shares with either limited or no voting rights. These are known under different names, such as preference shares, savings shares or simply non-voting shares.
At the other extreme, companies in some countries, such as the US and Sweden, issue several types of shares (“A” shares, “B” shares, etc.) having different numbers of voting rights. Some shareholders use this to strengthen their hold on a company, as we will see in Chapter 41.
2/ EARNINGS PER SHARE (EPS)
EPS is equal to net attributable profit divided by the total number of shares issued. EPS reflects the theoretical value creation during a given year, as net profit belongs to shareholders.
There is no absolute rule for presenting EPS. However, financial analysts generally base it on earnings restated from non-recurring items, as shown below:
ArcelorMittal's 2021 EPS was estimated in mid-2021 to be $4.99 (it was −$0.64 in 2020).
Some companies have outstanding equity-linked securities, such as convertible bonds, warrants and stock options. In this case, in addition to standard EPS, analysts calculate fully diluted EPS. We will show how they do this in Section 22.5.
3/ DIVIDEND PER SHARE (DPS)
Dividends are generally paid out from the net earnings for a given year, but can be paid out of earnings that have been retained from previous years. Companies sometimes pay out a quarterly (in the USA) or half-year (in the UK) dividend.
In 2021 ArcelorMittal paid a $0.30 dividend on 2020 results (it did not pay a dividend in 2020 on its 2019 results).
Some shares – like preference shares – pay out higher dividends than other shares or have priority in dividend payments over those other shares. They are generally non-voting shares.
4/ DIVIDEND YIELD
Dividend yield per share is the ratio of the last dividend paid out to the current share price:
The dividend yield on ArcelorMittal is 1% (dividend of $0.30 on a share with a price of $26.4).
The average yield on stocks listed on European stock markets is currently about 3%.
DIVIDEND YIELD – PAN-EUROPEAN SECTORS (AS OF 1 JANUARY)
| Years | Automotive | Biotechnology | Chemistry | Defence | Financial Institutions | Food | Oil & Gas | Real Estate | Telecom | Utilities |
|---|---|---|---|---|---|---|---|---|---|---|
| 1990 | 2.4% | 1.1% | 4.0% | 6.6% | 2.7% | 3.1% | 4.6% | 3.3% | 4.4% | 4.7% |
| 1995 | 0.8% | 0.4% | 3.1% | 0.3% | 3.1% | 3.5% | 4.0% | 4.7% | 4.1% | 4.3% |
| 2000 | 2.4% | 0.1% | 2.6% | 2.7% | 2.1% | 2.7% | 2.5% | 2.8% | 1.0% | 2.8% |
| 2005 | 2.5% | 0.5% | 2.4% | 2.5% | 2.7% | 1.9% | 2.5% | 2.9% | 1.9% | 3.1% |
| 2010 | 1.1% | 0.5% | 3.9% | 2.8% | 3.1% | 2.4% | 4.6% | 3.5% | 5.8% | 5.6% |
| 2015 | 2.2% | 0.6% | 3.6% | 2.4% | 3.3% | 2.7% | 5.3% | 2.9% | 4.1% | 5.1% |
| 2016 | 2.2% | 0.5% | 3.6% | 2.3% | 3.8% | 2.7% | 5.8% | 2.7% | 4.3% | 4.8% |
| 2017 | 2.4% | 0.6% | 3.1% | 2.1% | 3.9% | 2.9% | 4.7% | 3.0% | 4.7% | 4.8% |
| 2018 | 2.5% | 0.5% | 2.8% | 1.7% | 3.4% | 2.5% | 4.5% | 2.8% | 4.3% | 4.4% |
| 2019 | 3.6% | 0.6% | 4.6% | 2.0% | 4.6% | 2.8% | 4.9% | 2.7% | 5.0% | 4.3% |
| 2020 | 3.3% | 0.4% | 4.1% | 1.6% | 4.2% | 2.2% | 4.9% | 2.4% | 5.1% | 3.7% |
| 2021 | 2.3% | 0.5% | 3.6% | 1.2% | 3.2% | 2.6% | 6.7% | 2.4% | 4.4% | 3.2% |
Source: Factset, Datastream
5/ PAYOUT RATIO
The payout ratio is the percentage of earnings from a given year that is distributed to shareholders in the form of dividends. It is calculated by dividing dividends by earnings for the given year:

When the payout ratio is above 100%, a company is distributing more than its earnings; it is tapping its reserves. Conversely, a payout close to 0% indicates that the company is reinvesting almost all its earnings into the business. In 2018, European companies paid out an average of about 45% of their earnings.
It will be clear that the higher the payout ratio, the weaker future earnings growth will be. The reason for this is that the company will then have less funds to invest. As a result, fast-growing companies such as SolarWorld and Google pay out little or none of their earnings, while a mature company would pay out a higher percentage of its earnings. Mature companies are said to have moved from the status of a growth stock to that of an income stock (also called a yield stock), i.e. a company that pays out in dividends a large part of its net income, such as a utility.
The dividend is legally drawn on parent company profits. However, it should be assessed on the basis of consolidated net attributable profit – the only meaningful figure, as in most cases the parent company is merely a holding company.
2021 ArcelorMittal's payout ratio is not relevant as the company will pay a dividend whereas it was loss making (EPS of –$1.20) in 2020.
6/ BOOK VALUE OF EQUITY (OR NET ASSET VALUE) PER SHARE
Book value of equity per share is the accounting estimate of the value of a share. While book value may appear to be directly comparable to equity value, it is determined on an entirely different basis – it is the result of strategies undertaken up to the date of the analysis and corresponds to the amount invested by the shareholders in the company (i.e. new shares issued and retained earnings).
Book value may or may not be restated. This is generally done only for financial institutions and holding companies.
7/ COST OF EQUITY (EXPECTED RATE OF RETURN)
According to the CAPM (see Chapter 19), the cost of equity is equal to the risk-free rate plus a risk premium that reflects the stock's market (or systematic) risk.
8/ SHAREHOLDER RETURN (HISTORICAL RATE OF RETURN)
In a given year, shareholders receive a return in the form of dividends (dividend yield) and the increase in price or market value (capital gain):
Total shareholder return (TSR) is calculated in the same way, but over a longer period. It reflects the IRR of the investment in the stock.
9/ LIQUIDITY
A listed security is said to be liquid when it is possible to buy or sell a large number of shares on the market without it having too great an influence on the price. Liquidity is a typical measure of the relevance of a share price. It would not make much sense to analyse the price of a stock that is traded only once a week, for example.
A share's liquidity is measured mainly in terms of free float, trade volumes and analyst coverage (number of analysts following the stock, quality and frequency of brokers' notes).
(a) Free float
The free float is the proportion of shares available to purely financial investors, to buy when the price looks low and sell when it looks high. Free float does not include shares that are kept for other reasons, i.e. control, sentimental attachment or “buy and hold” strategies.
Loyalty is (unfortunately) not a financial concept and a skyrocketing share price could make sellers out of loyal shareholders, thus widening the free float.
Free float can be measured either in millions of euros or in percentage of total shares.
(b) Volumes
Liquidity is also measured in terms of volumes traded daily. Here again, absolute value is the measure of liquidity, as a major institutional investor will first try to determine how long it will take to buy (or sell) the amount it has targeted. But volumes must also be expressed in terms of percentage of the total number of shares and even as a percentage of free float. Liquidity is generally considered good when more than 0.2% of the free float is traded each day.
10/ MARKET CAPITALISATION
Market capitalisation is the market value of company equity. It is obtained by multiplying the total number of shares outstanding (number of shares issued less the number of treasury shares1, see Section 7.19) by the share price.
However, rarely can the majority of shares be bought at this price at the same time, for example, in an attempt to take control and appoint new management. Most often, a premium must be paid (see Chapters 31 and 45).
It is a mistake to take only the shares in free float in determining market capitalisation. All shares must be included, as market cap is the market value of company equity and not of the free float.
By way of illustration, you will find in the appendix to this book the top twenty market capitalisations of the world's major economies.
On 6 May 2021, ArcelorMittal had a market cap of $34,920m.
Section 22.2 MULTIPLES
In order to understand the level of stock prices, investors must make some comparisons with comparable investments (similar stocks). By doing so, they can arbitrage between stocks, taking into account their belief about the companies' qualities and the level of their prices. To achieve this objective, investors normally relate the stock price to a financial item.
There are two basic categories of multiples:
- those which allow for a direct estimate of the market capitalisation. In this section, we will refer specifically to the price to earnings ratio (P/E);
- those which are independent of the capital structure of the company. These multiples allow for the estimate of the value of the entire firm (firm or enterprise value) or, similarly, the market value of the capital employed. The EBIT multiple (EV/EBIT) and the EBITDA multiple (EV/EBITDA) will be presented in this section. Since capital employed is financed by equity and net debt, the enterprise value must then be allocated between creditors (first) and shareholders. The following formula shows how to derive the value of equity from the enterprise value:
1/ EBITDA AND EBIT MULTIPLES
(a) The principle
Investors interested in estimating the enterprise value of a company frequently find that the stock market believes that a fair value for similar companies could be, for example, eight times their EBIT (or operating profit). With a pinch of salt, the investor can then decide to apply the same multiple to the EBIT of the company they are considering.
Investors name this ratio the EBIT multiple:

If the operating profit remains unchanged, and disregarding corporate income taxes and discounting, these figures imply that investors must wait eight years before they can recover their investment. Conversely, if the operating profit increases, they will not have to wait so long.
In practice, when applying the multiple, financial analysts prefer using the operating profit of the current period or of the next period.
Where the comparison is made using companies with significant different corporate income tax rates (because they belong to different countries, for example), it is more appropriate to consider an operating profit net of taxes (net operating profit after tax, or NOPAT). This result can easily be obtained by multiplying the operating profit by (1 – the observed corporate tax rate). This is rarely done.
Similarly, EBITDA multiple can be computed as:
(b) The multiple drivers
Although the EBITDA/EBIT multiples are ratios that summarise a lot of information, their value is basically determined by three factors: the growth rate of the operating profit, the risk of capital employed and the level of interest rates.
- The growth rate of the operating profit. There is a certain degree of correlation between the multiple and the expected growth of the operating profit. This is no surprise. Investors will be more willing to pay a higher price if the operating profit is expected to grow at a high rate (as long as the firm creates value, i.e. the investments generate a sufficient return). They are now buying with a high EBITDA/EBIT multiple based on current EBITDA or operating profit but with a more reasonable EBITDA/EBIT multiple based on future EBITDA or operating profit that is expected to be much higher.
The reverse is also true: investors will not be ready to pay a high EBITDA/EBIT multiple for a company, the EBITDA or operating profit of which is expected to remain stable or increase slowly. Hence the low multiples for companies with low growth prospects.
The reader should also not forget that behind the growth of the EBITDA/operating profit is the growth of both revenues and EBITDA/operating margins.
The following graph shows the relation between the medium-term growth rate of the operating profit of some European companies and their multiples.

Source: Data from Exane BNP Paribas
- The risk of the capital employed. The link between growth rate and multiples is not always verified in the market. Sometimes some companies show a low multiple and a high growth rate, and vice versa.
This apparent anomaly can often be explained by considering the risk profile of the company. Analysts and investors in fact do not take the expected growth rate for granted. Thus, they tend to counterweight the effects of the growth rate with the robustness of these estimates.
- The level of interest rates. There is a strong inverse correlation between the level of interest rates and the EBITDA and EBIT multiples. This link is rather intuitive: our reader is, in fact, perfectly aware that high interest rates increase the returns expected by investors (think, for example, about the CAPM equation!), thus reducing the value of any asset.
Generally speaking, we can say that the level of the multiple can be frequently explained – at a specific moment – by the current level of interest rates in the economy.
The EBITDA and EBIT multiples allow us to assess the company valuation compared to the overall market.
2/ PRICE TO EARNINGS (P/E)
(a) The principle
Even if the EBITDA and EBIT multiples have become very popular in the investor and analyst community, a ratio simpler to compute has been used for a while to determine share prices. The P/E (price/earnings ratio), which, when multiplied by the earnings per share (EPS), provides an estimate for the value of the share.
P/E is equal to:
Another way to put this is to consider the aggregate values:
EPS reflects theoretical value creation over a period of one year. Unlike a dividend, EPS is not a revenue stream.
As an illustration, the following table shows the P/E ratios of the main markets since 1990. We can see the impact of the 2000 bubble on P/Es for technology, media, and telecommunications groups but also the impact of shifts in the automobile industry (electric, autonomous cars) in 2019.
While there is no obligation to do so, P/E is based on estimated earnings for the current year. However, forward earnings are also considered; for example, P/EN +1 expresses the current market value of the stock divided by the estimated earnings for the following year. For fast-growing companies or companies that are currently losing money, P/EN +1 or P/EN +2 are sometimes used, either to give a more representative figure (and thus avoid scaring the investor!) or because, in the case of loss-making companies, it is impossible to calculate P/E for year N.
The widespread use of P/E (which is implicitly assumed to be constant over time) to determine equity value has given rise to the myth of EPS as a financial criterion to assess a company's financial strategy. Such a decision might or might not be taken on the basis of its positive or negative impact on EPS. This is why P/E is so important, but it also has its limits, as we will demonstrate in Chapters 26, 27 and in Section IV.
HISTORICAL P/E RATIOS – PAN-EUROPEAN SECTORS (AS OF 1 JANUARY)
| Years | Automotive | Biotechnology | Chemistry | Defence | Financial Institutions | Food | Oil & Gas | Real Estate | Telecom | Utilities |
|---|---|---|---|---|---|---|---|---|---|---|
| 1990 | 6.7 | 21.7 | 8.3 | 6.9 | 16.1 | 14.1 | 11.2 | 24.8 | 12.8 | 11.1 |
| 1995 | 13.4 | 30.4 | 13.5 | 14.3 | 14.1 | 12.9 | 17.3 | 20.4 | 12.7 | 13.4 |
| 2000 | 13.2 | 180.5 | 18.4 | 19.0 | 19.3 | 17.1 | 38.5 | 21.2 | 51.7 | 17.3 |
| 2005 | 12.6 | 25.6 | 24.9 | 32.6 | 15.8 | 17.8 | 15.4 | 19.6 | 20.5 | 13.9 |
| 2010 | 52.5 | 19.0 | 20.4 | 10.4 | 13.8 | 11.8 | 18.4 | 13.0 | 12.3 | 11.2 |
| 2015 | 8.6 | 25.0 | 14.9 | 17.2 | 13.4 | 22.3 | 11.0 | 17.1 | 17.0 | 13.6 |
| 2016 | 9.7 | 40.3 | 13.4 | 17.1 | 11.9 | 16.3 | 16.8 | 17.8 | 20.2 | 14.0 |
| 2017 | 9.3 | 31.5 | 19.0 | 19.7 | 12.5 | 24.2 | 25.1 | 17.1 | 13.5 | 13.7 |
| 2018 | 9.0 | 42.5 | 17.9 | 27.3 | 12.8 | 25.5 | 21.7 | 18.2 | 15.5 | 13.4 |
| 2019 | 6.2 | 22.8 | 10.0 | 21.5 | 10.1 | 18.9 | 11.8 | 13.9 | 15.3 | 13.8 |
| 2020 | 8.9 | 37.4 | 8.1 | 21.4 | 11.6 | 27.2 | 15.9 | 19.6 | 17.5 | 13.2 |
| 2021 | 22.8 | 42.4 | 22.5 | 24.1 | 11.8 | 19.8 | 85.4 | 21.0 | 15.0 | 20.5 |
Source: Data from Factset, Datastream
P/E is conceptually similar to the EBIT multiple, and even more so to the NOPAT multiple. The latter is a division of enterprise value by after-tax operating profit, while P/E is a division of market value of equity by net profit.
Hence, many of the things we have said about the EBIT multiple also apply to P/E:
- Another way of understanding P/E is to note that it expresses market value on the basis of the number of years of earnings that are being bought. Thus, an equity value of 100 and earnings of 12.5 means the P/E is 8. This means that if EPS remains constant, the investor will have to wait eight years to recover their investment, while omitting corporate income taxes and discounting. If the EPS rises (falls), the investor will have to wait less (more) than eight years.
- In an efficient market, the greater the EPS growth, the higher the P/E and vice versa (on condition that the firm creates value, i.e. has a higher ROE than the rate of return required by shareholders).
- The greater the perceived risk, the lower the P/E and vice versa.
- P/E is inversely proportional to interest rates: all other factors being equal, the higher the interest rates, the lower the P/Es and vice versa, again assuming efficient markets.
P/E is used in the same way as the EBITDA or EBIT multiple. To value a company, it is useful to set it alongside other companies that are as comparable as possible in terms of activity, growth prospects and risk, and then apply their P/E to it.
P/E reflects a risk that the EBIT multiple does not – financial structure – which comes on top of the risk presented by the operating assets.
(b) P/E and investors' required rate of return
Inverse P/E, also called earnings yield, is sometimes mistakenly used in approximating investors' required rate of return. This should only be done in those very rare cases where earnings growth is nil and the company pays out 100% of its earnings. Here is our reasoning:
Then:
and thus:
The P/E of a company with an EPS of 12 that is trading at 240 would then be:
The inverse P/E is just 5%, whereas the required return nowadays is probably about 8%.
All in all, the inverse P/E reflects only an immediate accounting return for a new shareholder who has bought the share for V and who has a claim on EPS:
- A very low return means that shareholders expect EPS growth to be strong enough to ultimately obtain a return commensurate with their required rate of return.
- A very high rate means that immediate return is uncertain and shareholders expect negative EPS growth to ultimately bring accounting return closer to their required rate of return.
- A normal rate, i.e. in line with the required rate of return, means that EPS growth is expected to be nil, and the investment is considered a perpetual annuity.
3/ OTHER MULTIPLES
Apart from the EBIT multiple and the P/E, investors and analysts sometimes use the following multiples.
(a) Sales multiple
Sometimes the value of the firm is assessed in proportion to its sales, and the ratio enterprise value/sales is then computed. This ratio is often used to derive the value of shops or very small companies. For example, a rule of thumb holds that within the food industry, businesses are worth twice the amount of their sales, whereas a telecoms company is worth three times its sales.
Using such multiples implies that the compared firms have the same type of margin. It implies somehow a normative return over sales for firms in a certain sector.
We believe that sales multiples should not be used for mid-sized or large companies as they completely disregard profitability. They have often been used in the past, in times of bull markets, to value emerging technology, for example, as such companies did not show a positive EBIT!
The same type of criticism can be levelled against multiples of numbers of subscribers, numbers of clicks, etc., or other multiples of volume of activity. These multiples not only assume a comparable return over sales but also the same revenue per unit.
(b) Free cash flow multiple
The ratio of enterprise value to free cash flow, or EV/FCF, is a concept similar to the multiple of operating income mutatis mutandis. It represents the number of times free cash flow is capitalised by the enterprise value.
This ratio should be a much better indicator than the EBIT multiple, whose accounting nature of the denominator makes it susceptible to manipulation. Indeed, free cash flow is the cash flow that the firm can redistribute to its fund providers, shareholders and lenders, after financing its investments. However, it is of little significance for companies with weak or negative cash flows because they are in a strong growth phase or at the bottom of the cycle.
In other words, this ratio only makes sense for mature groups whose investments are stable, making free cash flow very significant. The inverse of this ratio is called free cash flow yield.
(c) Price to book ratio (PBR)
The PBR (price to book ratio) measures the ratio between market value and book value:

The PBR can be calculated either on a per share basis or for an entire company. Either way, the result is the same.
It may seem surprising to compare book value to market value, which, as we have seen, results from a company's future cash flow. Even in the event of liquidation, equity value can be below book value (due, for example, to restructuring costs, accounting issues, etc.).
However, there is an economic link between book value and market value, as long as book value correctly reflects the market value of assets and liabilities.
It is not hard to show that a stock's PBR will be above 1 if its market value is above book value, when the ROE is above the required rate of return (kE). The reason for this is that if a company consistently achieves 15% ROE, and the shareholders require only 10%, then a book value of 100 would mean an equity value of 150, and the shareholders will have achieved their required rate of return:
However, the PBR will be below 1 if the ROE is below the required rate of return (kE).
Theoretically, a sector cannot show equity value below book value for long, as sector consolidation will soon intervene and re-establish a balance, assuming that markets are efficient. Nor can a sector have equity value higher than book value for long, as new entrants will be attracted to the sector and bring down the abnormally high returns. Market equilibrium will sooner or later have been re-established.
As an illustration, here are the PBRs seen on the main European markets since 1990:
PBR – PAN-EUROPEAN SECTORS (AS OF 1 JANUARY)
| Years | Automotive | Biotechnology | Chemistry | Defence | Financial Institutions | Food | Oil & Gas | Real Estate | Telecom | Utilities |
|---|---|---|---|---|---|---|---|---|---|---|
| 1990 | 1.2 | nm* | 1.5 | 0.9 | 1.5 | 1.8 | 1.7 | 1.2 | 1.5 | 1.3 |
| 1995 | 1.2 | nm* | 1.5 | 1.3 | 1.1 | 1.7 | 1.9 | 1.0 | 1.7 | 1.5 |
| 2000 | 1.8 | 5.4 | 2.2 | 2.2 | 2.0 | 1.8 | 2.6 | 0.9 | 4.2 | 2.2 |
| 2005 | 1.1 | 3.8 | 1.7 | 1.7 | 1.8 | 3.9 | 2.9 | 1.3 | 3.0 | 2.2 |
| 2010 | 0.9 | 3.4 | 2.0 | 1.6 | 1.1 | 3.5 | 1.8 | 1.0 | 2.3 | 1.6 |
| 2015 | 1.2 | 5.2 | 2.1 | 2.7 | 1.0 | 3.7 | 1.0 | 1.2 | 2.4 | 1.2 |
| 2016 | 1.2 | 6.7 | 2.0 | 3.6 | 1.0 | 3.7 | 1.0 | 1.3 | 2.6 | 1.3 |
| 2017 | 1.1 | 6.2 | 2.4 | 3.8 | 0.9 | 3.7 | 1.3 | 1.1 | 2.3 | 1.4 |
| 2018 | 1.2 | 5.3 | 2.6 | 3.9 | 1.1 | 4.0 | 1.4 | 1.3 | 2.6 | 1.5 |
| 2019 | 0.9 | 4.1 | 1.6 | 3.9 | 0.9 | 3.7 | 1.3 | 1.1 | 2.3 | 1.5 |
| 2020 | 0.9 | 5.1 | 1.6 | 5.6 | 1.0 | 5.0 | 1.2 | 1.3 | 2.3 | 1.8 |
| 2021 | 1.1 | 5.8 | 2.0 | 5.6 | 0.9 | 5.1 | 1.1 | 1.3 | 2.0 | 2.2 |
* nm = not meaningful
Source: Data from Factset, Datastream
Section 22.3 KEY MARKET DATA
We are now able to fill in the blanks of the chart below, but it will only make sense if you have first assessed the company's strategy and finances.
We have filled in the data for ArcelorMittal, whose free float is significant (c. $18bn) and is covered by 20 analysts.
ArcelorMittal's share price is highly dependent on changes in raw material prices, in particular steel and iron ore, the price of which has decreased significantly between 2014 and 2016, and again between 2018 and 2019 as a result of trade tensions between China and the United States. As a result, ArcelorMittal's share price was halved between end 2014 and end 2015, before being multiplied by 3.5 since its low of February 2016, following which it then crashed by 50% from its highs of early 2018 and was again multiplied by 3 from a low point in May 2020. This is a cyclical investment!
In 2018, the payment of a symbolic dividend started again, after having stopped in 2016, given its negative free cash flows. Payment of dividend was again suspended in 2020 and resumed in 2021.
As we noticed earlier, ArcelorMittal does not create value, its ROE (9.4% in 2018) being negative below the return required by shareholders (c. 12% given the risk). Its market capitalisation is therefore below the book value of equity (even if lowered in 2015 by exceptional impairment).
Liquidity is very high, with over 1% of capital exchanged on average every day.
KEY MARKET DATA ON ARCELORMITTAL
| Past | Current | Future | |||
|---|---|---|---|---|---|
| In $ | 2019 | 2020 | 2021 | 2022 | 2023 |
| Adjusted share price | |||||
| High | 24.24 | 19.25 | 26.37 | ||
| Low | 12.53 | 6.46 | 17.58 | ||
| Average or last | 17.54 | 19.16 | 26.37 | ||
| Absolute data | |||||
| Number of fully diluted shares (m) | 1,021 | 1,080 | 1,080 | ||
| Market capitalisation (m) | 17,908 | 20,693 | 28,480 | ||
| Equity, group share (m) | 38,521 | 38,280 | 43,885 | 46,054 | 48,165 |
| Value of net debt (m) | 19,997 | 14,000 | 11,437 | ||
| Enterprise value (m) | 39,999 | 40,690 | 42,480 | ||
| Multiples | |||||
| Fully diluted EPS | –2.40 | –0.68 | 5.10 | 3.51 | 3.07 |
| EPS growth | n.s. | n.s. | n.s. | –31% | –13% |
| P/E | n.s. | n.s. | 5.2 | 7.5 | 8.6 |
| Operating profit (m) | 1,202 | 451 | 8,334 | 5,664 | 4,872 |
| EBIT multiple | 35.3 | n.s. | 5.1 | 7.5 | 8.7 |
| Price/book ratio (PBV) | 0.5 | 0.5 | 0.5 | ||
| Dividend | |||||
| Dividend per share (DPS) | 0.30 | 0.00 | 0.30 | 0.43 | 0.47 |
| DPS growth | n.s. | n.s. | n.s. | 43% | 9% |
| Net yield | 1.7% | 0.0% | 1.1% | ||
| Payout | –12% | n.s. | 6% | 12% | 15% |
| Return | |||||
| Beta (β) | 1.9 | 2.4 | 2.1 | ||
| Risk premium: rM – rF | 6.8% | 10.3% | 8% | ||
| Risk-free rate: rF | –0.4% | –0.5% | –0.5% | ||
| Required rate of return: kE | 12.5% | 24.2% | 16.3% | ||
| Return on equity: rE | –6.4% | –1.9% | 12.6% | ||
| Actual return (capital gains and dividends) | –15% | 9% | 39% | ||
| Liquidity | |||||
| Free float | 62.4% | 64.4% | 64.4% | ||
| Share of capital traded daily | 0.55% | 0.54% | 0.62% | ||
| Number of analysts covering the stock | 24 | 21 | 20 | ||
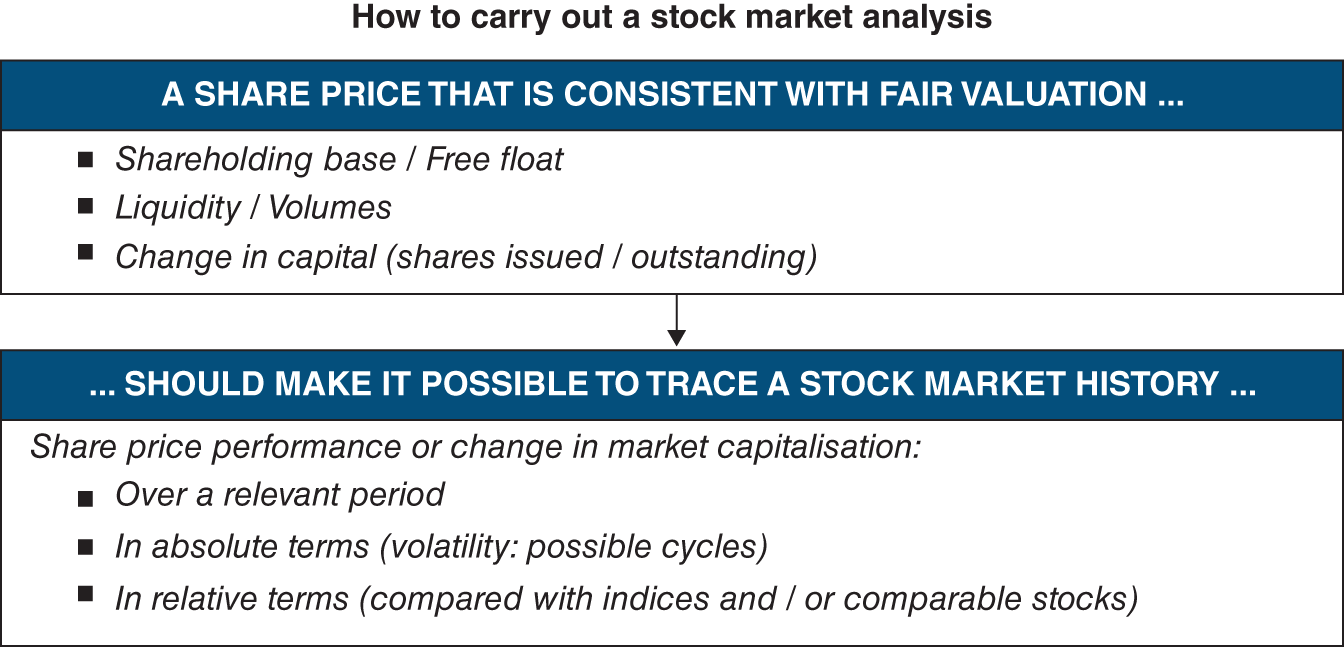
Section 22.4 HOW TO PERFORM A STOCK MARKET ANALYSIS
In order to perform a stock market analysis, we advise readers to follow the following battle plan tailored by Marc Vermeulen:

Readers who are not new to corporate finance are advised to follow on from this chapter by reading Chapter 31, which is the logical continuation of this chapter.
Section 22.5 ADJUSTING PER SHARE DATA FOR TECHNICAL FACTORS
1/ REWRITE HISTORY, IF NECESSARY
“Let's not mix apples with oranges.” This old saying applies to the adjustment of per share data after the detachment of rights and for free share awards and rights issues which, from a technical point of view, can modify the value of a stock.
(a) Free share awards
Suppose a company decides to double its equity by incorporating its reserves, and issues one new share for each existing share. Each shareholder is then the owner of twice as many shares without having paid additional funds and with no change to the company's financial structure. The unit value of the shares has simply been divided into two.
Naturally, the company's equity value will not change, as two shares will be equal to one previously existing share. However, the share price before and after the operation will have to be adjusted to obtain a comparable series.
In this case, simply divide the shares existing after the free share award by two. The adjustment coefficient is 1/2.
More generally, if new shares are issued for N already existing shares, then the adjustment coefficient is as follows:
(b) A rights issue with an exercise price below the current share price
This is the second reason we might have to adjust past per share data. We will go further into detail in Chapter 25, which deals with share offerings.
To subscribe to the new shares, investors must first buy one or more preemptive subscription rights detached from previously existing shares, whose price is theoretically such that it doesn't matter whether they buy previous existing shares or use the rights to buy new ones. The detachment of the right from the existing shares makes an adjustment necessary.
For a rights issue, the adjustment coefficient is:

If P is the price of the already existing share, E the issue price of the new shares, the number of new shares and N the number of already existing shares, then the adjustment coefficient will be equal to:

To make the adjustment, simply multiply all the share data (e.g. price, EPS, DPS, BV/S) before the detachment by this coefficient.
As you have seen, the adjustment consists in rewriting past stock performance to make it comparable to today and tomorrow, and not the reverse.
2/ THE IMPACT OF FUTURE TRANSACTIONS
When equity-linked securities (convertible bonds, mandatory convertibles, bonds with warrants attached, stock options, etc.) have been issued, financial managers must factor these potential new shares into their per share data. Here again, we must adjust in order to obtain an average number of outstanding shares.
As there is at least potential dilution, we have to assume full conversion in calculating the per share data (EPS, BV/S, etc.) on a fully diluted basis. This is easy to do for convertible bonds (CBs). Simply assume that the CBs have been converted. This increases the number of shares but lowers financing costs, as interest is no longer paid on the CBs.
For warrants (or stock options), two methods can be used. The first method, called the treasury method, is commonly used: it assumes investors will exercise their in-the-money2 warrants and the company will buy back its own shares with the proceeds. The company thus offsets some of the dilution caused by the exercise of the warrants. This is the method recommended by the IASB.
The following example will illustrate the method: on 1 September 2016, Loch Lomond Corporation decided to issue 100,000 equity warrants exercisable from 1 January 2019 to 1 January 2023 at one share at €240 per warrant.
In 2021, EPS is €10m (net income 2021) divided by 1,000,000 (number of shares), i.e. €10.
As of 31 December 2021, Loch Lomond's share price is €300, all the warrants are in the money and thus are assumed exercised: 100,000 new shares are issued. The exercise of the warrants raises the following sum for the company: 100,000 × €240 = €24,000,000.
The company could use this money to buy back 80,000 of its own shares trading at €300. Fully diluted EPS can be computed as follows:
Note that only in-the-money diluting securities are restated; out-of-the-money securities are not taken into account.
The second method, called the investment of funds method, assumes that all investors will exercise their warrants and that the company will place the proceeds in a financial investment. Let's go back to that last example and use this method.
In this method, we assume all warrants are exercised by investors and the proceeds are invested at 0.2% after taxes pending use in the company's industrial projects. Fully diluted EPS would be as follows:
As can be seen, the two methods produce different results as a direct consequence of the different uses of the cash proceeding from the exercise of warrants.
The treasury method can be considered to be the closest to the financial markets, as the main figure it uses is the company's share price. However, the treasury method assumes that the best investment for a company is to buy back its own shares.