
chapter three Plan—Project feasibility study

So it is, said the Wise Eagle, that it takes quality time to generate unnecessary costs.
Darloz
3.1 Introduction to Chapter 3
A prefeasibility study seeks to validate a project and to expose organizational spots or problems that may condemn it before it sees the light of day, using a limited number of analytical tools. A prefeasibility study does not concentrate on the day-to-day operations; in other words, it doesn’t look into the specifics of tasks or the team member composition. This is something that the feasibility study does. From this perspective, a feasibility study is very pragmatic; once we have defined the project in approximate terms using the five frames of analysis, we can then examine how this is going to translate into daily operations, most evident during the transformation phase.
Should the prefeasibility study be conclusive, the project promoter is invited to feed in more information to the analyst. The feasibility expert scrutinizes all the possible contextual risks (environmental, legal, political, etc.) that trigger or amplify Existing vulnerabilities. Some authors have echoed the idea that a feasibility study consists of a thorough analysis of the different project components,1 including assessing its risks, identifying its key components, and measuring its impacts in order to reach a “go,” “no go,” or “put on hold” decision.
As an example, let’s take the case of the replacement of the Champlain Bridge that connects the island of Montréal to its south shore and the United States and which is nearing the end of its useful life. The 4.2-billion-dollar (C$) project will inevitably generate a perimeter of intense noise (machinery, etc.) and dust in an urban area that is quite populated. Natural ecosystems are threatened. A thorough environmental feasibility study is required. A feasibility analyst could linger on whether or not the construction is feasible, taking into account dust and displacements of rare animal and plant species as well as maximum noise levels. Of course, that would not be enough in this case: other aspects such as financial and technical concerns would also have to be addressed.
This chapter addresses the notion of project feasibility. It discusses in more detail the concept of PRO (Pessimistic, Realistic, and Optimistic) scenarios, the triple constraints. It also introduces the concept of POW (Product, Organization, and Work) breakdown structures, and makes additional comments on the notion of POVs (points of vulnerability).
3.2 Some characteristics of feasibility studies
Sound feasibility studies include the five analytical frames of the prefeasibility study in their introductory sections, with, of course, more attention to detail and to People, especially management and team members (the Forces of Production, FPs). The costs of such studies vary; some authors write that feasibility analyses for small projects may cost US$100,000 while the bill may inflate to more than US$1MM for large projects.2
There is no standard format for feasibility studies, as each expert firm or analyst tends to adapt the format to the particular project to his own style. We are not competing with existing prefeasibility or feasibility forms or formats; we are merely seeking to develop tools for uncovering points of vulnerability. The theory and tools that I have provided so far and that we will continue to discuss throughout this book are designed to help the analyst to make up his mind regarding the future of a project. It is much better to spend time dealing with current situation than having to react after the fact. Often, a POV exists when one thinks that there’s none. The Chinese constructed the Great Wall thinking this would stop any possible attack from the northern tribes, but all it took was one person to open one of the fortified gates to the enemy to render futile the entire 13,000 miles of rock and sweat. Similarly, the French conceived the Maginot Line after WWI believing it was the best defense against their Eastern neighbors, but it took a curt ride through the Ardennes Woods during WWII for the Nazis to take over the country. In both cases, marvelous (and costly) undertakings contained an inherent point of vulnerability while an entire population felt confident it was shielded as never before.
Some authors have put forth some specific layouts for feasibility studies. The following sequence has been proposed3: (1) expressing the vision of the project; (2) conducting an informal analysis (which I called the “initial value proposition” of a given project); (3) conducting a prefeasibility analysis (which we reviewed in Chapter 2); (4) conducting a market analysis (this is part of a marketing assessment of a feasibility study, which aims to prove that there is indeed an opportunity); (5) doing a technical analysis (again, this is one of the eight risks areas that can be explored); and (6) performing a financial analysis (mandatory in any project).
As mentioned in the previous chapter, all feasibility studies do not necessarily have to examine every angle of the contextual frame of risks. For example, a project may not require extensive technical analysis; however, every project involves humans and as such, a close look at the makeup of the management force and team is imperative. Who wants Unfits (uncontrolled Forces of Production, FPnc) on his team, whether among the work-force or in management? In short, a feasibility study addresses each of the four Ps (Plans, Processes, People, and Power), including People and Power since they are, in the end, the ones accountable for ensuring that norms of quality are met.
Contextual risks may overlap. A marketing campaign must respect legally binding rules: the feasibility analyst will scrutinize the Consumer Protection Act, laws relating to trademarks, signage and labeling, and so forth. If the study is based on technical specifications, the expert may emphasize contracts, health and safety standards, industry standards, laws relating to product safety, weights and measures, and so on. In the case of an environmental study, bylaws and zoning regulations will be inescapable. Laws on taxation (financial risk) are, of course, inescapable.4 The contextual frame of risks can be complex, which makes it that much more necessary to ensure a project is least vulnerable.
While the prefeasibility study sets some parameters (when assessing the parametric frame), the feasibility study digs further into the subject and verifies that all key stakeholders (People and Power) are taken into consideration. For example, in a Private–Public Partnership structure, stakes will change depending on the point of view (Table 3.1).
While there are similar ambitions (e.g., profitability for both the private and government sectors), there are important divergences of interests (e.g., political interest). Hence, the value of the project will be assessed differently depending on the project and the stakeholders. This provides a fertile ground for external “bad apples” and internal Unfits (uncontrolled Forces of Production, FPnc) to surface: this is regularly seen when a project that does not please a community is pushed forward or when employees start expressing discontent. The sociocultural clash between the community and management may invite some internal team members (Forces of Production) to behave contrary to the well-being of the organization. This is in line with the observation made in Chapter 2; having a poor plan while operating with Unfits (uncontrolled Forces of Production, FPnc) is a recipe for disaster. Building on these observations, we can conclude that the four Ps, as they interact with each other in the transformation phase, are critical. Anything that jeopardizes the harmony between the four Ps begets a POV.

In a feasibility study, as mentioned, People are a core element; the same comment applies to Plans, Processes, and Power. The Project Management Body of Knowledge (PMBOK) remains quite general in terms of People, as it focuses mostly on processes, being engineering oriented. However, projects are conceived, initiated, managed, completed, enjoyed by individuals.
A general definition of a project feasibility study is as follows:
3.2.1 Definition of project feasibility study
A project feasibility report is a comprehensive study which examines in detail the five frames of analysis of a given project in consideration of the four Ps, its risks, POVs, and its constraints (calendar, costs, and norms of quality) in order to determine whether it should go ahead, be redesigned, or else totally abandoned.
This is illustrated in Figure 3.1.
In the Québec Multifunctional Amphitheatre (QMA) case, a color-coding system was chosen to express changes to the project chart in the Programme fonctionnel et technologique (PFT) as follows:
Green: Proposed changes are accepted conditional to changes.
Yellow: Proposed changes must be further specified/explained and then validated by the City of Québec.
Red: Proposed changes refused by the City of Québec.

3.3 Triple constraints
As seen in Chapter 2, there are walls, ceilings, and floors to take into account in any project worth this name. The triple constraints,5 which I sometimes call the “Bermuda Triangle” refers to the quasi-mutually exclusive requirements to meet set deadlines, to abide by forecasted costs, and to respect quality criteria (with quality being the result of the four Ps working tightly together in order to meet these criteria).6 It is by measuring the time line (risks affect the time line more directly), costs (POVs affect the costs more directly), and norms of quality (errors or deviations from standards affect quality more directly) that project performance can be evaluated. There is no need for other measurements, even though some authors add elements such as customer satisfaction or scope. Time line, costs, and norms of quality can be assessed objectively, consistently, and precisely; this is not the case for customer satisfaction, for example, which is eminently subjective. Costs in particular can be measured along three axes: planned, actual, and forecasted.7 As put forth by some authors: “The traditional definition of project management is the accomplishment of a stated objective on time, within budget, to technical specification.”8 I fully agree.
The PMBOK ascribes the term “scope” while others privilege the word “performance”9 to what I refer to as “norms of quality”. Other authors use the term “quality”. From my perspective, in order to remain consistent with my logic, the three constraints have to be exactly that: constraints, limits that cannot be transgressed or stretched without dire consequences. A scope is not a constraint; however, norms of quality certainly are, and so are, albeit indirectly and in a large sense, the four Ps, since they interact in the transformation phase, and since they are accountable for meeting, failing to meet, or exceeding the norms of quality.
An example of time, costs, and norms of quality interacting with each other is the preparation of a resin gel with a hardener: too much hardener compromises the hardening process, as the act of adding sufficient hardener is bound by time. The laminating job of, say, a boat made of fiberglass has to be completed before the gel hardens, and yet, the laminator has to ensure that all of the air bubbles are removed.
Typically, walls refer to calendars of activities, which have a beginning and an end. Floors are the absolute minimum quality standards that must be met while ceilings correspond more naturally to maximum allowable costs. As seen before, ranges can be put in each of these coding elements: a maximum cost (ceiling) does not preclude the existence of a range of acceptable values for costs, say from US$35,000 to US$50,000, but it states that US$50,000 is the maximum amount that can be reached without sounding the alarm bell.10
I like to refer to this view of things as the “Bermuda Triangle” because the Bermuda region is well known for being a dangerous zone with inexplicable aircraft and vessel disappearances. In project management, there is also an area of disasters (chaos, which we will study in Chapter 7) so to speak, defined by the outer limits of the constraints of a schedule, costs, and norms of quality.
One way to go about an investigation into the feasibility of a project is to pose questions that dig further and further into potential problems while including each of the three constraints—calendars, costs, and norms of quality. For example, for each major task listed during a transformation phase11 (vision, planning, mobilization,12 deployment, and completion/evaluation), the questions could be: “Are the right people available to accomplish them?” If yes, “Can they complete the task in time?” And if so, “Can they be afforded?” The same procedure can apply for each of the four Ps. Given a specific task, the analyst may ask: “Is the person in authority able to provide the necessary guidance?” If yes, “What salary does he command?”
The “triple constraints” concept is composed of three axes of potential vulnerability: time, costs, and norms of quality. The problem is that it is nearly impossible to abide by the limits of these three constraints at once. Inevitably, if a project is deferred, costs will be incurred. If a deadline is to be achieved in a hurry and contrary to plan, norms of quality may have to be compromised (sometimes in a dishonest fashion).
Recall that each project is a closed dynamic system that is assumed to evolve in a linear, ascending fashion (this is one of my many hypotheses). If the system is bounded, it also necessarily has a ceiling and a floor. This is represented by upper and lower barriers of sorts. I postulate that this results in a convex and a concave curve that delimits the chaos area. The ensuing image is shown in Figure 3.2.
We will see in Chapter 7 how to measure these limits. I will also explain then why there is a concave and a convex limit. This overall “football” shape epitomizes the fact that, if we were to put time, costs, and norms of quality on three orthogonal axes, the growth curve of the project (linear and ascending) would have to bend in order to accommodate each element. Outside the limits of such a “football”, things tend to get out of control. Moreover, you don’t want to see an employee the size and the strength of a 6-foot-5, 325-pound professional football middle linebacker out of control, do you? Maybe on your enemy’s field, but not on yours anyway!

Within the “football”, less than perfect performance is achieved at any point except right in the middle, where compliance with the demands of time, costs, and norms of quality is granted. Because the system is closed (limited time line, maximum costs allowance, preset norms of quality), what goes wrong within it cannot readily escape outside of its frame and is obligatorily self-contained, which allows the problems to compound quickly and to cause havoc.
Victor Hugo (2001), who is well known as the author of Les Misérables and The Hunchback of Notre Dame, provides an eloquent description of chaos in his book Quatrevingt treize (“Ninety-three”). The scene takes place aboard a warship in the nineteenth century. Inside the ship, cannons are aligned to face the enemy. Cannons are normally fixed solidly to the floor with a series of lock mechanisms designed to resist the impact of firing the bullets. However, the crew responsible for securing the cannons has failed to do so with one particular cannon. As a result, in a sea that is agitated by powerful waves, the cannon rolls loose on the ship, punching holes in its various walls, crushing crew members who happen to be in its way as it waltzes without apparent direction. This is truly a “loose cannon”. Hugo writes13:
“You cannot kill it, it is dead by nature. Yet, it has a life of its own. It has a sinister life that is injected into it from infinity. The floor, moved by dreadful waves and hellacious winds, is causing it to bounce around and lurch without coherence.”
Questions are posed: “Is this the toy of a terrible tragedy? How to stop this monster from causing a shipwreck? How to predict its next move?” Observations are made: “It almost seems like it has ideas and plans of its own, which keep changing. It fights its own movement, moves forward, backward, hits to the right, hits to the left; it escapes, beats the crew’s anticipations, waits, and destroys.” Impacts are laid out: “The vessel’s guts are held captive by an ongoing thunder.... Apocalypse is all around and all within, with no means of putting an end to it.”
This powerful image illustrates how a team can become a miasma of people not doing their job right. Things start to fall outside the plan set for work tasks, costs, and norms of quality. It really portrays what an Unfit pushed to the extreme can do to a project, especially when the plan has gone awry. Of note, Unfits can exist among management as well: project managers too busy navel-gazing don’t get the job done or else antagonize their workforce.
Projects that deliver on time, within budget, and that have risen to the quality challenges are not the majority, as we know. My vision of a project links the four Ps to the triple constraints14; if we were not to do this, we would assume that costs, for example, are independent of what People (e.g., the team members) do, which would be turning a blind eye on the reality. In a closed dynamic system, POVs are prompt to inflate—the Bermuda Triangle lives up to its reputation! Hugo’s description is a vivid expression of what happens when there are no exits.
The project is indeed walled off by the triple constraints. There cannot be a project without each one of its elements being present: calendar, costs, and norms of quality. This kind of dilemma exists in chess. According to Kasparov (2006), former world champion, there are three things to evaluate in order to win: (1) time (games are timed by a clock), (2) position (the strategic position of pieces on the check board), and (3) material (the number and quality of the pieces, with pieces being valued differently and acquiring different values depending on their position). A player may have a winning position, but if he’s got only one second left on his time allowance, he’ll lose on time. If he takes too much time to cogitate about his next move, he’ll end up panicking and sacrificing his strategic advantage, as he’ll run out of time later in the game. If he plays a foolish move, he’ll have to spend time considering how to redeem his player’s sin. He may sacrifice a piece in order to gain a positional advantage. The entire game is built around one key behavioral concept: targeting the opponent’s vulnerability, finding a POV in the opponent’s game, to act swiftly in due time in order to defeat him.
The same dynamic takes place in project management: time, costs, and norms of quality act as time, position, and material in chess, and these three axes of interest can initiate or activate POVs. Chess world champions master the art and science of conciliating time, material, and position while capitalizing on their opponent’s vulnerability. Great managers handle the triple constraints by minimizing the emergence of POVs. While a prefeasibility study is not overly concerned with the triple constraints, it is an essential component of any feasibility study.
Note that even if a project has escaped the dangers of the Bermuda Triangle, this does not guarantee a commercial feat: the high-speed train linking Shanghai to the city’s airport is a painful example.15 It has so far proved to be a great technical achievement, but a disastrous commercial venture.
The Montréal Olympic Stadium (MOS) had its own challenges with respect to the triple constraints. Table 3.2 points to the extent of the problem that the City of Montréal faced in 1976.
Triple constraints | Comment | Criteria met or not? |
|---|---|---|
Calendar | Started: April 28, 1973 | ? |
| Completed: 1987 |
|
Costs | Initially: C$134 MM | ? |
| At the end: C$1.61 Bil. | ? |
Norms of quality | Uncompleted roof | ? |
Success or not? | Hmmm! Debatable. |
|
Recall that we assumed that a project is represented by an ascending linear curve with a slope of 1 (+1) and that anything that bends this curve is related to walls, ceilings, and floors. By looking at the shape of a curve, the feasibility expert is able to determine which of the axes of the triple constraints is implicated in the development of the project. As an example, we have seen a sample curve in Figure 2.6. Evidently, there is a ceiling that prevents that curve from adopting a linear ascending shape; ceilings are associated with costs. Hence, the main concern may have initially been to maintain costs under control. However, as the project got closer to its end wall, this wall gained in importance: the situation became more critical. This is expressed by the sudden rise of the curve: the project had no concern with costs at that point, but merely only with time—it was a wall that moved the curve upward. Table 3.3 shows the analytical process we just went through.
 |  |
I believe that this way of analyzing a project adds value to the notion of the triple constraints that is a core element of any book on project management. It allows the feasibility analyst to focus on which constraint is most active at any particular stage of the project, providing he knows, at least roughly, what the growth curve looks like for that project.16 Pervasive POVs have a tendency to throw the project outside the “football” formed by the three constraints, into an area that I call “chaos” and that we will, as mentioned, analyze further in Chapter 7.
While the prefeasibility study examines mostly Plans, and partly Processes and Power, the feasibility study takes a hard look at all four Ps; however, the attention centers on their interaction in the transformation phase. Additionally, the four Ps as they interact during this transformation phase are bounded by the triple constraints.
Let’s continue to detail our working model as shown in Figure 3.3.17

To indicate that “transformation” is in this case an action and not an object or a concept, we underline the word. I stands for “influence”: for example, Power has an influence on the transformation phase, which is obvious (here, the influence is assumed to be positive (I+)). This way of modeling has the advantage of simplifying the entire process to make it easier to understand (in particular as more and more process elements are brought into the model).
Normally, the influence should be positive so that (I) should really read (I+), but in fact, the influence may be negative (I−), especially when the process is beleaguered by POVs activated by the presence of risks. Note also that (People) is composed of two process elements: “Fits” (Forces of Production under control, FPc) and “Unfits” (uncontrolled Forces of Production, FPnc). In the previous example, we assume that these two sub-elements are measured using a binary scale (present/not present). Finally, note that Processes are structurally composed of Resources and Means of Production. Resources include energy,18 infrastructures, materials, and money. Means of Production include building, equipment, machinery, and measuring instruments. This is illustrated in Figure 3.4.

It can be observed that the transformation phase promotes the recourse to resources by Forces of Production (FP) using Means of Production (MP) anchored in a predetermined plan and as directed by some line of authority. Of course, this entire process is bound by a beginning wall (start date) and an end wall (completion date), a ceiling (costs), and a floor (norms of quality). We will see when we discuss Processes how, in particular, resources, management and team members (Forces of Production), and Means of Production interact.19
We need to review each of the three constraints individually. Before we do this, however, we shall examine the PRO (Pessimistic–Realistic–Optimistic) tool and introduce a new concept: the POW, (Product–Organization–Work breakdown structure), because both tools come in handy when analyzing POVs.
3.4 The PRO system
In the general introduction, we have seen how important it is to examine everything that can go wrong with a project if we are to uncover POVs. The example of the oil filter was given.
In the PMBOK20 and other similar texts, three scenarios are proposed:
Pessimistic (P). Managers are preparing for the worst while having the heart to finish the project.
Realistic (R). Managers regard the project in terms of available resources and the realistic possibilities of problematic occurrences, such as interruptions.
Optimistic (O). Managers decide on the project duration in the best of scenarios, virtually ignoring any possible hurdles (a little bit like saying “Yes, I do” when exchanging vows at a wedding!).
The PERT (program evaluation and review technique) method as well as PMBOK proposes an expected cost (EC) measurement using a weighted average of these three estimates,21 as follows:
Where EFC stands for “expected final costs.”
This measure is very subjective, as is a large part of the prefeasibility analysis. There is nothing wrong with that; what I wish to do here is to offer some guidelines that may help identify POVs, even if some judgmental effort is encouraged. Because we are seeking to identify POVs, we are not merely concerned with optimistic scenarios; we are more attracted by everything that can go wrong. However, given what we have said in the previous chapters, that is, that POVs account for approximately 4% of any project (delays, cost overruns, and quality issues), it may be worth reconsidering Equation 3.1. In this equation, the pessimistic scenario accounts for one-sixth or 17% of the project [(P + 4R + O)/6]. As chief project directors, we would be quite upset if a project manager were to come to us and tell us “I can work on this project, but I need a 17% leeway on calendars, costs, or norms of quality.” In other words, let’s suppose the cost of building your house is US$60,000; the constructor would try to sell it to you by stating that some US$10,000 may be lost in the process. You would certainly think that the builder has not done or will not do his job right or that he is not capable of doing his job, and you would be convinced that the project would suffer sooner rather than later. So, from the point of view of a project feasibility analysis, I somewhat object to Equation 3.1 for which I have found no convincing proofs. In the introductory chapter, we saw that approximately 30% of projects fully succeed; yet, that doesn’t mean that 70% of projects are failures—some turn into nightmares or white elephants, true, but not all. It simply states that approximately 30% respect their initial plan in full. The QMA is one example of such an achievement.
In essence, I propose to replace the weights suggested in Equation 3.1 as follows—estimating that about 70% of projects are, if not completely successful, at least successful in some measure despite some shortcomings:*
This seems to make intuitive sense from a managerial point of view. If we were investors in a given project, we’d like to see the project’s promoter admit that there is a slim chance that things could go wrong (4%–5%), that he has done all he could to guarantee that the project will develop as planned, but that there is even a chance that it may go better than planned, although this chance is not as strong as the one expressing how things are realistically expected to happen. Accordingly, we’d say that the manager is seeing reality with common sense and we’d be interested in investing. An overly optimistic forecast would raise some flags: perhaps, the promoters are ignoring some POVs? My proposed formula is a far cry from the one proposed in PMBOK and various such books; however, I do not believe any manager would like to work with a set of circumstances where things can go wrong 17% of the time. This can only be true if POVs have not been addressed from the start. Since the current success rate of projects is estimated at 30%, this means that there is theoretically room for improvement by way of tackling POVs, by more than twofold. The reader will have guessed it: I are trying to make the assessment of scenarios more in line with common sense and to highlight the importance of dealing with POVs. This is shown in Figure 3.5.

Viewed from this angle, Equation 3.2 seems to correspond to a normal situation, even if some readers may question the logic that I adopted to arrive at it. I would venture to say that Equation 3.1 should be parsimoniously used because it underscores some poor management practices and because it does not seem to reflect a normal situation, which would be expected in any project undertaking. To the right of the mean, we could postulate that projects were lacking Key Success Factors (KSF) (strengths and opportunities), and more and more so as the variance escalates (e.g., there were no or few negative forces but the management team just wasn’t performing enough); to the left, we could assume that projects failed more and more as the negative variances inflated because they were under the influence of Key Failure Factors (KFF) (e.g., there were dreadful combinations of poor planning and Unfits—uncontrolled Forces of Production). KFF include risks and vulnerabilities. That’s one way of looking at the expected final costs; from a managerial point of view, it seems to make sense. It says that a manager should face risks and reduce vulnerabilities appropriately, and build on strengths while answering adequately to opportunities; by doing so, a manager builds a strong realistic scenario for the project. He is robust.
3.5 The POW system
The fact that a promoter cannot measure his endeavor or else that he doesn’t care enough about finding ways to assess them other than financially or operationally is a strong warning sign that POVs will bloom. A project is a human effort. Discounting this is falling for a dream scenario when in fact the opposite is likely to happen. There is no better control on quality than by preparing for the worst, and quality is something we aim for in a project. Recall that the prefeasibility study has a look at the parameters and at KSF; in a feasibility study, we review them within the context of the process “transformation-deliverable” to determine if the project promises still hold true. To do this, a number of documents are necessary. They help in sharing the vision of the project, they are22 the following:
The project charter, which authorizes the project formally.
The statement of the project’s content, which describes the tasks (part of the transformation stage in our model) and the project deliverables (part of the output stage in our model).
The project management plan, which explains how the work will be performed, and more particularly, how the preparation, integration, coordination, and control of each of the project’s steps will be conducted.
A promoter should be able to provide the necessary information, including a budget, a list of work tasks, a plan for the management of anticipated resources, estimates of total work, the anticipated schedule, the expected deliverables, as well as his take on KPIs (Key Performance Indicators) and KSF23 (Key Success Fundamentals). From this, the analyst can outline the Dominant and Contingency Strategies (DS, CS).
Using terminology commonly found in project management, we could roughly group these elements into three sections,24 which I refer to as POW (Table 3.4). The POW concept is simple: an organization (O) works (W) to produce a deliverable (or else, a product is made by an organization by means of work—P for “product”):

Product Breakdown Structure (PBS), which includes resources as inputs (Processes), hence the importance of clearly defining the deliverables from the start.25
Organization Breakdown Structure (OBS), which relates in particular to talent within the organizational structure as well as the delegation of Power (authority/line of command).
Work Breakdown Structure (WBS), which examines tasks jointly with responsibilities.
I propose the core minimal efforts related to the POW concept as indicated in Table 3.4.26
A project promoter that is unable or unwilling to provide a POW structure is probably not serious about the project; it would be unwise to pursue with the feasibility study.
As can be seen, the POW concept gives the analyst a closer look at the project, with an emphasis on its processes, and more particularly, on the transformation–deliverable axis. With the POW concept, one answers the questions: “What is going to be achieved? How are the achievements going to be measured? When? At what costs?” Often, POVs develop because there are no measurements; this prevents the manager from doing the follow-up on, say, tasks, so that he cannot judge the progress being made. Additionally, if an employee is not evaluated on the quality of his work, what will he care? Soon enough, he’ll let his eagerness to achieve high standards fade away and will become sloppier. This is human nature, at least for many people. The POW concept provides a very succinct means of saying: “What is to be done can be done (what is promised is what you’ll get).”
Let us take the oil container as an example. The promoters can probably very easily come up with a list and flow of tasks, with promises of deliverables and time for completion. The real question is: “Given the optimistic scenarios they provide, what measurements of performance and success can be used?” A feasibility analyst would challenge the promoters and find out that there are few realistic answers to these two questions. The same logic applies to the Mervel Farm project: as soon as performance indicators and KSF are demanded from the promoters with respect to the transformation phase (turning the abandoned farm into a tourist venue), the project seems less realizable, sad as it is for them.
3.6 PRO-POW
The PRO system can be merged with the POW analysis, as shown in Figure 3.6.

I refer to this as the PRO-POW system, which is the heart of a feasibility analysis,27 and which I will expand on even further as we go. Everything that cannot be managed within this framework falls into the area of disasters (chaos), because constraints (time, costs, and norms of quality) will affect the scenarios (PRO) and at least one element of products, organization, and work (POW). Put simply, the analyst looks at the organization that works to produce the deliverable through the lenses of the three scenarios: realistic, optimistic, and especially pessimistic. The analyst would rightfully pose the question: “Given the most pessimistic scenario, for example, what would happen to the Mervel Farm project in terms of deliverables, organization, and tasks?” In fact, he could refine his investigation even further in very practical terms: “Given the most pessimistic scenario, that is, given that time, costs, and norms of quality go awry, what will be the exact consequences on Mervel Farm’s deliverables, organization, and tasks?” An answer could be: “The Mervel Farm project will have to be put off for one year, its promoters will have to request an emergency fund of C$35,000, then the project would see two of its leaders quit, the one manager left would have to revise tasks and activity flows, and to reduce the offer to a more manageable level.” Any change in the POW structure is likely to influence the calendar (time), costs, and norms of quality (with the four Ps being mandatorily involved); these changes, in turn, will affect the POW. Daily project operations that take place within the confines of the constraints are likely to produce a successful project, yet any changes to the constraints are likely to affect the daily operations. This is truly a complex dynamic system.
Let’s now turn our attention to each one of the three constraints.
3.7 Calendar
Terminology used in project management refers to a “calendar” but in fact, it really is a calendar of tasks and activities that matters during the transformation phase.
In general, the calendar is initially the simplest of the three constraints to assess. Cost analyses, marketing research, and technical evaluation that lead to the establishment of norms of quality require time, money, and effort. Examining similar past projects, even roughly, can assist in determining a realistic schedule.
The PMBOK guide divides the calendar into five stages, one adding up on top of the previous ones over time, which I label as (1) “vision”, (2) “planning”, (3) “mobilization”, (4) “deployment”, and (5) “completion and evaluation”.
The vision stage includes the creation of the project charter, the project scope statement, and the project management plan.
Some authors resort to the notion of “prephase” also sometimes called “incubation”; this is when the prefeasibility study takes place.
I encompass incubation within the vision stage. At this point, there is no substantial commitment toward the project, as opposed to the planning stage, when inputs are beginning to enter into the transformation chain, which will eventually generate outputs.

Let’s replace the term “execution” commonly used in many project management models, with the term “mobilization” because it describes best the fact that passive elements (e.g., material resources, MP) and active elements (e.g., Fits, FPc) are fed as inputs into the transformation chain. I also add the term “evaluation” in the final stage (compared with most project management models, which omit this important step) because a project must by all means be evaluated at the end, if it were only to produce the Book of Knowledge associated with it, or else, some form of it.
The five stages28 that form a project’s life cycle are captured in Figure 3.7.
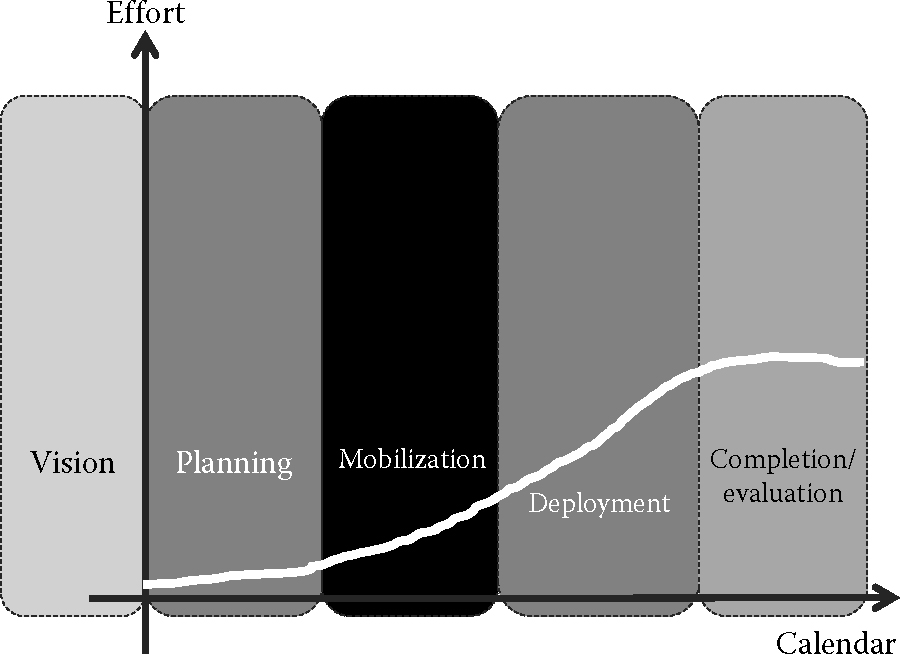
We can also illustrate this according to our modeling method, shown in Figure 3.8.

In Figure 3.8, the shape of the curve [effort = f (time)] (found in the PMBOK among other sources) contains a floor during the vision stage (when norms of quality are set) and two ceilings (when costs are imposing their weight onto the project); one during the planning stage and one at the beginning of the completion stage. The first ceiling (there is a ceiling when the curve is not a straight ascending curve) indicates that there is something preventing the growth of the project along a linear ascending curve with a slope of 1: indeed, this means that all the resources (more generally, the four Ps) are not yet in place and not ready to move into the transformation phase. Because it is a ceiling, this is intimately linked to costs. Assessed differently, the first ceiling means that the money needed to engage the inputs (e.g., resources, FPc) has not been released yet or else is not available yet.
At the planning stage, POVs are theoretical in nature; they are not active yet. They come to life once the curve adopts the linear ascending shape all the way up, theoretically, to the next ceiling. The second ceiling is an indication that the project has reached its maturity or, technically speaking, the maximum involvement of the four Ps. Because this is a ceiling, it is, again, intimately related to costs. This means that the project has neared its total budget; if it were not the case, some sacrifices would have to be made, most likely in terms of quality.
Note that this curve cannot possibly represent the Total Costs (as some project management models erroneously claim), because it has a descending shape at the end; rather, it represents the efforts needed to run each stage of the project.
Hence, from a calendar’s point of view, POVs represent a source of clear and present danger during the stages of mobilization and deployment. This is when they are most invigorated. Of course, projects often have substages so that there are various project cycles within the entire project. In addition, some POVs are sometimes discovered after the project is completed—when part of a building collapses, for example. Identifying POVs requires the unfolding of each stage (vision, planning, mobilization, deployment, and completion/evaluation) under a pessimistic scenario. A good way to start is to review the list of tasks (the W in WBS). The vision stage, for example, can be subdivided as follows: the evaluation of the concept, identification of the prerequisites, design, and validation from potential clients and project investors. Market validation is a crucial marketing effort because projects must respond to an opportunity. Let us take the example of the Stradivarius musical concert as per Table 3.5.
Stage | Start date event | End date event | Number of days |
|---|---|---|---|
Vision/Planning |
|
|
|
Mobilization | First meeting with musicians |
|
|
Deployment | First concert |
|
|
Completion and |
|
|
|
The feasibility analyst and the manager on site (during the actual implementation of the project) will speculate about what could go wrong as the concert event approaches. The analyst might ask: “Given what could go wrong, how realistic is the time line for the concert?”
Let us move tangentially to consider the story of Moby-Dick.29 The captain has set up a shrouded agenda to go chase a white whale that has amputated his leg in a previous encounter. The ship must be prepared for the journey: a Plan is set as to where the ship will sail and what material and human resources must be on board. Processes are established: undocking the vessel, sailing, and surveying the sea. Team members (Forces of Production), such as the cooks and the harpooners, are put to work. The agenda has changed by an effect of surprise, from chasing whales for their oil to exacting revenge on a particular whale: Moby-Dick. All four Ps are in place to do what they are supposed to do, but in the end everything goes awry because there was a secret plan, which by itself was a POV driving the mission to catastrophe (the captain was the Unfit in this case). The initial question related to the project would have been: “Given that the captain is nowhere to be seen during preparation and departure, what could go wrong?” Most certainly, something related to the captain.
When it comes to time, there are two kinds of flows to be cognizant of: relative and absolute, or, put differently, conditional and unconditional. Technically speaking, the conditional one is a cause-and-effect relationship, whereas the unconditional one is purely based on the passage of time. The difference is fundamental, but seldom understood by some practitioners. The relative time is the path that is designed for the project (the full transformation chain), and that can become critical as the concert date gets closer—it is created by humans by way of calendars of tasks and activities; the absolute time is simply the normal passage of time as set by nature; it has a steady pace as opposed to relative time, the pace of which can change depending on circumstances.30 In the case of the QMA, for example, the pouring of the concrete for the foundation was postponed by roughly one month because of poor weather: absolute time kept ticking while relative time had to adapt. Einstein would inarguably agree!

The feasibility analyst ensures that tasks and activities deemed essential to the project at each of the five stages are recognized. He must verify that the units of measurement (e.g., currency, day, hour, and quality metrics) are identified and precise. He explores the types of links that bind tasks together. This will give him a good view of the project.
By making a succinct list of tasks/activities included in each of the five stages of the project and deciding on their types of links, the analyst will be able to identify the most vulnerable points. Causal links can lead to the most dramatic negative impact on a project; however, as the project travels along its critical path and nears its end, the time factor becomes more and more acute. Finally, under certain circumstances—such as the dramatic gush of the price of steel during construction of the Montréal Olympic Stadium, MOS—some process elements may have a tremendous influence on the project. Generally speaking, influence process elements (those having an influence on the project) are more critical during the mobilization stage, causal process elements (those exerting a cause-and-effect pressure on the project) during the implementation stage of the project, and the longitudinal process elements (those strictly time related) toward the end of the project as it approaches its deadline. The definition of the project contains POVs at the planning stage.31 We can illustrate this as shown in Figure 3.9.

POVs are thus temporally spaced along the calendar of tasks and activities. This observation may provide an additional clue that the analyst can use in his effort to uncover them. POVs’ prevalence is related to proper Description during the planning stage32, their Influence during mobilization, their level of Causality during implementation, and their Timeliness during the completion of the project. In conclusion, the mobilization and implementation stages33 are when the POVs are theoretically most potent.
From these observations, I draw the second law of project feasibility:
3.7.1 Second law of project feasibility: Dependencies
The stronger the dependencies between the project’s tasks, the more vulnerable the project is. High task interdependence generates high potential vulnerability.
Here, dependencies refer to the critical nature of the bond between process elements. From this perspective, a project is theoretically most vulnerable during the implementation stage. At this stage, there is a potential for all POVs past and present (whether they relate to Description, Influence, Causality, or Time) to become active. The Challenger shuttle explosion on January 28, 1986, which happened 73 s after takeoff, while it was traveling at a very high speed, provides a painful example. Seven crew members perished. The catastrophe was eventually traced back to a ruptured O-ring on one of the rocket boosters attached to the main tank of hydrogen, which is, of course, a highly explosive source of energy. The lives of seven astronauts were partly dependent on a simple O-ring, the cost of which was altogether minimal compared with the total cost of the shuttle and mission: there was a very high POV at that particular joint between the tank and the shuttle. Most POVs regretfully act up during the implementation stage.
The second law of feasibility must be acknowledged when making the final assessment of a project’s feasibility.
3.8 Costs
When doing a feasibility study, all costs are de facto estimates. There is little room here to be optimistic and in fact, the best strategy is to rely on a pessimistic scenario. Costs are to be spread along the five stages of the project’s life cycle. Seventy-five percent of estimated costs are usually set in the vision stage, but only 5% are actually incurred at that time.
Table 3.6 offers an example of real costs, according to each stage.

Most project management books34 illustrate the major project stages’ costs as shown in Figure 3.10.
A number of observations can be made with respect to the cost structures shown in Figure 3.10. First, the more time elapses, the more expensive the changes are; secondly, the savings seem to reach a floor toward the end of the life cycle; thirdly, the situation becomes increasingly critical,35 starting from the point where the savings curve meets the cost of the change curve, midway in the mobilization stage; and fourthly, the cost of changes forms a near straight linear ascending curve during the mobilization–deployment stages. For this reason, the assumption I initially set that all projects follow a straight linear ascending evolutionary curve is associated with the relative cost of changes. The relative cost of changes is the cost of changes relative to the budget that has been expended so far during the project. At the beginning, a change, say in the planning, may not represent a high cost per se, but in comparison to all the costs incurred at that time, it may actually be small. The relative and punctual curves of the cost of changes are indicated in Figure 3.11.


Thus, the fundamental basis for the feasibility analyst, that is, the assumption that all projects are deployed along an ascending linear curve with a slope of 1, actually rests on the observation that the relative cost of changes evolves in a quasi-ascending linear curve. At least, that’s my working hypothesis. Looking at a project, from a feasibility point of view, is looking at the cost of changes. This makes sense: a project is fundamentally a change process.
3.9 Norms of quality
We have already defined perceived quality as being [Perceived quality = (Functionality + Design)/Costs]. We have seen that Functionality and Design can be linked to Short strategies, which are strategies that need to be implemented when everything else (Dominant and Contingency strategies) fails; this requires imaginative solutions, that is, some level of innovation.
Judging from this perspective, norms of quality and costs are interconnected. The establishment of norms of quality as constraints is related to technical expertise. At the core of projects, indeed, lays a technical challenge, as seen when we defined the characteristics of projects. The three elements of the triple constraints are not independent from each other, but are, rather, inextricably linked, with each one taking on a unique role. The four Ps play a critical role in the triple constraints. Let us take the example of People: the quality of people employed in a project is equal to their capacity to be functional, to abide by the design of their tasks, as reduced by the costs to employ them, given the time line set for them to complete their tasks. The final value of a project can be seen as the quality achieved over costs, given the time allotted to complete it.
This makes intuitive sense to a project manager. A proper organization, the delivery of quality deliverables and well-structured tasks seem to be ideal conditions for the achievement of the project, which is itself a function of the four Ps. The reverse, however, may not be true. Aiming for quality of the four Ps may not translate into quality in terms of the POW concept for a single reason: the presence of POVs. It may happen, for example, that a project respects the high standards of the four Ps’ qualities, but this was achieved only because POVs were not triggered by external risks, which would have together adulterated the quality of the POW structure. Hence, the active presence of POVs is what determines if a project will succeed. From this perspective, a feasibility analysis should look at the POW elements and the POVs altogether, because POVs can compromise the products, the organization, or the work (POW). No matter how hard people work, for example, it will not affect the POW elements until that work focuses on solving issues caused by POVs.
3.10 Summative triangle
Glancing at the big picture is just as important as screening the details. The devil hides in the details, for sure, but missing the forest because the analyst is too close to the trees may lead him down the wrong path. One way of expressing the big picture is to use the summative triangle, which merges the three axes of the triple constraints with the five stages of the project’s life cycle, as shown in Figure 3.12.

This summative “triangle” makes sense when units of measurement are specified, as in Figure 3.13.

It is most advisable for the feasibility analyst to compare the project with similar projects that have already been completed, using the summative triangle if possible. Figuratively, this tool can then be combined with the PRO-POW strategic framework as in Figure 3.14.

Timing, cost structure, and norms of quality (with their relationship to the four Ps) are evaluated in parallel to the three scenarios (pessimistic, realistic, and optimistic). This simple method gives the analyst an overview of the project in order to rapidly capture its quintessence.
I also encourage the analyst to prepare a spreadsheet that can transfer the summative triangle into a tabular format (Table 3.7).
The analyst would review this table, of course, and try to pinpoint where POVs would likely find a niche.

3.11 Conclusion to Chapter 3
Projects must be imperatively be defined with precision. Many authors have noted that one of the major causes of project failure is an inadequate project formulation right from inception. A project is formed of the four Ps (the four structural variables) and is expressed by at least two of the three functional variables that are deliverables and/or documentation and/or impacts. Large projects always include these three forms of outputs. A project proposal that does not recognize the role of the four Ps and that does not identify the outputs is not well defined; most likely, unpleasant surprises loom. Structuring a project carefully is indeed part of the four Ps, with respect to Plans. The preliminary stages of a project will influence the entire course of the project.
Projects exist within a contextual framework of risks. We have related risks to vulnerability, a concept that is at the core of the present book. We closely associate risks with calendars, because risks are outside forces that affect more directly a calendar of tasks and activities. The QMA is an excellent example: there was an environmental risk in laying out the foundation of the amphitheater during winter; indeed, the project was stalled several weeks due to tough winter conditions. We have linked POVs with cost control management (and we will see that norms of quality are closely associated with an error term ɛ).

We have also found a mathematical link between calendars, costs, and norms of quality. Setting measurements are crucial to the analyst, and eventually to the project manager; I have offered various tools that, based on my experience, may have some utility. A feasibility analysis template is offered in Appendix 3.1.
In his 30-year search for Tutankhamen’s tomb, Howard Carter did not get discouraged by his arch rivals or the lack of results over the years. It is by digging outside the established search area that the clues to the location of the tomb were discovered. It was by pursuing the clues (a stone staircase going deep into the ground) that at last a treasure was found in 1922, which captured humankind’s imagination. It is possible, after all, that doing a proper feasibility study may lead to some opportunities to enhance the project beyond its initial expectations.
A useful tip is to begin an analysis by listing all the major tasks and activities of the project, and spreading them along the five stages of the project life cycle. The dissection of each major activity thereafter and the allocation of responsibilities to the four Ps in a detailed way by taking into account the types of links between the various processes, is a mandatory effort, albeit daunting at times. The goal is to shed light on the project from every possible angle.
3.12 What we have learned about POVs: Chapter 3
POVs…
Affect the costs more directly.
Are minimized by great managers to better handle the triple constraints.
Have a tendency to throw the project outside the “football” formed by the three constraints, into an area that we call “chaos”.
Are actuated by the presence of risks.
Can be uncovered by examining everything that can go wrong (PRO system).
Are highlighted by the fact that a promoter cannot measure his endeavor or else that he doesn’t care enough about finding ways to measure them other than financially or operationally.
Develop because there are no measurements/metrics.
Are theoretical in nature at the planning stage.
Start being active once the [effort | time] curve adopts the linear ascending shape.
Represent a source of clear and present danger during the stages of mobilization and deployment.
Are sometimes discovered after the project is completed.
Are temporally spaced along the calendar of tasks.
Are related to proper Description during the planning stage, their Influence during mobilization, their level of Causality during implementation, and their Timeliness during the completion of the project.
Can compromise the products, the organization, and/or the work (POW).
Are closely associated with cost control management.
3.13 Key managerial considerations: Chapter 3
Define the products, organization, and work to be done with attention to detail.
Laser focus on what can go wrong in search of POVs.
Face risks and reduce vulnerabilities appropriately, and build on strengths while answering adequately to opportunities.
Use both a detailed and global picture approach.
Evaluate the transformation stages in terms of a calendar of tasks and activities, costs, and norms of quality.
Actively search for causal links between tasks.
Use the summative triangle to express the concept in a simple format that everyone can embrace.
3.14 Case study Chapter 3: AF Thériault and the Hammerhead military target boats
3.14.1 Introduction
It is by a mere coincidental flow of events that the Hammerhead project came about. AF Thériault (AFT),36 a manufacturer of boats of all kinds located along the Evangeline Trail in the Acadian part of Northwest Nova Scotia (Canada), had a crew of workers at a trade show when discussions commenced with Meggitt Training System Canada,37 a military equipment provider well versed in the simulation of law enforcement and military training. The trail is named after an epic story of a young and melancholic woman who falls in love but who, much to her dismay, sees her dreams shattered by the British deportation of the French-speaking families to Louisiana, during the second half of the eighteenth century. Most families have eventually returned to what they called home, which is for the most part stretches of land bordering the Bay of Fundy where seemingly eternal winds have trees whistling night and day, and where the tides are the highest in the world.
It became obvious to the parties involved that AFT was well suited to build target boats that could be used by the navy during its practice mocking the swarming strategy employed by terrorists and thieves along the coast of Somalia, the Straight of Malacca, and the Persian Gulf to cite only these vulnerable areas. The idea of a target boat made available for training against such events was a direct consequence of the U.S. Cole incident, which demonstrated to everyone the need for improved protection against small predatory boats. One of the prime customers envisioned to buy the products and services sold by Meggitt were United Nations–friendly countries.
The swarming strategy implies the use of small and fast boats that act in a cohesive manner to attack larger, isolated boats, be they commercial, military, or with a tourist vocation. The name “swarming” comes from the way bees form tight yet highly effective groups with various functions aimed at confusing and attacking the enemy.
3.14.2 A short history
AFT was founded by the current general manager’s grandfather, Auguste (Gus) Thériault, in 1938. Vintage photos are selectively stored in the main administrative building on an AFT site, a 10-acre site that comprises a total of 23 buildings, ranging from the storage of advanced composites, cabinets, hydraulic units, paint and spray containers, pipe fitting materials, and propeller machines. There are also hull maintenance and manufacturing shops, where some 175 employees work. Sandblasting, installation, painting, replacing or repairing parts, and finishing are all daily activities. A number of types of boats are built at AFT, including fishing boats, ferries, Marine Corps boats, work boats, and yachts. Table Case 3.A provides pictures of some of the boats.38
Throughout the decades, AFT has built nearly a thousand boats of all sorts, sizes, and uses, and has won numerous prizes and achievement awards. Boat building and repair includes work on aluminum, composites, fiberglass, steel, and wood. The maximum boat length is 130 feet (39.6 m).
3.14.3 Hammerhead project
The Hammerhead project developed as Meggitt and AFT realized they could work together to produce a high-speed, autonomous (unmanned) target boats that could be shot during military practice. The life span of a Hammerhead is short yet the boat is instrumental in the training of highly specialized Marine Corps.
Table Case 3.A Some of the boats built by AFT over the years

More specifically, the goal was to build a boat 17 feet long and about 4 feet 3 inches wide, capable of reaching a speed of 30 knots in sea state condition 3 (according to the Beaufort scale) at a maximum cost of C$60,000 (as of the year 2006). The boat would be unmanned, made of solid material, yet its design would not be overly sophisticated, as it would serve as a direct target as opposed to being capable of complex evasive capabilities. Tolerances for the construction were set at ±1/15th of an inch (or ±2 mm) in large part because it was equipped with a set of electronic components given that it was to be unmanned and GPS-driven. No lead would be utilized as this would cause an environmental hazard given that the boat would be shot and would sink into the sea—instead, an iron pig covered with fiberglass was elected where weights had to be installed to compensate for the lack of crew on board. Additionally, the boat was to have a single lifting point so it could be easily moved from one location to the next with an articulating mechanical arm (crane). The initial budget for the project was modest. A timeline for completion was set at 6 months.
Initially, the project had four key stakeholders: AFT, Meggitt, the Canadian Navy, and Mercury Marine Canada (not related to the car industry). It faced a number of challenges. The risk of failure stemmed from the fact that such an unmanned vessel had never been built by AFT. In addition, given that the boat would eventually be shot during military training, a well-executed trade-off had to be reached between the cost and quality of materials and the structural integrity. In short, there was no need to overbuild; the vessel just had to be sufficiently good.
The prototype took four years in the making. Although building boats was the expertise of AFT, several factors had to be examined and tested. Various forces affect such a vessel, which, being unmanned, must be remotely controlled: currents, gravity, the type of water (salt or fresh), waves, and wind. These exert a tremendous pressure onto the hull when the boat travels at speeds of up to 30 knots/h. A special design had to be developed in order to maximize the kinetic energy under the hull in an attempt to achieve a balance between aerodynamics and propulsion. Special (secret) features had to be incorporated into the paint, the shape of the hull had to be carefully drafted, and various weights of up to 100 lbs had to be inserted into the boat to mimic the presence of a crew on board. The Hammerhead hardly capsizes; it can turn at sharp angles without losing its balance and seems, at high speed, to float on a carpet of thin air above the water level.
Over the years, some 346 Hammerheads have been built, with an average annual output of 30. The first year saw the production of three Hammerheads only.
These are boats that can actually save lives, according to AFT. The navy perfects its shooting skills against terrorists at sea; this potentially prevents devastating attacks on civilian and navy targets. As mentioned, such attacks have been made famous in the case of the U.S. Cole in 2000, which killed 17 U.S. crew members.
The design of the boat was done by the project leader, David Saulnier, and a colleague, who both played an instrumental role in the development of the boat over the years. Seven of David’s staff eventually joined forces in building the prototype, literally starting from scratch. The very first boat was the only one ever built that would be piloted. It was first tested on a local lake, and then reworked to be tested, unmanned, on the sea. David attributes the success of the Hammerhead boat to the hard work and dedication of his team; everyone has been committed and can build a Hammerhead inside out. As of today, some 10 years later, it takes 8 people (not including David) and 5 days to build the boat; reaching the point of autonomy39 took 5 years in the making, given the numerous changes that were made and requested by the project partners. A manual has been prepared both at Meggitt and AFT that gives the specifications for the Hammerhead components, and a Work Breakdown Structure (WBS) has actually been completed.
3.14.4 What makes an efficient team
David, the project leader, knew well in advance what would make the project successful in terms of the use of authority and power, and in terms of team cohesiveness. “I use a horizontal approach with my staff,” comments David. “Status (read: egos) is a work atmosphere killer.” Indeed, the mere location of the plant is conducive to such a work culture (psychodynamics): the community of about 9000 people, mostly French-speaking, isolated in a province that has nearly a million people, who mostly speak English, has fostered a close-knit network whereby everyone knows each other and has known their neighbors since childhood. David Saulnier says
“My staff trusts me because I am easy to connect with; I am not saying easy to deal with – there is a difference. I am the boss, but my approach is convivial. I never hesitate to congratulate my staff for their dedication and hard work. Each boat is scrupulously crafted much like a piece of art. We take a lot of pride in the Hammerhead series. This is something we have developed from scratch.”
Communication is by e-mail and telephone with outside partners (such as Meggitt and Mercury) with occasional person-to-person interactions, but within AFT, most of the communication is verbal. Pride resonates among the team members; indeed, it is the glue that unites the various trades, from fiberglass applicators to painters. David Saulnier adds
“I like to have a warm relationship with my workers. I give them time. I do not use a top down approach. Rather, I am interested in what they can teach me. We realize that we are each a member of a team and that there are no cat and mouse games – I am not scrutinizing them and looking over their shoulders to verify their work. Overall, the trick is to champion a positive atmosphere.”
David’s approach to project management is, surprisingly enough, based on loss control management. When he planned the project, he took a deep look into areas where losses could occur; vulnerabilities indeed entail costs that eventually plague a project. One of the worst enemies of a team effort, he says, is overtime. Good work is done within the time calendar as scheduled in advance. Overtime is a cost driver that must be avoided. Hence, David makes a special effort to ensure his staff abides by the established Work Breakdown Structure (WBS) and maintains highly cohesive communication patterns. This is not to say that clashes do not occur; conflicts are a natural occurrence. David’s technique is to separate the belligerents, cool them down, and try to understand what triggered their emotions at the source of conflicts.
3.14.5 Conclusion
Overall, there is a sense that the project has gone according to the timeline set from the get-go, the budget, and in full adherence to the norms of quality imposed by Meggitt. AFT keeps enough materials at hand to avoid supply crises. All of the skills necessitated to build the boat are transferable, so that the absence or loss of one key team member can be compensated by the coming of a worker drawn from the crew of some 150 employees at AFT.
3.14.6 Appendix A of Case 3: The manufacturing of the Hammerhead40

3.14.7 Questions related to Case 3: AFT
Discuss how the Hammerhead project responded to an opportunity.
List the stakeholders and classify them according to the People’s nomenclature: customers, suppliers, Forces of Production, FP, and so on.
Give the characteristics of the Hammerhead boat and discuss in what way it corresponds to the characteristics of a project (e.g., innovative).
Discuss the Plan.
Discuss norms of quality.
Discuss the POW.
Discuss how trust and collaboration are fostered at AFT.
3.15 Appendix 3.1: Feasibility study template
This template starts with the prefeasibility form, with additional details as follows:
Project charter
Detailed analysis of the triple constraints
Detailed WBS
Analyses based on the types of analysis (see Chapter 7)
Six strategic Ps analysis (see Chapter 7)
Management plan
Conclusion:__________________________
Signature:____________________________
3.15.1 Checklist

Of course, the document is to be adapted by each feasibility analyst.
Endnotes
- O’Shaugnessy (1992, p. 101).
- Jaafari (1990).
- Farrell (1995).
- O’Shaugnessy (1992).
- The newest version of the PMBOK has abandoned the concept of the triple constraints and juggles instead with a number of concepts that are inputs or external factors. I will review this in more detail further along in this book. For now, I adopt the position that the triple constraints frame a project manager endeavor. Note that the same comment applies to Mulcahy’s PMP Exam Prep book (p. 28). Customer satisfaction is listed as a constraint. This is not an operational constraint; this is the result of norms of quality, timeline, and costs having been respected after they had been established following a needs analysis (which PMBOK 5 refers to as “collect requirement” in the group of processes 5.2), which indeed is of prime importance (Owusu and Welch, 2007). Risks are also listed as a constraint (p. 28). Risks are external factors that influence the transformation process that a project is; they are certainly not a “guideline” (a constraint) within which to operate. Resources are input, not constraints. Scope is a vision while norms of quality are truly a constraint: a binding component of the project.
- See Morris and Pinto (2004, p. XV).
- A number of financial tools are available, of course, but this is not the subject of this book. For a quick overview, see Mulcahy (2013, pp. 267–269) and Schweser (2015, pp. 42–43.)
- Morris (1989, p. 180).
- See Morris and Pinto (2004, p. XV).
- PMBOK 5 states (p. 6) that the constraints are composed of scope, quality, schedule, budget, resources, and risks. I oppose this because scope is a vision, resources are the Means of Production and risks are an external force. The original concept of the triple constraints should have been kept, in my modest opinion.
- We will see these in more details further along in this book.
- As a metaphor, we could relate the concept of “mobilization” in targeting POVs to the notion of immune mobilization in the body.
- My translation.
- See my study on the link between trust and quality in the SCF case at the end of this book.
- PMI (2004, p. 1).
- The absolute standard is, of course, an ascending linear curve with a slope of 1.
- Note that in Figure 3.3, because transformation is considered an action, it cannot henceforth be treated as an object; therefore, the four Ps that point toward it cannot be structural process elements (because these define an object/element), so that Influence arrows are used (I) (see Chapter 4 on modeling Processes).
- Starting from the second half of eighteenth-century England, this would include: animal power, anthracite, charcoal, coke, human power, hydro-power, natural gas, steam, wood, followed by electricity, petroleum, atomic, solar, and wind energy.
- FP and MP are used in plural form, meaning that FP refers to “Forces of Production” and MP to “Means of Production.”
- PMBOK 5 (2013, p. 169). Equation 3.1 (with its calculated standard deviations and variances) is widely used; of course, my experience tells me that often, however, project managers boost the value of the realistic scenario versus that of the pessimistic scenario in an effort to better represent the reality.
- This formula is found in countless books on project management dating back decades.
- See PMBOK (2004, pp. 76–78).
- See Morris and Pinto (2004, p. 13).
- See Morris and Pinto (2004, p. 17).
- Chapter 7 will show that a product tree analysis can be used in this case.
- Recall Table 2.13.
- A full strategic analysis would include the six Ps of strategic management (PRO, POW, POE, POV, the four Ps, PWP), see Chapter 7.
- Note: I use the word “phase” for the input (T) → transformation (T) → output model, which forms the transformation chain, and “stage” for the five steps taking place within the transformation phase.
- Melville (1851).
- Pace has been found to be a characteristic of innovation according to Shenhar and Dvir (2007), and innovation is a sine qua non condition to the definition of projects.
- I will expand on the types of variables in Chapters 4 through 6.
- As seen, this relates to how well the project is defined, that is, how complete its description is as presented by the project promoters.
- A friend of mine calls the “Project Implementation Groups” the Pigs ... now, that’s not nice!
- For example, PMBOK 5 (2013, p. 38).
- Variables are descriptive, of influence, longitudinal, or causal.
- Website: http://www.aftheriault.com/en/.
- Website: http://meggitttrainingsystems.com/About-Meggitt.
- Photos generously provided by AFT.
- See Chapter 4.
- For obvious reasons, only nonconfidential pictures are made available. These pictures have been taken by the author.
- 41. Putting the date and the currency on any table that treats costs is highly recommended. Indeed, currency value changes over time and according to country.