
chapter two Plan—Prefeasibility study

So it is, said the Wise Eagle, that nothing is impossible, as long as you know ahead of time what is feasible.
Darloz
2.1 Introduction to Chapter 2
The present chapter offers a methodology to quickly assess a project with as much information as possible; with an eagle eye, so to speak. The operational details are set aside for now; nevertheless, shedding light on the project from different angles is a way of uncovering obscure spots, of identifying points of vulnerability (POVs). As an example, one can look at a stone lying on the ground while the sun is throwing its rays on one side of it, thus generating a shadow on the opposite side. This is a dark spot, a potential POV. What we want to do is use as many sources of light as possible all around the object we are viewing—in the present example, a stone instead of a project—in order to eradicate the chances that dark spots, ominous troubles, or covert agendas could develop. In fact, meteorology has it that the understanding of hurricanes, as an example, comes from simultaneous observations from different vantage points.

2.2 A definition of prefeasibility
I define a prefeasibility study as follows:
2.2.1 Definition of a prefeasibility study
The prefeasibility study, which follows the initial value proposition of the project, offers a general view of the said project using various analytical frameworks that allow the feasibility expert to make a recommendation on the suitability of a feasibility study.
Five frameworks (suns throwing light) are deployed in a prefeasibility study. They are (1) the frame of definition (S and F process elements), (2) the contextual frame of risks, (3) the project’s potentiality, (4) the project’s parameters, and the (5) Key Success and Failure Factors (KSF and KFF).
I now discuss each framework in detail.
2.3 Frame of definition
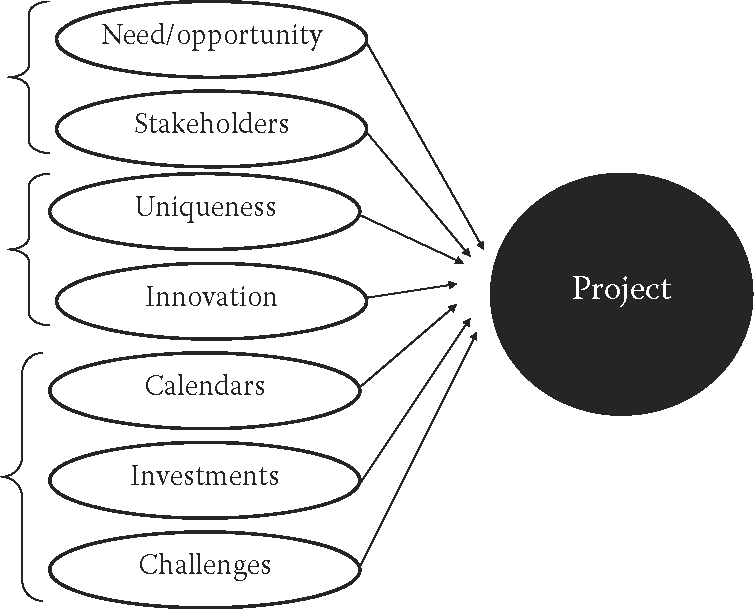
This frame serves to confirm that the project has all the mandatory features that make it a project. Common sense dictates that if a project contains no technical challenges, has no elements of innovation, or else does not respond to an opportunity, there is no justification to conduct a prefeasibility study. A project’s promoter should be able to convince the analyst that his/her project is unique, is contained within a limited time frame, is innovative, that it includes challenges, that it guarantees the leader’s and the team’s involvement, that it requires some level of investment, and, of course, that it responds to an opportunity (Figure 2.1).
In Table 2.1, I take the example of the Québec Multifunctional Amphitheatre (QMA) and check its characteristics.
Besides checking the characteristics of the project, the feasibility analyst will want to verify that all aspects of the project1 are properly identified and defined. Again, let us use the QMA example, as shown in Table 2.2.
Finally, the analyst wants to determine the size and the nature (Plan) of the project, according to the remaining three Ps: the thrust of this effort may be Processes (e.g., a NASA undertaking), People (e.g., a slaughterhouse in Africa), or Power (e.g., an election) depending on the project, or a mixture of these Ps.

2.3.1 Points of vulnerability and the definition frame
Through his/her analysis, the feasibility expert should try to identify the various POVs that may weigh on the project. Clues that he/she can use are given in Table 2.3.
All of these ways of looking at the project complement each other and guarantee, in theory, that the project is well planned and understood from a descriptive point of view. The analysis should not merely consist of listing characteristics or process elements; rather, the focus is on uncovering POVs.


2.4 Contextual frame of risks
As I discussed in the general introduction, risks and vulnerabilities are two different concepts. Some authors see hazards as a source of threats2 with these threats being capable of causing damage or, in terms of projects, of compromising the calendar of activities, the cost structure, or the norms of quality for the given project. Vulnerability is the sensitivity that one (or a project) has toward the threat.

Viewed from this angle, a risk is simply the probability that a threat can cause harm (cognitively speaking, can cause an error in the decision-making process).
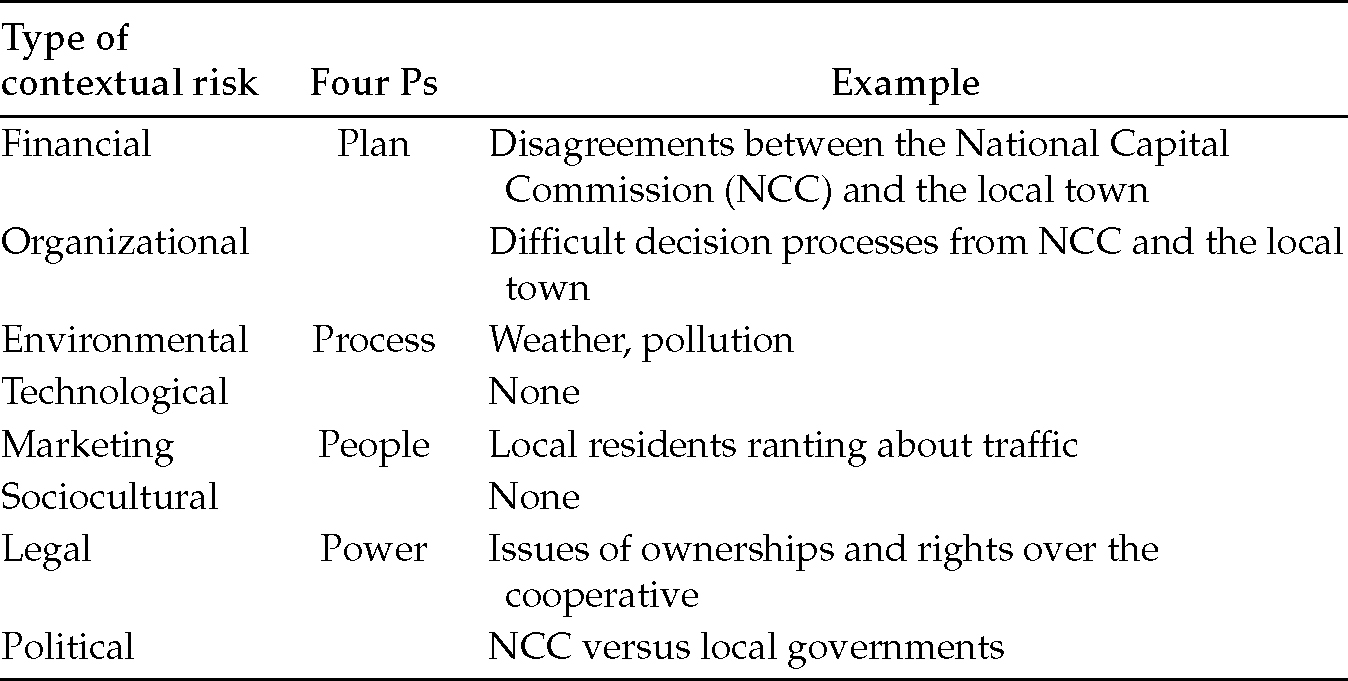
The contextual frame of risks lists the major areas in which the potential for setbacks could occur. It may remind some readers of the PESTEL framework, but in fact, it is different: PESTEL refers to some “political, economic, social, technological, environmental, and legal” work frames. I use the wording “sociocultural” when referring to external risks, and the term work psychodynamics to describe the internal cultural and social interactions between stakeholders. As we shall see in Chapters 5 and 6 devoted to People, human interactions can be examined much like a mechanism with its own nuts and bolts. I illustrate the risks in Figure 2.2.

In the case of the QMA, environmental concerns were treated by way of Leadership in Energy and Environmental Design (LEED) certification, obtained through credits allocated to various aspects of the project such as the efficiency of water management, the efficient use of materials, resources, the conservation of energy (avoidance of wastes), sustainability (e.g., durable materials), the presence of ecological sites, the quality of innovation and design, and the quality of the interior spaces (ventilation, etc.) during construction and during occupation (once the structure is complete).
A political risk assessment model has been presented3 whereby the risk source (in the host country) leads to possible events (e.g., a government intervention), which then leads to a risk—seen as the interaction between a threat and vulnerability—which then has some consequences (such as cost overruns). In this model, the interaction between threat and vulnerability is stated. Assuming that threat is the probability that a risk can cause harm, the authors of the aforementioned model rightfully correlate risks and vulnerability, and rightfully point to potential grief (under the heading “consequences,” which, in this context is a positive causal bond C+).
I have separated risks into eight different contextual categories, which means that POVs may appear in any one of them. I represent the context of risks as influence variables (I±) in Figure 2.3.

The reader will note that I consider the influence to be moderating (I±)—thus, the arrow emerging from the process element called “contextual risks” points toward an arrow linking two process elements and not toward a single process element/parallelogram4. This means that for some stakeholders, risks are actually a source of motivation while for others they are a nuisance. Hence, the influence can be positive or negative (I±). It is not so much risk that is the problem (there will always be risks) but the way it is managed.
2.4.1 Points of vulnerability and the frame of risks
We have seen that there is an intimate link between risks and vulnerabilities. Put simply, risks are external forces that affect a project while vulnerabilities are internal points within a project (within each of the four Ps) that weaken its chances of success. As previously discussed, my research shows their relationship,5 which can be seen in Figure 2.4.

The function is, as seen in the general introduction:6
where k = constant, valued at 1.3 in an ideal scenario.
I will examine this thoroughly in the section on work culture (psychodynamics) in Chapters 5, 6 and 7. For now, all there is to know is that risks exist only where there are vulnerabilities—obviously, if an individual, for example, were not vulnerable to anything, no amount of risks would trouble them.
The feasibility analyst wishes to determine what risks can negatively affect the project [risks (I−) → project].7 In the case of the Mervel Farm example, see Table 2.4.
One way of determining risks is to list everything that can go wrong around a tantalizing project. Although this may seem like a negative approach, it is actually the most thorough method the analyst can use to perfect his/her analysis.
2.4.2 An example: A car oil filter
This case is inspired from a real venture; I have modified some elements in order to preserve confidentiality.
In the 1990s, three would-be East European inventors concocted a car engine oil recipient and filter. The promoters conceived a gilded plan that went about like this: They would sell two containers about 12 inches in diameter by 12 inches in height to each customer. Each customer would install the container in their car, connecting wires and pipes in various ways in order to reroute part of the engine oil into the container. This container would hold a certain amount of engine oil in its filter as the customer would drive his car. After about a month or so, the customer would remove the container and pack it in order to send it to a laboratory for analysis, at their cost (e.g., using a special delivery service). They would take the extra container and install it in their car to replace the first one. After a few weeks, the analysis done at the laboratory would provide the customer with information on the quality of their engine oil, including various minerals and dust levels. The promoters of this idea were convinced that their “invention” would entice customers to make better use of engine oil and motivate them to keep their engine clean, and thus making it more efficient, leading to savings and a better environment. They did not deem it necessary for the customer’s insurance company to be notified of the change, nor the car manufacturer to be informed how such a such new element in the mechanics of the car would influence the riding experience.
When I give this example to engineering students, the following risks (all due to outside influences8 and not to inherent vulnerabilities) are commonly listed: (1) financial—the cost of the patent, the lack of outside financing, and the requirement for a double purchase by the consumer with two units being required at a time; (2) marketing—competition (e.g., from companies such as Midas), a lack of interest from consumers, a lack of a real need/opportunity, or a lack of understanding of the product by the consumer; (3) organizational—complex relationships between the car owner, the three promoters, and the external laboratory; (4) environmental—contamination in the external laboratory; (5) technical/technological—accidents, breaks, erroneous use by customers, loss of the unit during transportation, product malfunction, poor or tainted laboratory analysis, or troubles at customs (POV: poor capacity to obtain and defend patent); (6) sociocultural—bickering with regulatory authorities (government, insurance companies, etc.); (7) legal—possibility of the falsification of data, lawsuits consequent to accidents (POVs: difficulty to offer warranty, disrespect of norms); and (8) political—no risk identified.
These risks can be weighted in regard to presumed internal vulnerabilities: Plans—the project seems overly optimistic; Processes—the control of many processes is out of the hands of the promoters; People—key staff (e.g., laboratory technicians) are outsourced (possible “bad apples”); and Power—the three promoters have little credibility in the domain.
A feasibility analyst is trying to set measurement scales so that their analysis can be compared with other projects. Assume the analyst arrives at the evaluation of the project given in Table 2.5.

The prefeasibility index works as follows: strictly based on a risk assessment, a value of 96%+ suggests that the project can proceed9 (“go”); with a value ranging from 80%10 to 95%, inclusive, the analyst would impose strict conditions and would request more information about the project; with a value ranging from 0% to 79%, a “no go” would be advisable.
Playing the devil’s advocate role is what must be done when seeking to unearth POVs. In the case of the oil recipient, the major concern is the lack of demand for the product and the major POV is the lack of control by the promoters. Remember that one of the key characteristics of a project is the presence of a need (opportunity)—in this case, a consumer would simply go to the garage every six months and change the oil as a routine effort. There are no latent needs to speak of.
2.5 Frame of potentiality
This frame of potentiality is based on the Project Management Body of Knowledge (PMBOK) and is a way of ensuring that projects, big or small, are well articulated. A few items must be checked, according to PMBOK. I classify them using the four Ps system, as shown in Table 2.6.

At this point (prefeasibility) it is too early to measure potentiality in terms of People and in terms of efficiency/efficacy.
Various authors differ in their opinion on such an assessment. Some say, for example, that critical parameters relate to what is called “a market/economic hypothesis”, which includes, in their views, legislation, the market opportunities for the new investment, the natural environment, the social and political environment, and so forth.11 A large vortex of candidate POVs is offered: an impoverished image for the company due to poor use of new technologies in the production process; the absence of cooperation and problems with personnel training; a lack of flexibility in new processes; the presence of dangerous, tiring, monotonous, and routine tasks for labor and so forth.
Certainly, such lists can be of value, but it seems that they can go on forever. The best approach, I feel, is to resort to a simple framework as per Table 2.6, especially in the prefeasibility assessment phase.
The PMBOK specifies that the questions listed in Table 2.6 must be posed throughout the project life cycle, not only at the preliminary stage. Indeed, they may act as a barometer; the more precise the answers are, the more useful the analytical frame is for the project manager that works day in and day out in the field.
As a brief overview, let’s go back to the Mervel Farm project. If we go by our frame of definition, we must confirm that all four structural variables (the four Ps) have been defined. Is the plan well defined? Will the planned processes likely take place? Does the proposed project deal with stakeholders (People) and lines of authority (Power)? Moving on to the contextual frame of risks, have the promoters taken into account the risks in all of their forms (marketing—neighbors’ complaints about noise or odors; environmental—e.g., farm pollution)? As for the frame of potentiality, how effective are the control/monitoring systems (for the loads of volunteers, for the flow of tourists, or for vehicle traffic)?
During the prefeasibility stage, the analyst’s evaluation is quite subjective, but this effort is worth it nonetheless. Working through each framework at a time allows the feasibility analyst to get a tentative picture of the dark spots (POVs) dotting the project even though he has only taken a rough look at it. It may raise some flags without sounding the alarm; this is a way of avoiding catastrophe (chaos) down the road. As put forth by a project manager:12 “A catastrophe is a situation which impacts exceed anything that was initially forecasted.” Chaos is easy to see in the Mervel farm case: a massive arrival of foreign tourists showing up unannounced in various coaches, huge traffic jams build up downtown, annoyed neighbors and local businesses can’t profit from it and file complaints. The tourists finally find their way to the farm as a thunderstorm kicks in. People seek refuge inside the farmhouse. Soon enough, there is a melee; not enough toilets; people walk involuntarily onto crops; they start whining in English, French, Spanish, Chinese, Urdu, and Esperanto(!); the army of volunteers panics, and it goes on and on.13
2.5.1 Points of vulnerability and the frame of potentiality
Table 2.7 focuses on some core questions recommended throughout the PMBOK. These relate to internal processes, and thus to potential vulnerabilities. It appears useful at this point to offer a wild guess at what would breed these vulnerabilities from outside of the projects, indicated in Table 2.7.
Hence, the frame of potentiality makes a lot of sense when it is accompanied by the contextual frame of risks.

2.6 The parametric frame
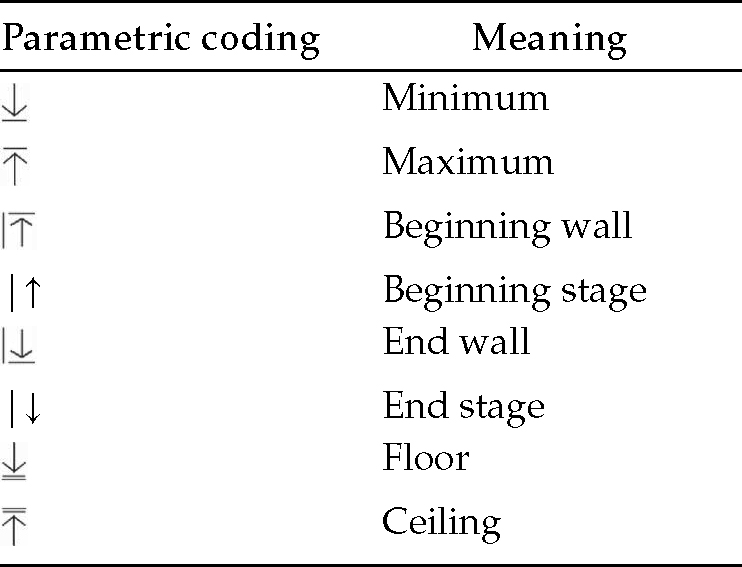
We have very briefly seen that we could model processes with the use of parallelograms. However, I have not yet explained in detail how we go about specifying measurement scales, although we have sparingly touched on walls, ceilings, and floors. In fact, there are three ways of modeling, which are as follows: (1) process modeling, (2) psychodynamic modeling, and (3) parametric modeling. The first type uses parallelograms and arrows, the second bubbles and arrows (which we will discover in Chapters 5 and 6 on People), and the third one uses boxes and lines—the three lines representing walls, ceilings, and floors. In short, boxes and lines are a way of indicating that what is referred to in the model is a measurement. For example, a ceiling of US$25,000 is a measurement that says that the project requires US$25,000 in order to commence (below that level, the project has not commenced, hence the reason we call it a ceiling: it is the ceiling of the non-start-up of the project).
With respect to walls, ceilings, and floors, the basic assumption in a project feasibility analysis is that a project evolves in an ascending linear fashion (Figure 2.5).
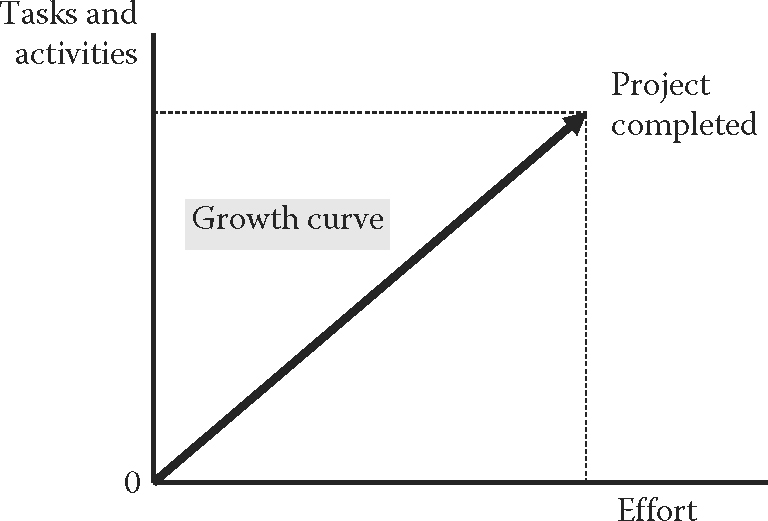
This assumption is simplistic (we set it with a slope of +1), yet it leads to important consequences. If one thinks about it, the assumption in classical economics is that buyers and sellers articulate the quantity of goods demanded and offered around price alone (when in fact functionality and design count as well). It is very simple and yet, from this simple model, a vast area of knowledge and activity has developed over centuries. Here, we simply state that as more efforts are put into the projects, the number of tasks and activities related to completion increase. In fact, we can also reverse the statement and conclude that as more tasks and activites are planned, more efforts will likely be needed. Here, we are in the planning stage; by reversing the graph, we would be in the mobilization and deployment stages.
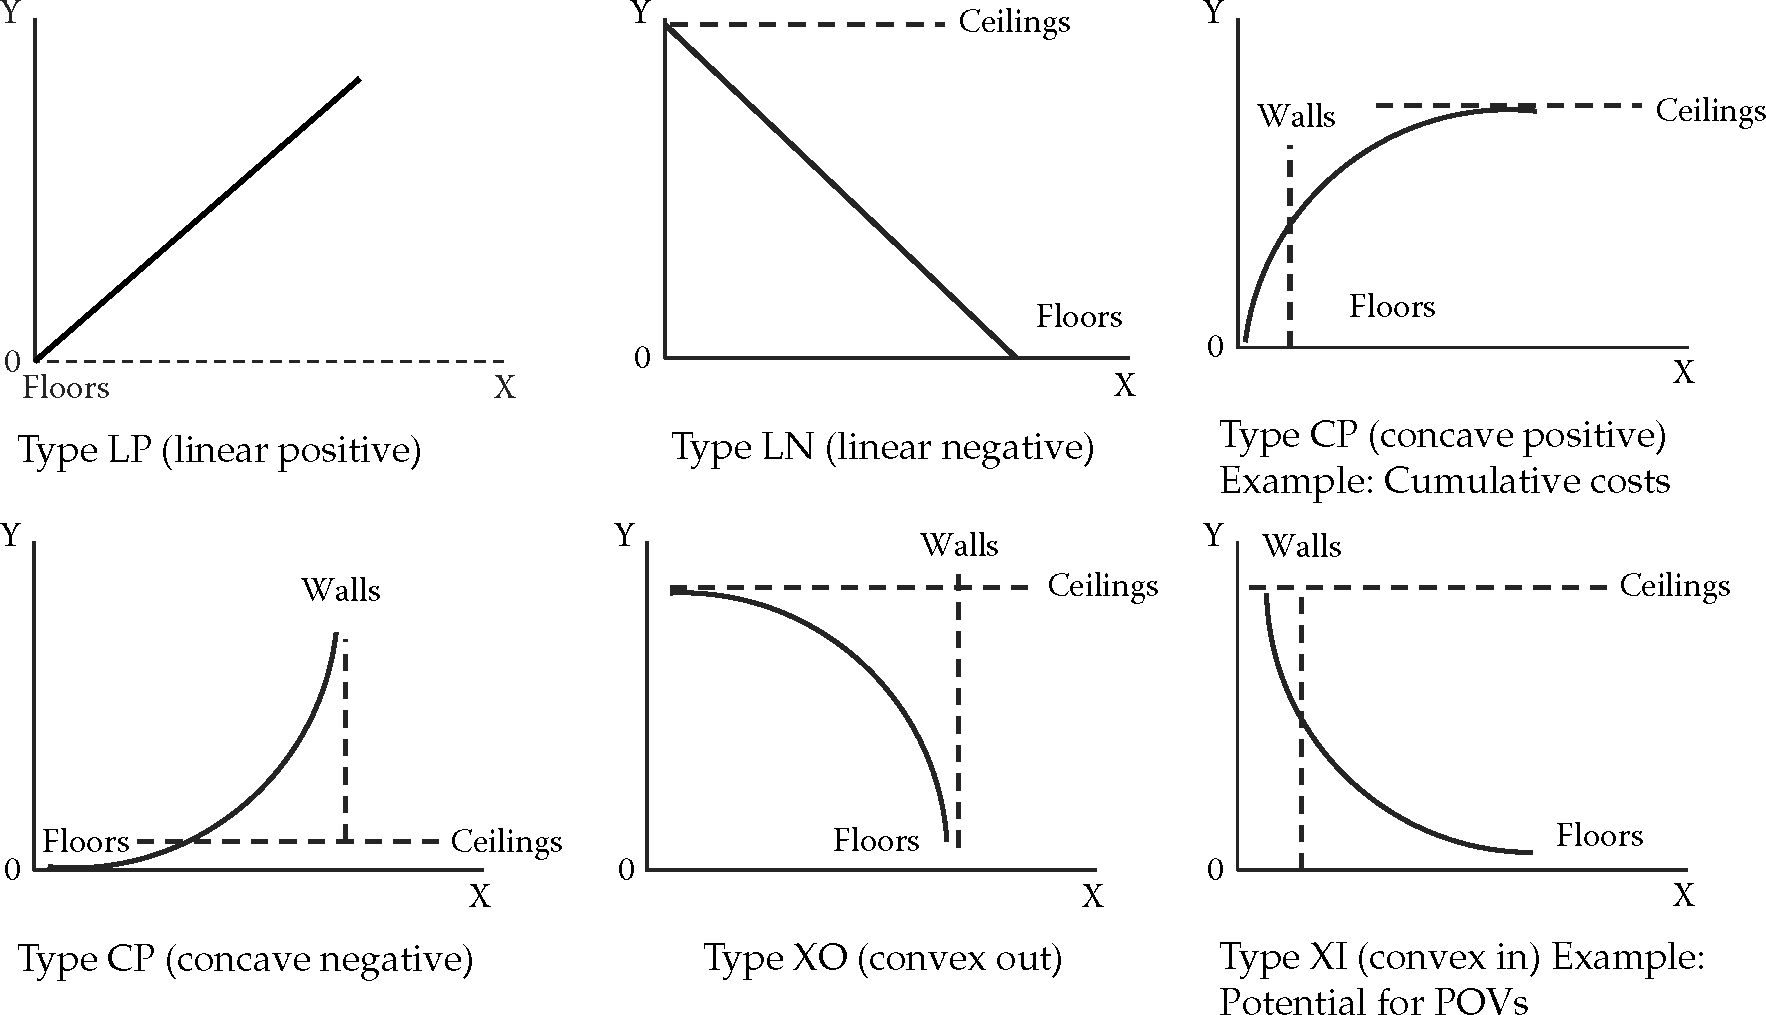
Walls, ceilings, and floors transform the linear evolution of projects. The analyst can place them around the linear growth curve exhibited in Figure 2.5 and specify what they represent; conversely, he/she can examine a curve and break it down into stages by inferring that the presence of walls, ceilings, or floors is what transforms the straight curve (with a slope of 1) into a nonlinear curve. The scenarios given in Table 2.8 depict these concepts.
This way of seeing a project allows the feasibility analyst to determine which of the calendars (walls), costs (ceilings), and norms of quality (floors) are most important during the evolution of each curve. In the case of a negatively sloped curve (at −1), for example, only the ceilings (which push the curve down instead of up) and the floors are active, with no walls playing any “pushing” role. This means that costs (ceilings) and norms of quality (floors) rather than the calendars (walls) play a role between the beginning and the end of the project. In the case of a positive concave curve, a series of walls (calendar activities) push the linear ascending curve (with a slope of 1) to speed up (hence the concave shape). Eventually, ceilings (costs) start kicking in. In this latter case, therefore, it is calendar and costs that drive the project, not costs and norms of quality. S-curves, bell-shaped curves, and the like are simply combinations of these six basic patterns appearing in Table 2.8, which are also forged by the interplay between walls, ceilings, and floors. These forms represent the mathematical functions that appear regularly in project processes. For example, some authors propose that calendar (x) and accuracy of estimates (y) form a type CP (concave positive) curve; that calendar (x) and ability to control costs (y) form a type CN (concave negative) curve; and that calendar (x) and project risks (y) form a type CN (concave negative) curve.14,15
We will encounter many of the basic curves throughout this book. They can all be explained by way of walls, ceilings, and floors affecting the basic linear positive curve with a slope of 1 (+1), which is one of the basic tenets of my model. The walls start or stop the continuation of the linear curve (beginning and end walls), floors set a minimum level that cannot be transgressed and that divert the direction of the basic linear curve, ceilings set a maximum level that cannot be transgressed and that divert the direction of the basic linear curve.
It is the presence and the different positions along the linear ascending curve (the growth curve of the project) of the walls, ceilings, and floors that create each individual curve type. This makes comparing processes relatively easy because what needs to be investigated is the presence and placement of walls, ceilings, and floors in order to comprehend any process (e.g., with respect to time, costs, or norms of quality).
To give an example, let’s take a hypothetical curve,16 such as Figure 2.6.

This curve is initially quite flat and remains that way for some time; however, much like a growth spurt for a teenager, all elements of the project come to play an active role during the implementation stage as the deadline quickly approaches. Once the project is completed, there is little left to do except close the project. An expert in handling this type of analysis will easily identify curve patterns of processes and determine which of the three constraints to focus on.
What is important here is that parameters set the frame within which the project develops. We will see that walls, ceilings, and floors are important considerations during the life cycle of a project; what matters is to set the parameters’ frame of activities that will govern the project. The Building Code is a floor (bottom) parameter: a construction project cannot be approved without abiding by the standards set by it. For the African project, key parameters/requirements would have been the presence of roads as well as water and electrical infrastructures.
In terms of the procedure for producing parameters and setting scales, the following steps have been proposed:17
Step 1: The analyst creates a model after reviewing the literature, conducting interviews, and leading discussion groups.
Step 2: He/she establishes measuring criteria and places them in a hierarchical order.
Step 3: He/she conducts a pretest to validate the newly created instrument.
Step 4: Finally, he/she confirms and administers the questionnaire.
Judging a project without qualitative measurements (added to quantitative measurements) is a sure way to leave POVs uncovered, because it opens the door to faulty interpretations—in addition, at times, people prefer to keep their eyes closed rather than facing the vicissitudes of a project life cycle.18
Reverting to the Mervel Farm project, we as analysts would be reviewing what has been written on similar projects; we would conduct interviews with the current promoters and with experienced managers of similar projects completed in the recent past, and we would have a focus group with some of the neighbors. We would then select and classify criteria, thus allowing us to assess whether the project is viable, and successfully so. These criteria would include items such as acceptance by the local community, commitment by the city to upgrade the parking lot and traffic-related infrastructures, management experience, as well as the presence of firm contracts.
A questionnaire would be generated with the aim to measure the overall likely demand for the products and services offered by the promoters. Once validated, it would be distributed to a sample of 1000 local residents and business owners in order to run statistical analyses. In the best-case scenario, everyone would be happy. In the near-worst case, most would reject the idea. In a doomed scenario, the analyst would conclude that the project is feasible and profitable when in reality all kinds of POVs would sprout as the project takes place. Such catastrophic scenarios are possible. Let’s imagine bad weather developing, panic kicking in, and so on. It would be normal for the participants19 who fill out the questionnaire not to have forecasted such problems—this was not their responsibility. Their viewpoint may already have been biased: they responded to the questionnaire assuming the project had been properly planned. The promoters could always tweak the information to make it look like all is fine (overly optimistic), even after having interviewed some experts in the field.
The five analytical frames, including the parametric frame, come in handy because they allow the analyst to examine the project from different angles so that the POVs that people do not think of, do not wish to admit, or else ignore can be unveiled.
Recall that I mentioned parallelograms and boxes when dealing with process modeling. Boxes come in two types: parameters and observables (we will discuss observables in Chapters 5 and 6 on People). Parameters are quantitative criteria that are used to indicate what the value of a parallelogram is. A boxed value can point to a wall, in which case it indicates that the value of this wall is, say, July 16, 1976. The value can also be a range. For example, we will see that the ideal ratio between management control and transparency when it comes to Power is k, that is, 1.3; in general, the ratio remains functional between the values of 1.0 and 1.8. So a box pointing to the construct Control/Transparency could contain the value range of [1.0 < × < 1.8].
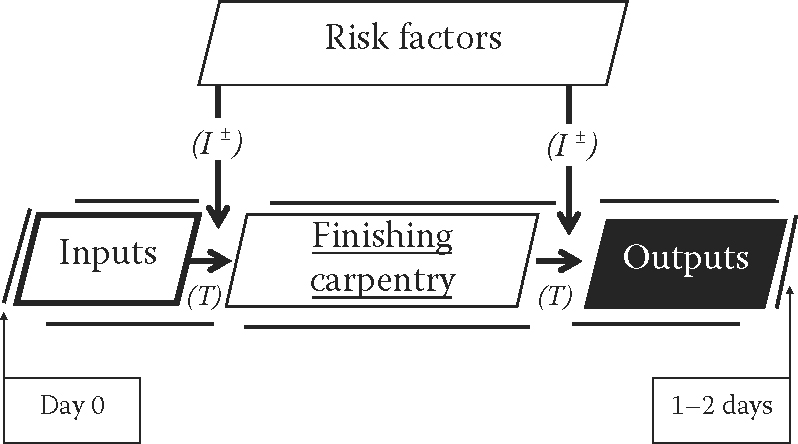
Indeed, when preparing a project and when the transformation phase is not developing along a critical path, it may be useful to allocate an operating margin.20 The operating margin is a range that the project manager is willing to allocate to a particular activity; say, for example, finishing the carpentry inside a room with an allocation of 1–2 days. Figure 2.7 illustrates my point.
Now, suppose we wish to explain the fact that the birth of a particular project is influenced by an initial investment that varies between US$20,000 and US$25,000, no less, but no more (in which case, that money would have a better opportunity of earning interest somewhere else, for example, in another project). We would have: Initial investment ![]() US$20,000
US$20,000 ![]() US$25,000 influences positively (I+) → project commencement (
US$25,000 influences positively (I+) → project commencement (![]() ). The codes are shown in Table 2.9.
). The codes are shown in Table 2.9.
Used jointly with the so-called descriptive and consequent arrows, which we shall see in Chapter 4 on Processes, an entire process can be written using this symbolic language. Let us take the example of the Stradivarius concert. We would have [(![]() US$20,000
US$20,000 ![]() US$25,000 investment (I+) →
US$25,000 investment (I+) → ![]() Project) + (Ticket sales)] (C+) → Project success
Project) + (Ticket sales)] (C+) → Project success ![]() . This reads: with a minimum investment of US$20,000 and a maximum investment of US$25,000 coupled with ticket sales, conditions are met to ensure the concert’s success. This simple way of describing the project has the advantage of showing how critical steps for a causal link (C) are more critical than a link of influence (I). It also shows the relationships between the process elements (or stages) and has the ability to assign a value (a parameter) to each such element, such as a value of US$25,000 for a ceiling maximum cost (
. This reads: with a minimum investment of US$20,000 and a maximum investment of US$25,000 coupled with ticket sales, conditions are met to ensure the concert’s success. This simple way of describing the project has the advantage of showing how critical steps for a causal link (C) are more critical than a link of influence (I). It also shows the relationships between the process elements (or stages) and has the ability to assign a value (a parameter) to each such element, such as a value of US$25,000 for a ceiling maximum cost (![]() ).
).
It is fundamental that every process element be measured and that steps are quantified; thus, as part of the prefeasibility study, every such element that is disclosed must be accompanied by a parameter, which, in a diagram, would be enclosed in a box. Boxes are not related to time. They refer to a number (or, in the case of psychodynamic analysis, to an observable).
Because the parameter coding system reveals the most critical aspects of any process, it cuts straight to the point and produces a pristine working model. It is a great tool to identify POVs because it outlines at a glance where there are potential weaknesses in the flow of reasoning. In the parametric frame of analysis, the emphasis is on tasks and engineering, rather than on the human or organizational aspects of the project. A project promoter, who would not have a clue about how to set the measurement parameters, would disclose that they are not ready to launch said project. Measurements are tailored to each unique project and hence help “contextualize” it, making it more concrete and easier to adhere to by future team members. The following steps are proposed to complement step 2 of the aforementioned method:21,22
Find parameters that already exist for specific tasks and activities. In the home building industry, for example, tasks are divided among various trades, which are governed by standards (e.g., procedures), code (e.g., the Building Code), as well as laws (e.g., the Safety Act). Some authors emphasize the importance of determining what skills are required and what infrastructures are necessary before launching a project, in addition to consulting with stakeholders such as the local community.23
Find appropriate forms, formal documentation, and procedures manuals, such as project contracts, submission forms, technical specification forms, and so forth (e.g., in a scientific laboratory or chemical plant, a material safety data sheet [MSDS]). A promoter that cannot include at least some of these essential forms with the submission of his project is sending a message that he is not ready to initiate his project.
Find equivalents (for standards, codes, and laws) should exact forms or adequate parameters not be available on site. Building codes, as an example, vary according to the seismic activity of a given country. It might be useful to know what metrics other countries take against earthquakes, if only to prepare for a construction project in an area presenting seismic activity.
Find similar projects. One can then determine if past learning can be of use. Seeing where similar projects have encountered difficulty is one way of identifying points of vulnerability (POVs).
In the case of the Mervel Farm project, two similar projects are readily available for comparison. They are the cases of two not-for-profits organizations in two different Canadian cities, which decided to organize a hidden chocolate egg contest in their respective municipal parks for the Easter holidays.
The actual number of parents and children that showed up far exceeded expectations, resulting in a near rampage by overexcited children who got there first while latecomers (or runners!) wound up in tears at having been left with nothing. Is this a lesson that can be learned at the Mervel Farm? Probably. Success, strangely enough, can be a point of vulnerability, if it is not adequately managed.

A promoter who has no or little backup to justify his project may be initiating POVs without even realizing it; hence, the importance of conducting a prefeasibility study that covers as much material as required, and the relevance of meticulously setting parameters (which are entered in a box when illustrating the project in diagram format).
2.6.1 Points of vulnerability and the parametric frame
My modeling proposition has the advantage of finger-pointing at POVs. We will see in Chapter 4 on Processes that it simplifies all processes by using four types of action: Descriptive (S and F), Longitudinal (T), Influence (I), and Causal (C); and three forms of parameters: walls, ceilings, and floors. We suppose that all of the processes that need to be expressed in a given plan, and that eventually must be examined in a prefeasibility and a feasibility study, can be rendered by way of these simple tools.
As an overview of Chapter 4 on Processes, what needs to be done is to draft a model that expresses the project in its totality (not in its minute details yet) and set the scales that will allow the analyst to evaluate whether each step of the project will likely happen according to the preset norms of quality.
Modeling can help shed light on POVs; these points are already anchored in the project or will develop where the logic of the process fails. To understand how this works, a series of questions must be raised, such as: “Is the link between process element A and process element B really an influence (I+) link? Could it be a causal link (C)? Has the analyst identified all the elements of the main process elements? Why is there a wall at this particular stage in the transformation process?” And so forth.
In other words, the feasibility experts check whether the reasoning behind the project model makes sense. If it doesn’t, if a component of the model cannot be explained in a logical manner with a way of measuring it, then there is likely a POV. A link that is wrongly identified between two process elements (it turns out to be a causal link, C, rather than an influential link, I), a main element that is not well defined or incompletely assessed (so that some production steps have been forgotten), or else a wall that cannot be justified are all indications that the project may crash, in part or in whole. The relevance of that crash is measured when looking at the parametric frame of analysis.
Hence, the prefeasibility study is concerned with properly defining the project, identifying the contextual frame of risks, and establishing the scales and parameters. This will become clearer as we progress through this book. For now, it is enough to remember that projects can be put into models and that it is of foremost importance to identify the parameters (such as the Key Performance Indicators, or KPIs) that will permit its measurement. When working with diagrams, parameters are put in boxes, whereas process steps are put in parallelograms.
2.7 Frame of key success factors and key failure factors
The goal of the feasibility expert is to evaluate methodically whether the proposed project has any chance of meeting its objectives; perhaps they would even like to estimate what the probability of success is. In other words, they must set the parameters that help determine whether a project is a success or a failure. Thus, the last but not least analytical frame is that of Key Success Factors (KSF) and Key Failure Factors (KFF); this is tantamount to measuring a project’s robustness (see Appendix 2.1).
There are two difficulties inherent in this terminology. First, it may be hard to differentiate between a KSF24 and a KFF—indeed, some of the KFF are just the opposite of KSF!—and so, for all intents and purposes, my qualify KSF as referring to everything that enhances strengths and opportunities, and KFF as everything that energizes risks and vulnerabilities.
Also, in my modeling system, so-called factors relate mostly to moderating variables25 (I±), but in fact the so-called factors of KSF and KFF are not factors per se, but rather process elements of influence (I+ or positive influence for KSF and I− or negative influence for KFF). In the literature, so-called KSF and KFF most often consist of strategies, tactics, and/or behaviors that affect the transformation phase of the project either positively or negatively. Thus, the terminology of KSF and KFF may be confusing. Because the standard terminology in about every article and book written about the success and failure of projects is tied to the concepts of KSF and KFF, I adopt this terminology, albeit reluctantly. The reader should keep in mind though that the term “factor” in this context refers to a process element of influence (I) when in fact KSF and KFF are usually strategies rather than factors. Let’s settle by assigning the expression “Key Success Fundamentals” and “Key Failure Fundamentals” to KSF and KFF, respectively. Also, please note that I treat the difference between KSF and KFF with some skepticism.
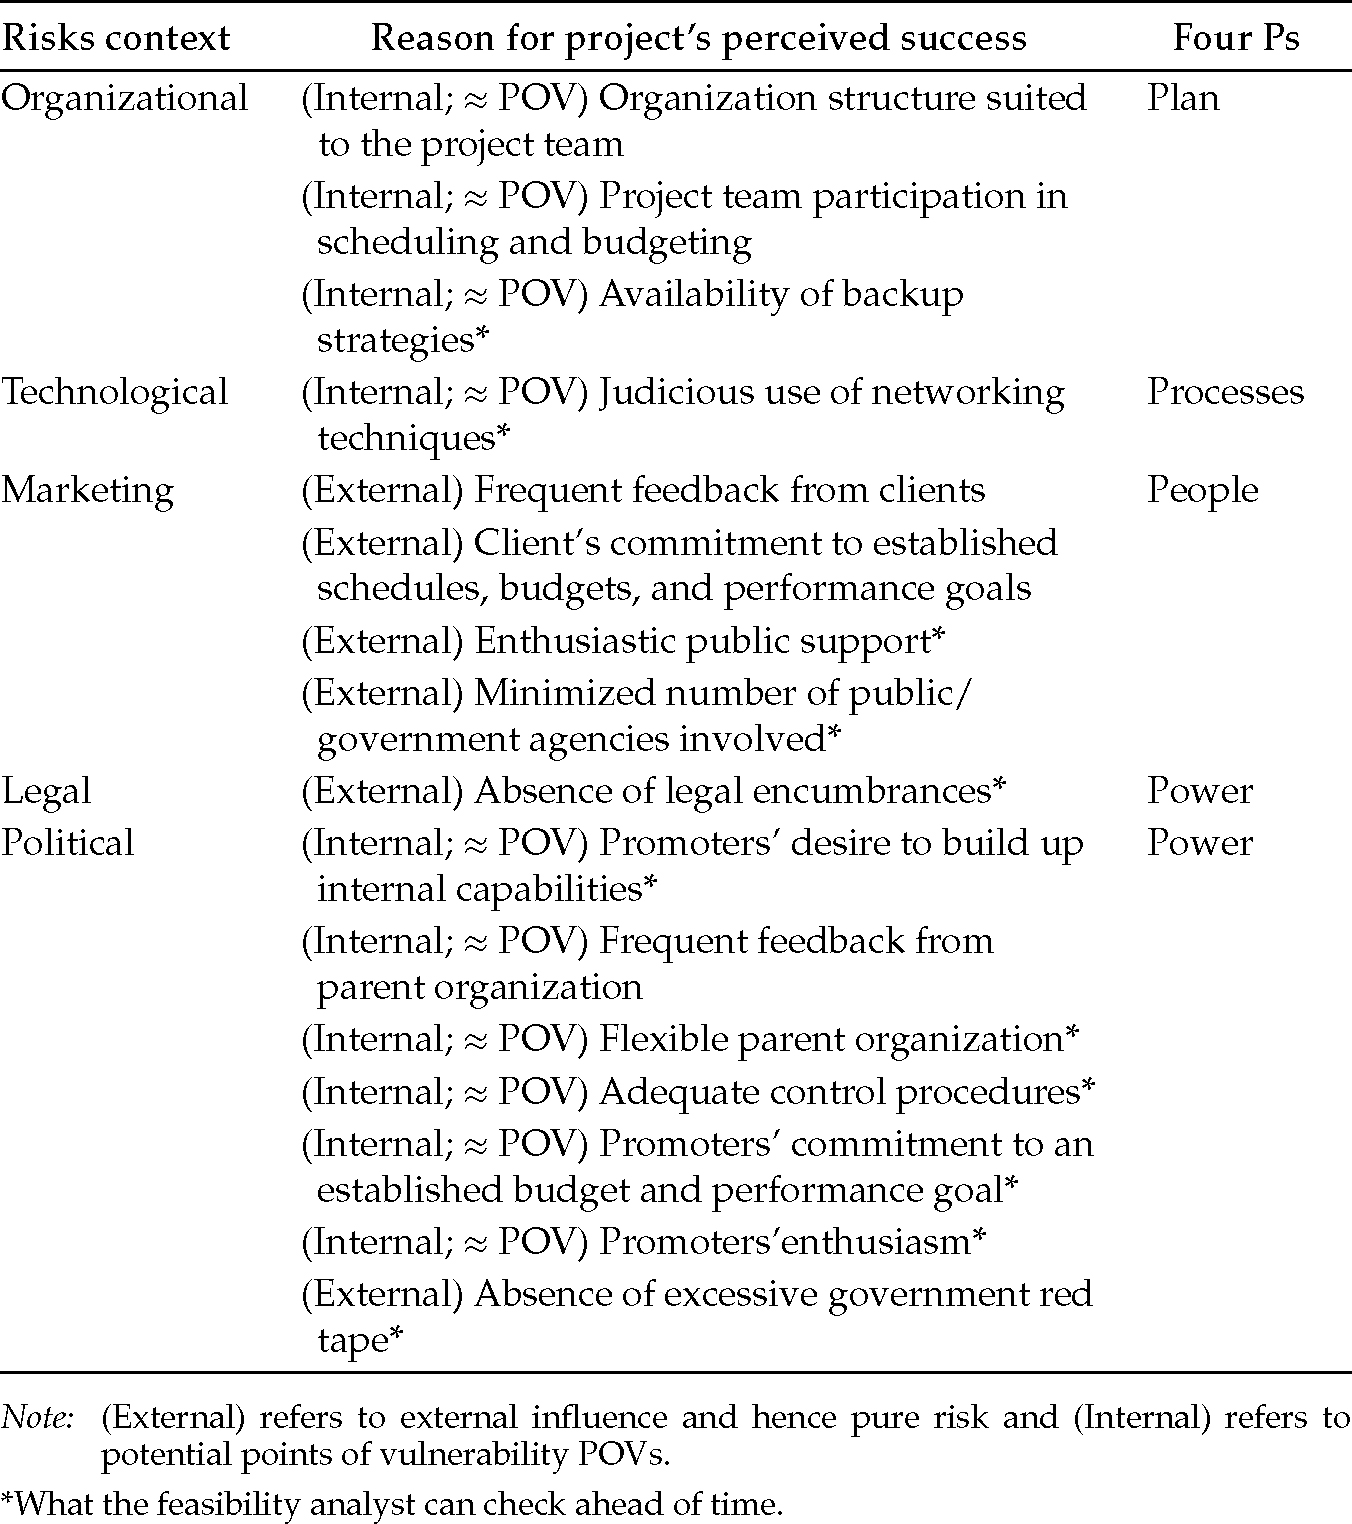
Examining historical projects in order to pinpoint what has worked and what has not is certainly a sound idea, and so is reviewing what scientific authors have thought on the subject. Some scholars are of the opinion that a healthy and safe working environment is an essential basis for an effective work team.26 Accordingly, a KSF would be for a project leader to provide a healthy and safe environment (see, it’s not a factor, it’s closer to a strategy!); viewed from another angle, a KFF would be to accept work in an unhealthy and unsafe work environment, such as is found in many underdeveloped countries around the world (yet, many projects are brought to term even though working conditions are unhealthy and unsafe). The same authors also elaborate by claiming that a team’s performance is tied to the functionality of interactions between stakeholders, the group’s stability, the involvement of people in positions of authority, and the rewards that achievers receive. Other scholars have expressed their views that duplication of work, lack of sharing of responsibilities, shaky coordination, and poor task definition are common causes of problems27—put differently, these factors may be a cause (C) for or an influence (I) that leads to failure, that is, they are a KFF if they turn the project into a fiasco. A list of necessary yet insufficient conditions that are strongly associated with perceived success has also been given by other scholars.28 This list can be matched against some of the eight contexts where risks operate their magic (I also include a reference to the four Ps and to external–internal control). I display this in Table 2.10.29
For each one of these elements, their presence or absence may potentially influence the success or failure of the project, so that there is no clean separation between what leads to success and what causes failure (C).
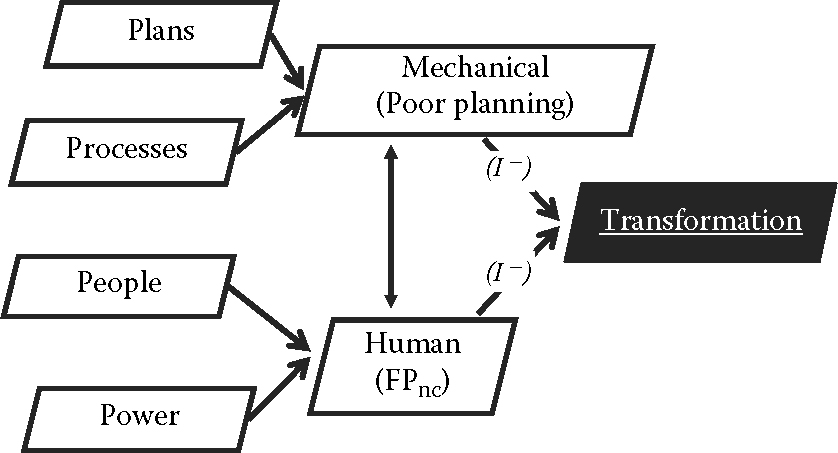
Overall, what seems to happen though is that there is a dreadful combination:30 that of poor planning intertwined with Unfits (uncontrolled Forces of Production, FPnc). Inadequate planning, which entails such problems as porous budgeting and scheduling as well as the reliance on excessive red tape may all mix in a somber manner with team members who display a lack of commitment to established schedules, are not cooperative, send excessive negative feedback, show lack of enthusiastic support for the team or else host dark agendas. Behaviors that would accompany such an organizational state would likely include “buck-passing”, a disregard for others, doodling, filing excessive grievances, procrastination, and sabotage. The following could also happen: constant interruptions, enforcing unannounced changes, holding too many meetings, misplacing documents, and resorting to excessive paperwork. Does it sound familiar?
In other words, POVs result not only from poor planning, but also from a combination of poor planning and an inadequate workforce (put differently, Unfits).31 Planning is perfomed by humans; humans can correct most mistakes they make.
The role of People and Power (the human component of my model) cannot be underestimated, as can be seen in Figure 2.8.
Looking at the MOS case, it is the addition of the overly ambitious technological challenges (a retractable roof from a tilted mast that is supposed to work well in the most grueling winter conditions) to the strike-loaded sociocultural environment that is to blame for the delays in finishing the roof.
Some authors offer a handful of what they call the “risk areas” and “Key Success Factors” (KSF) of a project.32 I extracted those from the source article and reworked the information as follows (please be prepared to read fast!). The star “*” means that the factor could be given consideration in a feasibility study. Cultural or sociocultural33 “risk factors” are (Plans) a poor acknowledgment of risks* and a lack of analyses*; (Processes) overly rigid systems*; (People) a culture of fear, a lack of training*, and a limited sense of belonging. Cultural or sociocultural KSF are: (Plans) ongoing analyses; (People) an open culture, a culture of knowledge, learning from experience, and trust; (Power) responsible risk management*.
For the stakeholders (People/Power) or psychodynamics (if internal), the risk factors are (Plans) ambiguous contracts*, changes to the norms, a lack of long-term planning*; (Processes) supply delays; (People/Power) a lack of commitment and strained relationships; (Power) a lack of support. For the stakeholders (People/Power) or psychodynamics, the KSF are (People) bonding with a community*, supplier relationships, tight human bonds, efficient communication; (People/Power) a partnership-like strategy*; (Power) collaboration with the regulators*, facilitating commitment, as well as managing risks and competencies.
For leadership, the risk factors are (Power) an authoritarian system*, lack of communication with external stakeholders, lack of support from the management, and poor management–employee relationships. The KSF are (Plans) focus on a project*; (People) team collaboration; (Power) external networking* and joint decision-making.
For risk management, risk factors are (Plans) an inefficient matrix*; (People) a lack of multilevel collaboration, a poor team spirit, and poor teamwork. KSF are (Plans) creating multifunctional teams* and a reinforced organizational matrix*; (People) easing communication and fostering a sense of belonging.
For organizational risk factors, the following are proposed: (Plans) a lack of risk countermeasures*, poor levels of analysis*, and poor risk identification*; (Processes) a lack of procedures*. KSF are (Plans) a crisis response plan*, a formal risk management plan*, risk assessment*; (Processes) continuous improvement.
For Processes, risk factors are (Plans) insufficient preparation*, lack of financial resources*, unrealistic calendar*, and poor planning*; (People) poor teams; (People/Power) a lack of commitment; (Power) contractual disputes and a lack of control. KSF are (Plans) a budget*, a contingency plan*, a formal plan*, an in-depth evaluation of the vision stage*, a realistic calendar*; (People/Power) sharing and commitment; (Power) control measure improvements*.
For Technology, risk factors are (Plans) poorly defined canvasses*; (Processes) excessive reliance on technology in order to solve problems and moving standards; (People/Power) lack of expertise*. For KSF, the following are listed: (Plans) a better definition of Work Breakdown Structures (WBS)*; (Processes) proven standards* and proven technology*; (People/Power) acquiring competencies.
The reader is entitled to go drink a glass of water!
In these lists, I observe that processes account for little in the attempt by the authors to find the KSF. Yet, processes play a vital role in the economy; a prime example is that of the transformation of iron ore by way of the Bessemer and open-hearth processing technologies that saw the rise of the iron and steel industry, which became a major force in industrialization (railroads, buildings) efforts around the world (especially in the United States and Great Britain). I also note once more that the merging of poor planning and Unfits is a recipe for disaster. On this topic, another scholar34 finds a positive relationship between project success and the project management method, which includes, in his terms, knowledge area tools, process capability, and profile techniques. It is also worth mentioning that the management of costs is barely mentioned (under “budget”) in the lists; references to calendars of activities (e.g., WBS) and to the four Ps are, however, made plentifully, if not directly then indirectly.
Other authors also have their opinions on KSF and KFF and how to label them. Some scholars35 identify the following “promoting” and “inhibiting” factors, which I extracted from their writings and reclassified according to my four Ps model. For the “Promoting” factors (I+), we have: (Plans) alignment of goals and objectives* and a well-defined charter*; (Processes) agility; (People) diverse and balanced teams, an effective reward system*, and good communication; (Power) empowerment. For the “Inhibiting factors” (I−), the following are listed: (Plans) discrepant priorities*, poorly defined roles and responsibilities*, and confusing resource requirements*; (Processes) contextual barriers; (People) limited training; (Power) bureaucracy and poor leadership.
Our observation of this list is that, just as was the case with the previous list, processes are scarcely listed as a source of either KSF or KFF. A report that is often cited36 adds a level of importance (by %) to success factors; these include executive management support (15%), experienced project managers (14%), the clarity of business objectives (14%), standards infrastructures (5%), and formal methodology (5%).
Interestingly enough, “formal methodology” is mentioned, which tends to show that my argument in favor of proper modeling techniques makes sense (as touched on in the previous section on parameters). Without going into too much detail, some scholars list the following: (1) (Plans) meticulous WBS and a clearly defined mission*; (2) (Processes) (nothing listed); (3) (People) client acceptance, client consultation (market analysis), communication, strict personnel selection, and technical competencies; (4) (Power) monitoring and feedback, top management support, and troubleshooting. Some other authors allude in particular to factors that are people related or processes-and-tools related.37 A recent study in the IT sector found that the (internal) KFF that cramp the relationship between the client and the vendor relate to psychological constructs (biases, commitment, morale, and support), structural components (lack or poor definition of contracts, costs, criteria, documentation, expertise, plans, requirements, roles, and responsibilities), and functional components (auditing, change management, communication, customization, development methodology, knowledge transfer, and staffing). These internal vulnerabilities are likely exacerbated by financial instability.38
As the reader can see, the subject of KSF and KFF is quite overwhelming. Let’s try to ground some of the ideas into actual projects.
2.7.1 NSTP (Sydney) versus Environ (Europe) megaproject
A view of public–private megaprojects is provided by Sydney’s Northside Storage Tunnel Project (NSTP) and the Environ megaproject,39 out of which I have extracted what could be called KSF and KFF, as shown in Table 2.11 (again, factors that are marked with an * can be assessed during a prefeasibility study, and again, I classify the themes found in the source article according to the four Ps).
Again, I note that processes receive little blame for failure and little applause for project success. Yet again, it is most likely that it is the interaction between poor planning and Unfits that is to be regarded as the main concern.
Put differently, an articulate plan (Plans) and a positive human input (People and Power) play a fundamental role, even in a preliminary stage of a project. With regard to Power, some authors note that the chances of delivering the project as per the initial specifications are fourfold when directed with advanced managerial techniques, while it increases only by nearly twofold when it only receives top management support.40 This is in line with our previous observation that the type of management resorted to in a project is instrumental: obviously, advanced management techniques (those that tackle POVs effectively when confronted by Unfits) are crucial to the performance of the projects. According to some experts, it is important that employees enjoy the freedom to pose questions while management should have sufficient experience to provide answers.

Dealing with risks, infrastructures, opportunities, and management techniques with respect to the Unfits is a fine balancing act. To any project manager, this will resonate: day in and day out, he has to address risks, check the infrastructures, make sure that his staff performs to the expected level, and reevaluate and capitalize on opportunities.
2.7.2 Summary of KSF and KFF
Table 2.12 summarizes Dominant and Contingency strategies (DS and CS) based on my literature review.41 These strategies (which many authors would call KSF) subdue the influence of POVs.
I make a number of observations:
We have now specified the meaning of Dominant and Contingency strategies (DS + CS) and assume that the items in the lists are functional variables (F), that is, these characteristics are an expression of Dominant and Contingency strategies. They are not all sine qua non conditions, and some of these characteristics work when paired with others (colinearity); for example, Trust and Collaboration probably go hand in hand.
A number of the characteristics can be checked during the prefeasibility study phase (they are marked with an *) but many cannot.
A number of concepts reoccur: Agility, Clarity, Collaboration, Commitment, Communication, Competencies, Control, Culture, Efficacy, Efficiency, Matching, Sharing, savvy Conflict management, and Supportive management. In fact, when we reclassify these terms more tightly we have
a. Plans: Having clarity (transparency) and control.
b. Processes: Showing efficacy and efficiency.
c. People: Being collaborative (including communicating and sharing), committed, competent, and proactive.
d. Power: Being agile, competent (including the use of advanced conflict management techniques), and supportive (including communicating).
We will see how these terms become handy in the sections on Processes, People, and Power (Chapters 4, 5, 6 and 7). I estimate that I have given, in a nutshell, what seems to be KSF in most projects. Successful projects occur when plans are comprehensible and include control mechanisms; when processes display efficacy and efficiency; when people collaborate, have competencies, and adopt a proactive attitude; and when leaders resort to agile management, are competent, and supportive. That sounds about right.
Indeed, Contingency strategies are listed, though without being recognized as a contingency strategy by many authors. Contingency strategies are linked to the establishment of backup plans, contingency plans, crisis response plans, and formal risk management plans. In summary, Contingency strategies are related to risk management.

Table 2.12 Dominant and Contingency strategies There is no reference to robust management, but we can assert that robust management develops when Dominant and Contingency strategies are in action. We have
Robust management = Dominant strategy + Contingency strategy (2.2)
I illustrate my findings in Figure 2.9.
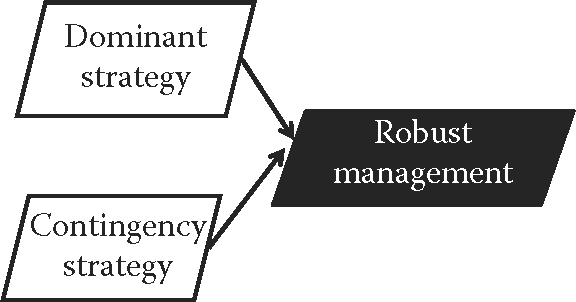
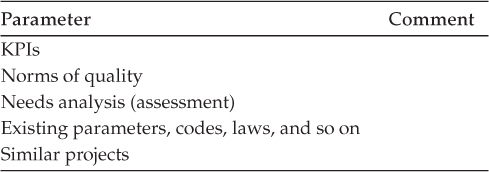
Table 2.13 can be used to assess the frame of so-called KSF in a prefeasibility study.
I pretend that all of these are elements that enhance a project’s strengths and opportunities; hence, I label them as KSF. A KFF would be the dreadful combination of a poor plan and Unfits. However, the reverse of this combination (an excellent plan and controlled Forces of Production, FPc) could not be assumed to lead to success because if these controlled Forces of Production lack the experience and the talent to complete the project, it will probably go nowhere. Similarly, the fact that all stakeholders are in agreement on a project does not guarantee success (many things can go wrong, including some secluded POVs surfacing during implementation); however, divergent interests (surreptitious or not) among the key stakeholders and hidden agendas certainly carve a road to failure (hence, the importance of transparency as we shall see in Chapter 7).

I believe that three of the KFF are
The dreadful combination of poor planning and Unfits (and bad apples)
Divergent interests among stakeholders
Management blindness and overoptimism (see Chapter 7)
As can be judged, these are not at all the opposite of KSF; they stand on their own. If you want to make sure that your project goes amiss, regardless of the KSF listed in Table 2.13, simply stick to the KFF!
2.7.3 Prefeasibility and the Mervel Farm project
In the case of the Mervel Farm project, the local business development center that did the prefeasibility analysis identified the criteria picked to ponder whether public funds would be distributed to the promoters or not, as follows: (1) Plan: a realistic implementation plan; (2) People: existence of contracts with clients or else formal commitments from clients; (3) Processes: pragmatic work breakdown structures; (4) Power: respect of rules and regulations, such as zoning and management’s operation experience.
The local development center deemed that any pitfalls among these criteria would disqualify any proposed project. Other criteria (given the mandate of the government-funded business development center) were also taken into consideration, but to a lesser degree, such as economic diversification, employment creation, integration within the community, matching the funding government’s goals, positive impacts on the City of Pierreville, quality of innovation, sustainability, and value creation.
I devised a model based on my findings as per Figure 2.10 (recall that walls are timely conditions for operations; in this case, criteria for engaging further in the submitted project).

Charts that illustrate the link between prefeasibility and feasibility studies have been offered. One such chart begins with a project idea, followed by an informal plan, a prefeasibility study, which if favorable, then leads to a feasibility study.42 I believe that the initial value proposition summarizes the preliminary steps quite well, before the prefeasibility study gets under way.
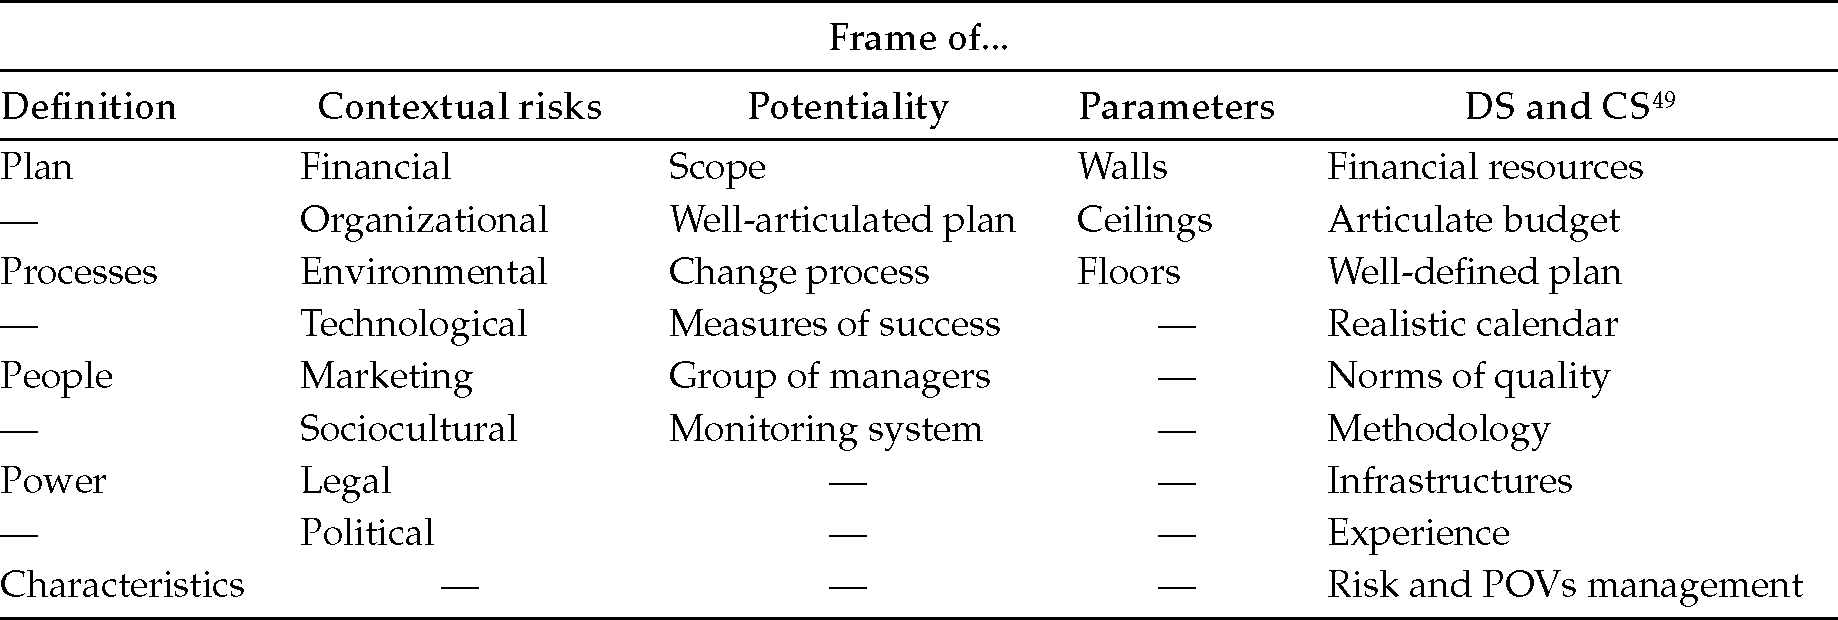
Let us summarize the lessons learned so far by way of Table 2.14 that highlights the most important elements of the five analytical frames.
There may be some redundancy between some of the components of Table 2.14 (e.g., a well-defined plan in both potentiality and DS) but given that each frame attempts to measure the same single project (from different correlated angles), this is deemed acceptable. In this case, it reinforces my argument that proper modeling of the project is critical if the analyst wants to uncover POVs.
2.8 Conclusion to Chapter 2
An analyst doing a prefeasibility analysis is content with taking a broad view of the proposed project.
The analyst bases their judgment on the aforementioned five frames of analysis and can use the prefeasibility template provided in Appendix 2.2. As we shall see, these frames will also be of use in the feasibility study.
The prefeasibility analysis is highly subjective. The expert offers an opinion based on a general impression by seeking relevant information, but without calling into question the minutiae of the proposed project. They are not afraid to look for what can go wrong.

We can summarize what has been learned so far by way of a visual model that does not take into account all of the links that exist between the various concepts, but that simply conveys a general sense of what is happening with respect to the project. We will define, further along in this book, the meaning of the triangle at the center (refer to Figure 2.11).

If we were to analyze the Mervel Farm project in the usual way (without due consideration for POVs), we would probably approve it because it resonates well in terms of revitalizing a core downtown area. However, if we were to look for POVs using our method, we would identify the following potential problems: the absence of an accountant and of a lawyer/notary; a challenging ideology; difficulty in growing farm products; heavy reliance on volunteers; a lack of any defined key performance indicators, or KPIs; a lack of human resources; a lack of tourist attractions; limited use, with summer being the most intensive period; the need for an architect (costly); the need for specific agricultural competencies (costly/hard to find); not enough sales versus costs (high dependence on financing); poor financing; a poor promotional strategy; possibly poor crop profitability; and sales that are done exclusively on site. As for risks, these would include a dependence on the weather, incomplete infrastructures (parking), the need for specific approvals from the National Capital Commission and the City of Pierreville, and possibly adverse reactions from neighbors.
You may think of a prefeasibility study as the act of Caesar and Cleopatra being engaged. They would commit with the best of intentions but they could always withdraw from their promise; although this would be heartbreaking, it would nevertheless be less costly than a quasi-inevitable upcoming nasty divorce. Caesar would lose his investment in the gold ring inlaid with diamonds and rubies, but he would get to keep his furniture, his vessels, and his armies!
Chapter 3 examines the notion of feasibility. I discuss the criteria associated with feasibility study analyses and present the concept of the “triple constraints”.
2.9 What we have learned about POVs: Chapter 2
POVs…
Can appear in any of the eight different contextual risk areas.
May include: An unrealistic and poorly articulated plan, diffuse measures of success, an inadequate change process, incompetent managers, and a lack of safeguards to prevent derailment.
May be uncovered by resorting to qualitative measurements.
May be uncovered through proper modeling.
Exist because people do not think of them, do not wish to admit that they exist, or else ignore them.
Often result from poor planning and an inadequate (if not hostile) workforce.
Can be subdued in a prefeasibility study by checking for: (Plans) access to financial resources, a realistic calendar, a sound budget, detailed resource requirements, the establishment of norms, a well-defined charter, objectives, impacts, and roles; (Processes) a formal methodology, a reliance on solid infrastructures, the use of proven standards and procedures, and the use of proven technology; (Power) adequate control procedures and resorting to experienced project managers.
2.10 Key managerial considerations: Chapter 2
All four Ps must be evaluated in a prefeasibility study.
Avoid poor planning along with the parallel presence of Unfits.
Use all five frames of analysis as a way of shedding light to uncover dark spots.
Aim for a robust strategy.
2.11 Case study Chapter 2: Recycl’Art
Recycl’Art is a venue for exhibiting art made out of recyclable material. The concept originated in a remote village in the province of Québec, Canada. At the end of December 2014, the board of directors met with a new project in mind: to relaunch Recycl’Art in Gatineau, which is a city adjacent to the national capital—Ottawa. Ottawa is a city known all over the world that attracts tourists by the thousands, including on Canada Day, July 1. The cultural core of the City of Ottawa sits within walking distance of its neighbor. Most people wander in the ByWard market to buy local farm produce or to wine and dine, but then cross the bridge to enjoy the numerous parks and outdoor attractions (as well as a casino) that Gatineau has to offer.
A number of challenges awaited the enthusiastic promoters, including (1) ensuring that the event would receive support from the local community, (2) obtaining financing from the City of Gatineau, (3) preparing a five-year plan, and (4) finding a catchy slogan.
The origin of the Recycl’Art Festival dates back to 2004, in Montpellier, Québec. Being in a remote village, it did not attract enough tourists to make the event viable, hence the idea of trying it out with the 500,000 inhabitants that comprise the City of Gatineau. A myriad of visual artists exhibited their art made out of recycled material, which included wood, metal, plastic, rubber, and paper; in short, anything that is found on dump sites or in garbage bins and that can be remodeled to create some figurative or abstract art. One key structure that had people and newspapers talking was the assembly of a totem-like structure composed of scrap laundry and drying machines, which, by its mere height and imposing presence, managed to catch people’s attention while conveying a message against overconsumption. Anything that can serve as a source of inspiration has an appeal to artists or would-be artists, be it nature, urban life, industry, or poetry. The ministry of culture strongly supported the project, for it was in line with its goal of “democratizing” visual arts.
Yet, there was a need to find financial sponsors. These eventually included a local gallery, local universities and high schools, the City of Gatineau of course, the National Capital Commission (Ottawa being just across the river from Gatineau), as well as various businesses.
To top the offer of an outdoor venue where recycled art would be exposed along pathways and park grounds, the promoters examined the idea of hosting specialized exhibitions with international guest artists, creative workshops, guided tours, as well as a sculpture fair.
The initial problem (lack of tourists in the remote village of Montpellier) turned into an opportunity for the City of Gatineau. The project was launched in the summer of 2015, and attracted a vast array of local and foreign tourists.
2.11.1 Appendix A of Case 2: Recycl’Art43

2.11.2 Questions related to Case 2: Recycl’Art
Discuss what need triggered the move to a different region.
Give the list of the key stakeholders and classify them according to the terminology favored in this book (e.g., suppliers).
Discuss how a problem became an opportunity.
Discuss the nature of the opportunity.
Discuss how the board of directors resorted to robust management.
2.12 Appendix 2.1: Assumed KSF or KFF based on a modest literature review44
2.13 Appendix 2.2: Prefeasibility study template
Author:____________________________
Position:___________________________
Date:______________________________
Care of:____________________________
PROJECT
Name of project:__________________________________________
Goal:___________________________________________________
Initial value proposition of a project:__________________________
Calendar: Start:_______________ End:________________________
Estimated cost (US$):______________________________________
Main challenges (norms of quality to be met):___________________
General description:________________________________________
Frames of analysis: (1) frame of definition, (2) contextual frame of risks, (3) frame of potentiality, (4) parametric frame, and (5) KSF and KFF
FRAME OF DEFINITION

Conclusion (is the project well defined?):___________________________________
CONTEXTUAL FRAME OF RISKS

Conclusion:______________________________________________
FRAME OF POTENTIALITY

Conclusion:______________________________________________
PARAMETRIC FRAME
Conclusion:______________________________________________
KSF and KFF (robustness)

Endnotes
- As set by the S and F process elements that we will see in Chapter 4 on Processes.
- Neuvel et al. (2015).
- Deng et al. (2014).
- Modeling will be seen in Chapter 4 on Processes.
- Mesly (2010, 2011, 2013, 2014, 2015a–c).
- We can be more specific and pretend that risks affect mostly time, and that POVs are more intimately related to costs, so that the one constraint that is left as a condition (the “|” sign or “given”) is actually norms of quality. Hence, I would say that risks (as they affect time) are in an inverse relationship with POVs (which imply costs) given norms of quality, as affected by k (which, as a psychological measure, is an expression of perceived threat).
- The [risks (I−) → project] renders in words and symbols what would otherwise be an illustration of the process, without any chances of confusion. When risks increase, it follows that the project’s chances of being successful diminish because there is a negative bond between the two concepts.
- Not in the control of the three promoters and of their company.
- Recall that we estimate the presence of POVs to be in the neighborhood of 4%, so with a 96% feasibility index, the probability is that only the POVs that are due to the “acts of God” persist.
- For the value of 80%, I use the common Pareto number: 20/80.
- del Caño (1992).
- Tardif, P.M. Interviewed April 2016.
- In a nearby similar event, this actually took place a couple of years before.
- Cooke and Tate (2010).
- See also Sterman (2000).
- Curves presented in this book are stylized to simplify drawing.
- Xia and Lee (2005).
- We will discuss the project’s life cycle at length in Chapter 4 on Processes.
- The term “participants” is common when referring to marketing surveys.
- This cannot take place, of course, along the critical path.
- Xia and Lee (2005).
- See also the concept of “organizational process assets” in the PMBOK.
- Schultz et al. (2011, p. 17).
- Most of the time, I use KSF and KFF in the plural form.
- Moderating variables exercise a moderating effect, translated by the symbol (I±). A moderating variable has two types of influences, a positive or a negative one depending on circumstances.
- Bstieler and Hemmert (2010, pp. 485–487).
- Gould and Joyce (2000, p. 150).
- Cleland and King Editors (1988, p. 905). See also Pinto and Mantel (1990, p. 270).
- Items listed marked with an * can be assessed when doing a prefeasibility study.
- This dreadful combination is certainly a negative force being exercised upon the project.
- This is definitely a Key Failure Factor/Fundamental (KFF).
- Yeo and Ren (2009, pp. 282–283).
- In fact, in this list on culture, all elements are internal, so really, they should be considered potential POVs and not risks.
- Chen (2015).
- Martin (2009).
- The 2003 Standish report.
- Joslin and Müller (2015).
- See Liu and Yuliani (2016).
- Van Marrewijk et al. (2008). The Sydney (Australia) North Side Tunnel Project (NSTP) was a 12.4-mile (20 km) tunnel that was part of the 2000 Olympic infrastructure. The Environ project was a large European infrastructure project, a PPP that took place from 1990 to 2006.
- Berssaneti and Carvalho (2015).
- I do not pretend to have the final word on the process elements that ensure success; these may change, I suppose, with the size of the project, its nature as well as with other considerations. This is a first step in identifying Dominant and Contingency positions.
- Farrell (1995).
- Visual material generously provided by Recycl’Art 2015. A special thanks to Gaston Therrien.
- Some of the items appear redundant; I have kept the original terminology used by various authors.
- See Loufrani-Fadida (2008).
- This will be detailed in the KSF/KFF frame.
- At this point, the processes are looked at in general terms. Details will be examined in the feasibility study (Chapter 3).
- This will be detailed in the KSF/KFF frame.
- I now refer to DS and CS instead of KSF and KFF.