
chapter five People (Main constructs)

So it is, said the Wise Eagle, that sometimes Man is an unmanned error of Nature.
Darloz
5.1 Introduction to Chapter 5
We have seen that “People” is part of the four Ps of project management, and in particular of project feasibility analyses. Indeed, interpersonal skills are fundamental in any project.1 Various authors have identified some competencies as being the ability to communicate, to manage stress, to show empathy, and to solve problems. Some authors make a very valuable point that one should scan organizations in search of competing interests;2 they certainly represent a point of vulnerability (POV).
In our discussion, when people are looked at as external agents, I refer to the concept as “sociocultural risks”; when they are examined as an integral part of the project, I recognize their potential for creating vulnerable points. This is especially true when People engage in the transformation process, where I divide them as Forces of Production (FP), which can be controlled (FPc or Fits) or uncontrolled (FPnc or Unfits)—the latter representing the largest potential for fostering POVs. On the outside of the project, People have been classified as clients, suppliers, regulators, and bad apples—the latter representing the highest risk. A deadly combination, as we hinted before, is the mix of poor planning and Unfits (uncontrolled Forces of Production, FPnc), or even worse, poor planning, (uncontrolled Forces of Production, FPnc), and bad apples.
I can express my viewpoint figuratively in Figure 5.1.

Of course, we cannot claim that the utility curve that is hence generated represents a Dominant strategy (DS)—far from it. Figure 5.1 expresses a doom scenario; the present chapter shows how this can be integrated with the U(DS), model we have discussed so far. It expands significantly on the role of people in project management; it digs into psychological phenomena, resorts to the large database that I have accumulated over the years, spans across many more teams of various cultures on two continents, and presents key concepts such as “Trust” and “Collaboration,” which should not be ignored in a feasibility study.
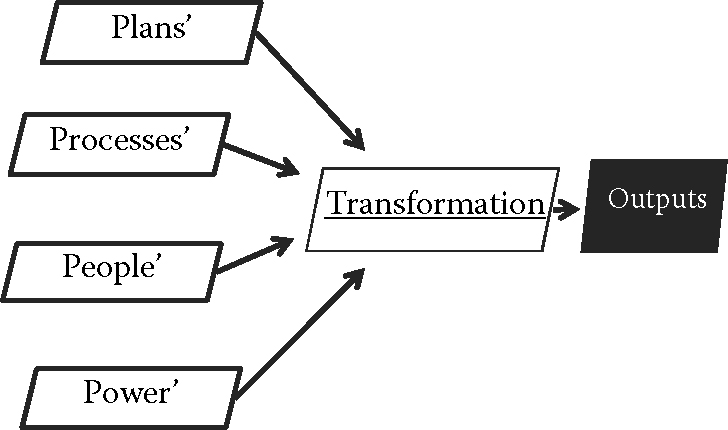
Any project manager will have experienced challenges such as interpersonal rivalries, jealousy, or the situation of a group leader desperately trying to establish legitimacy, for example. I integrate all behaviors into my basic model whereby the four Ps are deemed separate inputs that enter into the transformation phase and then interact with each other, as shown in Figure 5.2.
I pretend, perhaps unlike the core of the Project Management Body of Knowledge (PMBOK), that it is not enough to rely solely on standard human resource management techniques such as human resources management philosophy, individual roles, and job descriptions.3 Human nature is simply more labyrinthine than that! On the other hand, my research has shown that humans adopt certain behavioral patterns that are bound by predetermined values, the constant k being a prime example.
It is at times very difficult, if not nearly impossible, to get people to admit to their mistakes, to conduct interviews, or to distribute surveys that gauge people while they are in the midst of a crisis. In those circumstances, people feel threatened and find any excuse not to participate in the research. I have been fortunate enough to witness situations whereby outright or abstruse problems plagued a particular project. I have seen POVs in action. The present chapter reports some of my findings.
5.2 Persons
The PMBOK covers general human behaviors from a very technical point of view and on the surface only. I endeavor to do more. The various PMBOKs4 provide an overview of stakeholders that are in some way involved in projects. These are the project promoter; the project leader; the management team, the team, and other stakeholders. The categorization favored by PMBOK is different from mine, and in fact, perhaps not as systematic.
The four groups that I have identified on the outside of the project can be classified according to their degree of unpredictability (of risk). Going from lower to higher risks, we have
- Regulators (government, professional associations, etc.);
- Suppliers (e.g., investors, partners, contractors);
- Clients;
- Bad apples (e.g., unethical pressure groups, illegal groups, etc.).
Bad apples are those that act and react under the radar, so to speak; they are on the margin of legality or, in some cases, they are bluntly illegal. However, one must be careful because the definition of bad apples depends on the politico-legal system that tolerates or bans them. In a dictatorship-like company, as can still be found in many parts of the world (some of which I have visited and seen in action), an individual who simply expresses their opinion and is a bit disgruntled may be treated as a bad apple. However, the external groups that benefited illegally from the Montréal Olympic Stadium (MOS) project can be labeled bad apples. In many parts of the world, collusion and abuse of funds generously provided by international organizations are still very much present and are truly risk factors; those who use these techniques are bad apples. Some bad apples may have at times a beneficial influence, however; for example, environmental groups who force a company to respect a natural habitat or else to preserve the way of life of some of the tribes in the remote Amazonian forest may actually help to put the project back on a normal humanity-oriented track. They remain, however, highly unpredictable and hence, from a project management point of view, are risk factors.
According to the PMBOK, the influence of the various stakeholders during the project life cycle diminishes with time, being relatively steady at first, but then retreating substantially midway through the deployment stage. Let’s assume that this applies to external groups, that is, to sociocultural forces. Indeed, as the project nears completion, there are fewer reasons to object to it, disrupt it, or wish its discomfiture; in any case, the full responsibility of many projects is transferred to their owners or to their buyers. Hence, from a managerial point of view, risks vanish with time.
We can use the example of the music concert discussed in Chapters 1 and 3 to list the different stakeholders, as shown in Table 5.1.
| External (risks) | Potential POVs | ||
|---|---|---|---|
| Clients | Regulator | Bad apples | Forces of production |
| Music lovers | SOCAN | A competitor who plans to disrupt the concert | Musicians |
| Media | License (alcohol) | Media that have a biased, negative view of the concert | Musical director |
Of course, these actors intervene at different moments during the project’s life cycle (shown in Table 5.2).
Tables 5.1 and 5.2 are only given to illustrate the role of external and internal People and to show that People, in all forms as we have described them, cannot be omitted from a feasibility study. I derive the fourth law of project feasibility as follows:

5.2.1 Fourth law of project feasibility: Law on the Forces of Production
With respect to POVs, the more Unfits (FPnc) > Fits (FPc), the more the probability of failure increases.
Let’s put ourselves in a project environment where countless pressures are exercised upon us from the outside (political changes and upheavals, pressure groups, unhappy investors, etc.). At the same time, the workforce starts a strike while acts of sabotage multiply. As the deadline for project completion nears, managers (FPc) are under more and more pressure to handle and control the situation. However, the more they try to deal with the increasing amount of grief, the more time elapses and the more the negative forces (e.g., employees on strike) feel empowered. The situation becomes desperate; disintegration is fast approaching.
Note here that I do not refer to the probability of success, but merely to the probability of failure. This distinction is important. Having excellent controlled Forces of Production, FPc, is not a guarantee for success—external risks could be overwhelming and disrupt the project. However, having more Unfits (uncontrollable FP) than Fits (controlled FP) leads to a high probability of disruption—this is undoubtedly a failure ‘factor’. This is an example of the difference between Key Success Factors (KSF) and Key Failure Factors (KFF), which we have discussed in Chapter 2.
A feasibility study should investigate the role of People in a given project ahead of time; relying on an analysis of curriculum vitae to evaluate core technical competencies is far from enough. Recall that we are chasing POVs just as some meteorologists are chasing hurricanes.
5.3 Observables and modeling psychological constructs
One way for the project feasibility analyst to gather valuable information is to observe. Many experts that I know and whose work it is to decide whether government funds should be granted to a particular project or not explicitly say that they rarely rely solely on written documents and on the application forms they receive. It is when meeting with the project promoter, when visiting his office or plant, or when talking with some suppliers and customers of his/hers that they feel they get the true picture. It has been said:
Years of experience have taught me to detect possibilities of failure, which I can often judge by testing the trust level that exists between the key stakeholders, including us, the funders. We check the curriculum of the applicant, his credit and criminal (if any) background, past bankruptcies and verify whether the project is overly optimistic. We look for camouflaged details or motivations by way of the documentation, interviews and visits to the facilities.5
A large portion of this effort relies on observation. What the feasibility analyst does is collect so-called observables that, when analyzed, guide his/her decision. Observables are parameters as they generally apply to human behavior (but also to objects). An observable is by definition a change or a movement; for example, the person being observed has an abrupt gesture when challenged on the financial data he/she puts forth, or else he/she claims loudly that they can conquer the world in an instant with what they believe is a revolutionary idea. Observables are not chosen lightly. Just like metrics in processes are precisely set (e.g., the humidity level surrounding a cardboard-producing line), observables need to measure what the analyst is intending to evaluate, that is, the related construct. Appendix 5.1 offers the reader a review of some 100 scientific articles taken from various sources related to project management. The constructs that come out most often are Trust and Collaboration, with a whopping 60% share of the discussion compared with other psychological constructs.

Observables fall into a general spectrum (habitually, happy people laugh or smile) or into a contextual framework (e.g., according to Japanese tradition, one doesn’t shake hands but bow). All observables are a reflection of what is going on inside the participant’s mind; they are truly functional, but because they are a parameter, they are represented graphically by a rectangle, as shown in Figure 5.3.

When it comes down to deciding on a psychological construct such as Trust, at least three observables are necessary. Some authors mention that “(…) at least four measures of a construct are needed for an assessment,”6 but I contend that this causes more difficulties than it solves problems. This is why: Should the feasibility analyst find two observables that describe a behavior in a certain way—say, two behavioral patterns that suggest anger, and two in an opposite way, say, patterns that indicate happiness—he/she will not be able to reach a conclusion. An odd number of observables will do the trick. As a rule of thumb, psychological observables come in multiples of three just like judges, in a boxing match, amount to three, so that no decision deadlock situation occurs.
When too many observables are garnered as a result of observations made by the feasibility analyst regarding the behaviors of People—whether external or internal—there are four ways of reducing the complexity of the situation.
First, a term commonly used by those being observed in their day-to-day operation may turn out to regroup behaviors that seem otherwise disparate. In my many interviews conducted with project participants, I found that the term ‘win-win’ was extensively mentioned and that it could include such psychological constructs as Fairness and mental games. I thus summarized all the different names under one simple construct: Fairness. A project leader told us that
As a project manager, I endeavor to respect knowledge, ideas and experience team members bring in. Each team member has a voice on each of the ten projects that I head concurrently. Managers, lead trades people and trades people are assembled according to the project needs and bond based on fairness. This is how we work here, and our company keeps growing.7
Second, the analyst must decide if some observables are worth keeping or else if he/she should delete them after due consideration. Third, the analyst can find an existing model in which he/she can make them fit (e.g., the AIDA model—Attention, Interest, Desire, and Action). Lastly, he/she can divide their main construct—say, Trust—into subconstructs (such as Affinities, Benevolence, Abilities, and Integrity as we shall see) and elect at least three observables to each subconstruct. To facilitate this effort, I provide in Appendix 5.2 a questionnaire that gauges the key psychological constructs often discussed when interviewing project managers or project team members by way of surveys or face-to-face meetings.8
It must be noted that constructs are the equivalent of process elements found in process modeling and that exactly the same types of descriptive (S and F) and consequent arrows exist (T, C, and I—including mediators and moderators).9 In the case of causal bonds, however, the burden of proof is much heavier with psychological phenomena than with the laws of nature that apply to different processes (such as water boiling given enough heat and a certain atmospheric pressure).10 Many authors have recognized over the decades that causality in the psychological domain is most difficult to prove.11
I strongly recommend that the feasibility analyst collect information from various sources, not merely from the documents handed in by the project’s promoter. Some authors12 point to the fact that the use of a single source of information reduces the confirmatory power of analyses and could lead to systematic or random errors—something we want to avoid. Even relying on a single expert to judge the feasibility of a project is shaky; one cannot possibly be an expert in all domains. It has been stated, along those lines that “(…) obtaining data from multiple informants has been recommended as superior to such an approach.”13 Observables should produce data that are exhaustive (near or at saturation), discriminatory (that are pertinent and nonredundant), and cohesive.
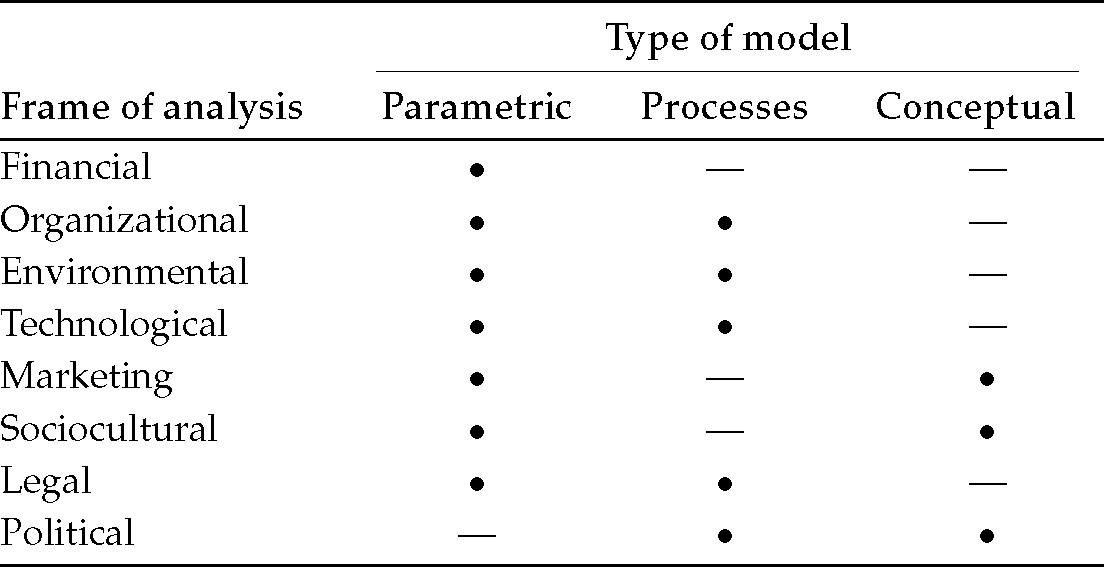
To be more precise with respect to modeling, there are actually three ways of generating models. This can be done according to
- Numbers, as in the case of financial models (parametric models using tables and rectangles)
- Processes; as we have seen in the previous chapter, using parallelograms and arrows
- Concepts, using bubbles and arrows
All three forms of modeling can work in tandem. In fact, I do not consider a feasibility analysis to be complete unless all three approaches have been used. Most often, as previously indicated, it is the People side of a project that is lacking (the psychological or sociocultural modeling) in feasibility studies. In the end, it is the most important one, given that POVs are to be detected and dealt with by People. Table 5.3 offers a view of the three modeling efforts that I deem essential.
| Type | Code | Type of analysis |
|---|---|---|
| Parametric | Tables and rectangles | Data |
| Processes | Parallelograms and arrows | Machine |
| Conceptual | Bubbles and arrows | Human |
The various risks we have identified in Chapter 2 can be better evaluated using the modeling techniques shown in Table 5.4.
All these modeling techniques should serve to identify causality as best as possible, that is, to assess the critical chains that exist between data, between parallelograms, between bubbles, or between any of these three angles of analysis. As mentioned, this is important because it helps in identifying POVs. The level of causality will partly determine the level of vulnerability. Let us take, for example, an F1 driver. Assume his/her project, so to speak, is to make it to the finish line of the Monaco Grand Prix and rank in the top three drivers. To do so, his/her car must be filled with gasoline. No gasoline means that the car sits idle on the starting grid. Hence, the procedure to feed gasoline ahead of time into the car speaks of a point of vulnerability on two fronts: (1) gasoline allows the car to move and (2) the driver cannot even hope to win without gasoline in his/her car. If the left mirror breaks due to a benign collision during the race, this will lead to seconds being wasted when checking the oncoming competitors, but it may not compromise his chances of attaining a top position. That particular point of vulnerability has a null value. In a feasibility study, the analyst must understand the major tasks that are to be performed, identify the nature of their linkages (as per the four scenarios: S and F, T, I, and C), and decide which are critical to the success of the project, both in terms of processes and in terms of psychological efforts. Once this is done, they can highlight POVs. If, as a purely hypothetical example, it were possible for the F1 driver to repair his/her mirror during a six-second pit stop, then this would be a corrective measure that would alleviate the problem. Hence, it can be said that points of vulnerability augment in function of
- The strength of the causal links that tie different activities together during the transformation phase
- The value of these activities to the successful completion of the project
- The capacity to implement corrective measures should things go awry
These three options imply some psychological inputs, that is, the presence and action of people.
5.4 Teams
PMBOK 5 often refers to teams as groups. Teams are formed by individuals, of course, each with their own way of interpreting and acting upon psychological constructs such as Trust and Collaboration. Teams (and more generally stakeholders) have been defined in various ways:14 people whom the organization (the project) depends on; people who have an interest in the organization; people who can have an impact on the organization; people who bring necessary15 skills and resources to the organization; people who produce value for the organization; as well as people characterized by power (capacity to get others to do what needs to be done), legitimacy (perception held that the behavior is desirable and appropriate), and a sense of urgency (or “criticality”). In short, we could state that teams maintain a symbiotic relationship with the project organization, whereby each one provides resources in order to achieve a value-creation goal that serves (in the best of scenarios) their mutual interests.16
More precisely, stakeholders (not only team members) have been defined17 as people making and/or being affected by decisions as well as performing project-related activities. The PMBOK18 states that “project stakeholders are individuals, groups, or organizations who may affect, be affected by, or perceive themselves to be affected by a decision, activity, or outcome of a project.”
Team members are bound by all four types of links that exist between processes and between constructs: S and F, I, as well as T and C. That is, team members can be described by their structural variables (e.g., their competencies) and by their functional variables (what tasks they perform), by how they change with time (e.g., promotion), by how they influence each other (directly, indirectly), and by how one member exercises so much power that they could force a behavior onto another team member (causal), whether by means of authority, charisma, or other characteristics. This can make for a very complex system by itself; in typical process modeling, only one type of bond links two parallelograms, yet at first glance, it looks like all four bonds can exist between two team members. This is true; I will provide a model in Figures 5.4 and 5.5 that results from years of research in the field and that simplifies this state of affairs in a very logical way. Complexity must be acknowledged; indeed, there is an exponential demand for elaborate, global projects that requires specialized knowledge.19
Groups vary and evolve over the course of a project’s life cycle.20 The start-up group is active, of course, during the planning stage: it is responsible for preparing the project charter. As the name indicates, the planning group is mostly preoccupied with the planning stage. The execution group looks after mobilizing the resources, Forces, and Means of Production. It expends a variety of efforts: among many other tasks, it looks after corrective measures, information flows, plan modifications, and Work Breakdown Structures (WBS). It is by far the busiest of all the groups. By comparison, the surveillance group does not accomplish as many tasks; it spreads its efforts equally along the five stages of transformation. It approves the changes and proposed corrective measures, makes recommendations, prepares forecasts, produces follow-up reports, updates the plan when necessary, and verifies the deliverables. Finally, the control group (which can be the same as the start-up group as it has been inactive since the mobilization and deployment stages) makes sure that the outputs are completed; including the deliverables, the realization of the BOK, and the measurement of impacts.
This goes to show that team efforts during the project are unequal, which implies another set of complexities. From a processing point of view, tasks have to be lined up in an efficient way; from a psychological point of view, collaboration is incremental.
It must be noted that People on the inside (Forces of Production, FP) are inevitably in touch, directly or indirectly at times, with People on the outside (clients, suppliers, regulators, and even bad apples). This raises the level of complexity one notch. Indeed, a feasibility analysis cannot escape the requirement to look into the work culture (psychodynamics) of projects.21
A project’s work culture (psychodynamics—PWP) refers to the psychological processes that are implied when dealing with projects given the triple constraints, and which are guarded by a particular work ethic.22 It is useless to examine psychological constructs that do not specifically relate to the work implied in the realization of a project, such as, say, attachment. It is also pointless not to frame a construct such as Trust within the parameters of a particular work ethic: one that emphasizes discipline and rigor, for example, ought to command trust toward other team members.
From this perspective, the feasibility analyst does not merely wish to determine how people that participate in projects are going to aim for the same goal, to commit to their tasks, to trust each other, and to work together. He/she is rather keenly interested in identifying the work culture (psychodynamics) of projects, that is, how people assume their robust (Dominant and Contingency) and Short strategies. While I have provided the reader with some clues as to how to go about measuring Dominant, Contingency, and Short strategies (see the introductory chapter), there are also measurements that can be thought of for evaluating a project’s work culture (psychodynamics). Appendix 5.2 offers one way of going about it, which can be adapted according to the analyst’s needs. To give the reader a more concrete example, work psychodynamics can be illustrated by looking at people’s general beliefs concerning the Germans: they are seen to work diligently, with discipline, and in conjunction with their coworkers. This contrasts with cultures where respect for time (calendar), rules, and procedures is deficient altogether. Poor psychodynamics contains the germs of failure.
5.4.1 Contemporary teams
The previous comment takes on a more powerful sense when realizing that contemporary teams are increasingly multidisciplinary, multicultural, and dispersed, relying more than ever on remote communication tools. An example of multidisciplinarity is the first heart implant: the device itself required expertise in battery, epoxy, silicone materials, simulators, surgical techniques, and transistors to name just these elements.
These three features of contemporary teams may signify a lack of synergy, encourage the appearance of dead spots within or between the stages of the project, and foster gaps and ambiguities,23 all of which are fertile ground for POVs.
5.4.2 Small teams
To think that people are not conscious of their own vulnerabilities may be shortsighted. Many times indeed, people feel threatened by a newcomer, by someone who is more active or who seems to know more than them. Their routine is challenged and a sense of discomfort is induced, unwillingly and at times unbeknownst to the newcomer.
At the same time, as some authors comment, “people trust others, even when there is no guarantee that the trustee will respond benevolently.”24 The settings of projects whereby small teams are created and members are brought together in order to achieve a common goal calls for both trust in others and trust in oneself. This means accepting that one’s own vulnerabilities do not impede on the project’s success.
Interestingly enough, people are more prompt to trust when money is part of the equation: after all, management and team members (Forces of Production) are paid to accomplish certain tasks with the understanding that they must rely on others to fulfill them. However, even the scent of money has an emotional component;25 psychodynamic forces such as trust and distrust are at play and influence decision-making, for example, when the time comes to collaborate with others in a small team environment26 or under stressful conditions.27 In fact, team members may put aside the best interests of the project in favor of noneconomic, socioemotional objectives such as nurturing an exaggerated sense of acceptance on the part of others28 or holding a grudge.
The emotional side of decision-making is at rest when the environment is predictable and safe, such as is the case with functional small teams; indeed, the human brain seeks regularity even amid troubled times and limited information.29
Cohesive small teams present a number of advantages. First, they form a “bundle of resources, skills, and capabilities.”30 This allows for a faster response time in the case of adversity (when Short strategies are needed). Second, they generally offer excellent utilitarian value because efforts are not wasted: what one does is promptly checked by what the other person does. There is little room for escape, for free riding31, or for other forms of abuse.32 Thirdly, trust is often a given in a small team environment; this generates a higher propensity for commitment toward the project. Indeed, when it comes to financial decisions, for example, studies show that people invest money more readily in companies that they feel they share common interests with, than in other companies.33 Finally, small teams encourage the building of powerful bonds: people simply relate more strongly to other human beings than to organizations.34
However, small teams also have downsides, some of which are well documented. These include a potentially dysfunctional ability to operate due to the tightness of bonds between team members, tunnel vision, and even egoistic interests, thus leading to inconsistent performance. In particular, the comfort that small teams provide prevents members from examining original solutions (diagonal processes) to particular concerns, especially those offered by external advisors, or to admit to mistakes.35
Overall, it can be observed that there are upsides and downsides with respect to small teams. Often, a project is composed of a handful of key people; the Québec Multifunctional Amphitheatre (QMA), for example, was managed by a team of six people only, even though it was a 400 million dollar undertaking. The feasibility analyst may be well guided to seek information on such core teams if at all doable. Elements that may be taken into account include the absence of malevolent intentions; an impetus for win-win situations; a history of working together on other projects; a proven ability to learn and to collaborate; a sense of attachment to the team due to common ambitions, desires, interests, and/or tastes; high levels of integrity; and the manager’s personality. These are intrinsic behavioral components that cannot be assessed by merely looking at a curriculum; instead, observation and background inquiry may adduce reasonable information to the analyst.
One can guess that the Unfits (uncontrolled Forces of Production, FPnc) fall short on one or every one of those characteristics. For example, they will not be able or willing to collaborate, they will act selfishly, or they will lack integrity. Detecting malevolent intentions—a prime source of team vulnerability—is a hard chore, yet hidden agendas36 infest many projects. Unfortunately, even honest people may at times fall for potential ulterior, negative motives37 because of stress factors or due to the influence of others. I will discuss corruption in more detail in Chapter 7, dedicated to Power.
5.5 A model of interpersonal competencies
As the reader can sense, there are a limited number of key psychological constructs that come into play in any project, especially when People become People′ during the transformation phase, that is, when all People interact with each other38 to produce the deliverables. These constructs are Control, Transparency, Trust, Fairness, Collaboration, and Commitment. Other constructs are permutations of these core constructs, such as Dependence and Distance.39 Table 5.5 gives a succinct summary of the main themes found in a representative sample of scientific articles addressing project management.
I have conducted a large number of studies, both by examining current and past literature and by surveying and interviewing over a thousand participants.40 This effort has allowed me to propose a model that has been published many times over and which I present in the following sections.

Various authors recognize the importance of competencies41 and have had their opinions on core competencies with respect to projects; they probably all have valid points. For decades, many others have conjured that competencies are what makes an enterprise competitive.42 Some scholars43 identify the following competencies: the ability to establish and to maintain appropriate contacts within and outside of the organization; the ability to tolerate ambiguity, that is, to function effectively when facing risks; the ability to train, to direct, and to motivate colleagues and subordinates; the ability to negotiate and to resolve conflicts; the capacity to identify the concerns of others; the capacity to take a broad view of the priorities and the project itself; leadership by way of the ability to bring together stakeholders and form effective working groups, as well as by way of defining and delegating responsibilities; and finally, by showing personal enthusiasm. PMBOK 5 (pp. 53–54) proposes that “decision-making (and…) trust building” are skills indeed.
I’d like to think that our six core competencies model offers a useful and workable summary of the different interpersonal competencies that various authors and field experts have acknowledged over years of research and experience. I believe it may assist in the hiring process, for example, and even speed it up.44 The six core competencies model appears in Figure 5.4.
The model reads as follows: project managers must balance their Control of the project with a sense of Transparency, which is defined as the sharing of useful information with others to facilitate their work and fire up their motivation. This balancing act between Control and Transparency has a positive influence on the team’s willingness to Trust each other (I+). Enhanced Trust helps build a spirit of collaboration that develops with time (T). This link between Trust and Collaboration is influenced by a Distance factor (I±) that can play for or against the project: for some team members, physical distance is a way of avoiding being constantly interrupted, thus improving performance, while for others, it is a means of delaying the completion of preset project tasks. A sense of Fairness within the team and with management strengthens the spirit of Collaboration (I+, I+). As team members and more generally stakeholders learn to Trust each other and to work together, this encourages them to commit more and more to the project over time45 (T). Commitment thus serves as a manifestation of an intrinsic motivation, which many authors recognize as a mandatory element of team building and project success.46 The consequence of this process is a behavioral adherence to the project (C+) within its three critical axes: time, costs, and norms of quality. There is a feedback loop (t) that departs from the Commitment construct and ends at the construct ‘Control/Transparency’.47 This corresponds to research by some authors48 who have noticed that lack of commitment reduces the capacity to build relationships among team members. Some experts rightfully comment that “The involvement of stakeholders from all levels both within and outside the organization within the framework of the communication ecosystem is required to make the project successful.”49,50 Says one project leader:
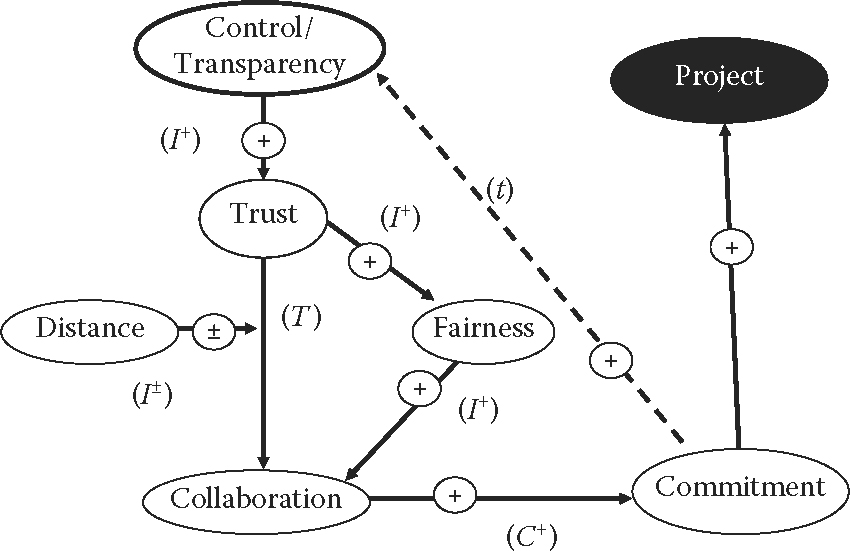
People like to have a good career and to work for a company where there is a future and a sense of leadership. People like to see a company building its own future. This spawns a lot of self-confidence. When our team members see growth, they are inclined to jump in and to embrace challenges.51
Note that the model I have presented will vary somewhat depending on the group that is being analyzed (as I demonstrate further on). This is normal; a model is a simplification of reality and is not meant to represent all conceivable real-life situations.
According to my model, the project manager displays three core competencies: (1) the capacity to exercise control; (2) the willingness to be reasonably transparent (e.g., by sharing critical information with staff when needed); and (3) the ability to be fair. Indeed, most people long for reciprocity and fairness in the way they are treated.52 Of note, a sense of Fairness works hand in hand with Trust53 and Collaboration.
Ideally, staff have the following interpersonal competencies: they are (1) trustworthy and self-confident, (2) willing and able to collaborate, and (3) committed.
I would venture to say that managers and staff that present such well-focused characteristics could surmount many obstacles and achieve a substantial amount of work. Together, these six competencies that can be shared between managers and staff instead of existing in silos between the two groups, imply a sound work culture (psychodynamic). Faithful employees are likely to complete their tasks, to show up on time, and to take pride in their work, all of which can be observables that reveal the existence of the construct of Commitment. I conducted hundreds of structural equation modeling (SEM) analyses to arrive at this model and I feel confident it can be of use to feasibility analysts.
Going back to Table 2.13 from Chapter 2, one can recognize that the six core competencies model is in line with past findings on Dominant strategies (refer to Table 5.6).
What my six core competencies model does is simply highlight the key competencies and their dynamic relationships, rather than listing them in a passive way. Another conceivable representation of the model is shown in Figure 5.5.54
The maximization of the utility of the Dominant strategy is achieved, in terms of work psychodynamics, by the optimization of the ratio Control/Transparency, and of Trust, Fairness, Collaboration, and Commitment. This makes intuitive sense. Unfits (uncontrolled Forces of Production) and bad apples (people who often act at the limit of legality or else who act illegally) will generate distrust, and will cause delays and additional costs, and/or product defects (g-spreads). As delays, costs, and defects mount, distrust grows tremendously. As the situation worsens, the probability of failure inflates. I bet that each one of us has experienced a similar dynamic in a given project or work environment. This seems to reflect what happens in the “real world.”


We now turn our attention to improve our understanding of some of the individual psychological constructs contained in the six core competencies model.
5.6 Trust
Outside risks twined with an inherent tendency to feel vulnerable results in being less trustful of others. Trust is intimately tied to vulnerability; when I discussed this in terms of People in our four Ps model, we saw that this means that Trust and POVs go hand in hand. Multiple studies have defined Trust as the willingness or tendency to be vulnerable in the belief that the vis-à-vis (the person facing us, such as a team member) is well intentioned.55 To that point, some authors have linked trust to vulnerability as follows:
The definition of trust proposed in this research is the willingness of a party to be vulnerable to the actions of another party based on the expectation that the other will perform a particular action important to the trustor, irrespective of the ability to monitor or control that other party.56
For their part, other scholars state the following: “In our analysis, we define trust in terms of confident, positive expectations regarding another’s conduct, and distrust in terms of confident negative expectations regarding another’s conduct.”57 Some project leaders have said: “Projects drive trust, not the reverse.”58 Some others comment as follows:
We like to make team members part of the decision process. We display a high level of flexibility. In this region of Clare (Nova Scotia, Canada), most of the population is French-speaking; many have been ordered to go to English schools as children, and were at some point in history segregated against, and even thrown out of stores for speaking French. Most Anglophones have not had the opportunity to learn French. Yet, we all communicate and understand each other despite the language differences; nobody is left out. This is the making of a great work team.59
Some authors60 have dug into various sources, including documents from the United Nations, and stipulate that vulnerability refers to an inability (rather than a lack of willingness) to protect oneself or else refers to a susceptibility, incapacity, or even defenselessness when facing stressful events or pressures that can cause harm or generate a loss, whether emotional, material, physical, or social. Various scholars61 elaborate on so-called affect-based trust whereby affect is an integral part of human behavior;62 yet, other authors expand on so-called cognitive trust (trust based not on emotion but on reasoning).
Through my multiple studies, I have identified four structural sub-constructs of Trust, which are Affinity (or how closely team members fit with each other), Benevolence (how team members actually care for each other),63 Ability (technical competencies characteristic of each team member), and Integrity.64, 65 and 66 Figure 5.6 illustrates the psychological construct of Trust.
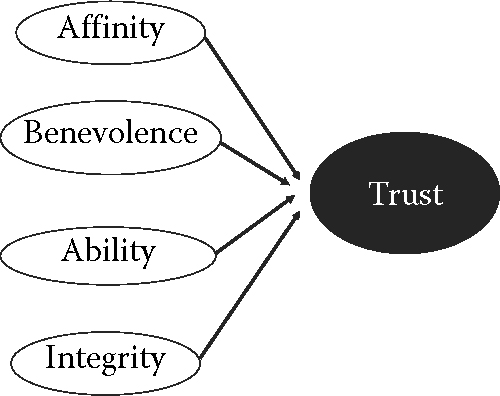
The trick for the feasibility analyst is to measure Affinities, Benevolence, Abilities, and Integrity, and do this ahead of time. In most instances, this is not feasible, because trust is always directed toward someone (oneself or, in this case, others), so that the analyst would need to have seen the team members in action before he could commit to giving his opinion about the underlying work psychodynamics. Often, the best that they can do is to authenticate the curriculum of the candidates, check their backgrounds, distribute some psychometric tests, and guess. This opens a wide door for POVs to root themselves in a team setup. Thus, it is most advisable to prepare accordingly by way of thorough job description and superior human resource management techniques. If anything, any signs of social dysfunction, of egoistic tendencies, of shortages of skills, and of dishonesty indicate a real or latent Unfit (uncontrolled Force of Production, FPnc)—these must be dealt with before the project is launched.
My various studies have shown that Trust can be posted, in terms of behavioral patterns, on a scale that goes from Blind trust to aggression.67,68 This is what I call the barometer of Trust (refer to Table 5.7).
As can be guessed, with lagging levels of Trust come an increasing number and higher salience of POVs. Note that Blind trust is just as dangerous as predatory behaviors (e.g., the likes of financial predation—recall the U.S. predatory mortgages of 2006–2008). I discuss this in the section on blind trust. Essentially, the ideal zone is the one of conditional trust: here, team members trust each other without falling into excesses while maintaining control over their feelings.

5.7 Pretrust
I conducted various longitudinal studies in line with my core model and found that Trust exists on the condition of some predisposition to Trust, or, put differently, to some level of Pretrust. This corresponds to observations made by some scholars, who state: “Successful behavioral exchanges are accompanied by positive moods and emotions, which help to cement the experience of trust and set the scene for the continuing exchange and building of greater trust.”69 One of my studies consisted of four small groups, which were measured longitudinally, at time0 and at time1. I provide some of the main results I obtained in the following subsections. Results were computed once the questionnaires were filled, before (time0) and after (time1), the completion of the project’s tasks was by groups of approximately 20 individuals each. I acknowledge that the overall sample is too small to reach firm conclusions; the results are part of an exploratory effort.
5.7.1 Regression analysis
In Table 5.8, I combine the results of time0 and time1 for a four-person team’s psychodynamics study that I performed a couple of years ago in order to get a larger sample.
A number of observations can be made with respect to the data I obtained looking at both time0 and time1 results taken individually or amalgamated (as per the graphs in Table 5.8). First, there is an initial endowment of Trust, which I call ‘Pretrust’. Second, there is a strong correlation between Trust and Collaboration for both time0 and time1, and of course, for time0 and time1 combined. Third, the regression line forms a near perfect ‘football’ shape, which is a good indicator of a normally behaving population.2 Fourth, there is a significant improvement in the correlation coefficient (Pearson coefficient or R2) from time0 to time1 (Group 1: 0.615 to 0.713: +19%; Group 3: 0.652 to 0.825: +27%; Group 4: 0.549 to 0.796: +45%) except for Group 2 (0.890 to 0.796: −11%). For the team members, this means that working together over time has fortified the correlation between Trust and Collaboration: in other words, team members became more trusting of each other and collaborated more as time passed. Indeed, trust takes time to build (T). This is in line with past findings.71 This observation reinforces the comment made by some authors72 who notice that for any team, trust-damaging occurrences generally weigh more heavily than positive events; this explains the difficulty of building and maintaining effective teams.

Another observation is that the correlation coefficient meets that of previous similar studies performed in suppliers–clients’ contexts.73 A mega-study indicated that 90% of all studies that were examined confirmed the bond Trust => Collaboration.74,75
5.7.2 Factorial analysis on apprehension
Throughout this chapter, I will perform a number of statistical analyses,76 including factorial ones, as they are considered a key measure in a psychological investigation.77 I use a varimax rotation with 25 iterations on all constructs except where indicated. For all research I did, except where specified, I resorted to the psychological construct of Apprehension78: in my view, it is formed by the ratio of a ‘Defensive position’ (one’s sense of vulnerability—labeled as ‘DP’) over an ‘Instrumentally hostile position’ (one’s ability to attack—labeled as ‘IP’). Apprehension is not the opposite of Trust: Trust is an emotional time-building experience, whereas Apprehension is a momentary perception of present dangers. Apprehension does not encourage Trust, of course. Figuratively, one can view Apprehension as the ratio between a lonely sheep position and a hungry tiger position. Most likely, the more one feels like a lonely sheep when facing a hungry tiger, the more apprehension builds up. Apprehension is defined in this book as the sense that an individual has that he/she may be the target of the action of others, especially of their negative intentions. In the present book, the human threat itself is the act of taking advantage of another person’s vulnerability for one’s own benefit, causing the other harm (e.g., loss), by surprise.
My definition of Apprehension differs from that given by other authors on the subject, or on the subject of a perceived threat. For example, some scholars see a perceived threat as being caused by a trigger (and maybe by a hungry tiger as well!). This generates emotions, which then influence the individual in his attempt to avoid the source of said perceived threat, which then leads to an increased perceived threat when escape is not possible.79
Note that my focus is on the internal mechanism of Apprehension for which it is the ratio of Defensive over Hostile positions that counts, and whereby the surprise element cannot be ignored. Indeed, in wildlife (including in universities!), a perceived threat is all about the creatures assessing their vulnerabilities when facing danger and ensuring that they are not caught by surprise, hence their heightened level of vigilance. “Lonely sheep versus hungry tiger” is the title of that movie!
Various authors propose their own models, with one in particular that suggests that Apprehension (perceived threat) is a force to contend with when discussing human behaviors.80 The latter estimates that risk perception is skewed by information (e.g., quality of feedback), personal (e.g., education, experience, and proclivity to assess the risks), the project (e.g., availability of alternatives), and indirectly by organizational factors (e.g., slack resources). Risk perception would then lead to allegiance to the project. This model emphasizes the role of perception as a focal point where various elements play a role. With reference to so-called personal factors, other authors81 recognize that they influence a project outcome. We can generalize by stating that the perception of risks and POVs has an impact on a project’s outcome. To be more precise, it is the perception (and not the reality) that People have about risks and their own vulnerabilities that influences their behaviors and that dictates the levels of trust and collaboration that they are willing to allocate to a team.
In particular, the construct of Apprehension expresses how a team member feels when management drives the project with exaggerated control or not enough transparency:82 the two constructs (Control and Transparency) are intimately linked with one pertaining to the psychological aspect of projects (Apprehension or the ratio of Defensive/Hostile positions. Apprehension is organized around a feeling of fear—fear of others, fear that the project may go astray, and so forth—with fear being the sentiment that accompanies a sense of vulnerability. Thus, Apprehension is, from a psychological perspective, an internalization of personal POVs and their accompanying urgent need for a response; failing that, the integrity of the individual will dissolve (C+). From a work psychodynamics perspective, a Dominant strategy takes place when the project team member or manager arrives at an appropriate ratio of Hostile/Defensive positions (the reverse of Defensive/Hostile positions), which I have found to be the constant value of k = 1.3 as I will show as I progress through this chapter. Note that the constant k is found given some small variances in each of the teams that I approached, and that passed two completely different questionnaires that tested for the construct of Apprehension. For the sample just discussed, I obtained the results shown in Table 5.9 when running the factorial analysis; two subgroups (A and B) were created, which stand in sharp contrast, from a behavioral point of view.

If we round up the numbers (to the nearest of 0 or 1) to get a clearer view, we obtain Table 5.10.
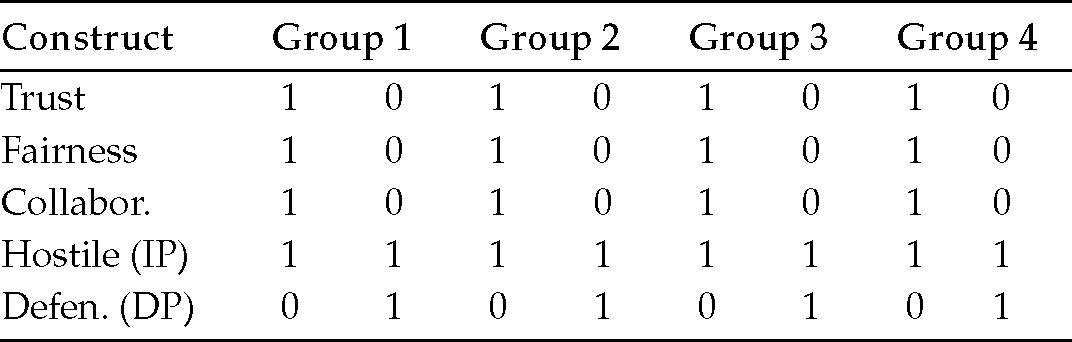
I note that there is an inverse relationship between one’s lack of self-confidence (the impression of being a victim; i.e., Apprehension) and the constructs of Trust, Fairness, and Collaboration. I refer to this as the law of Apprehension:83 the more one feels that he/she is a victim, the less likely they are to trust, reciprocate, and collaborate. Most notably, every single time one team member feels that he/she is in a position of control (Instrumentally hostile position > Defensive position), the values of Trust, Fairness, and Collaboration near the rounded number 1. As soon as the individual feels that they are at a disadvantage (he/she feels more like prey, he/she is more defensive—i.e., more vulnerable—than hostile; in other words, as soon as [Hostile position < Defensive position]), the values of Trust, Fairness, and Collaboration tend obligatorily to diminish radically, toward the rounded number of 0. Even when [Hostile position = Defensive position], those values near zero. Hence, people are very cognizant of their own POVs and this drives their behavior.
Thus, POVs evidently not only exist with respect to Plans and Processes, but also with respect to People, as a psychological phenomenon deeply rooted in a person’s identity.
5.7.3 Multiple linear regressions on a small group study
I ran multiple linear regressions in order to measure the four structural variables that form Trust (Affinity, AFF; Benevolence, BV; Abilities, AB; and Integrity, IN) with their relation to the general work psychodynamics (how well people got along) and obtained the results shown in Table 5.11.
I observe that the majority of the explanatory variables of Trust are emotional in nature (Ability and Integrity are judged cognitively as they can be measured, somewhat; e.g., Ability can be assessed with a university degree). The emotional variables—Affinity and Benevolence—cannot be as easily measured. This suggests that a large part of a team’s effort is based on emotions rather than on purely cognitive appraisals of situations and of others.

5.7.4 Values of the main constructs
I transformed the values found on the questionnaire used to assess the psychodynamic structure of the four groups from a seven-point Likert scale to a percentage equivalent, a strategy that makes the reading of data easier for most of the main constructs (Table 5.12).
I present the following observations: first, for the groups at time0, at time1, and the two groups combined, the level attained by each construct is around 70%. This suggests a so-called relational dynamic. For more on this, see Appendix 5.3, which provides the standards based on years of research. It is enough to mention here that a relational work culture (psychodynamics) implies polite, yet not overly formal interactions, a limited disclosure of personal life and sentiments, and a work-conducive atmosphere.
| Construct | Time0 | Time1 | Difference % (rounded) |
|---|---|---|---|
| Trust | 72 | 75 | 4 (n.s.) |
| Fairness | 70 | 72 | 3 (n.s.) |
| Collaboration | 69 | 78 | 12 |
Second, there has been a positive change between time0 and time1, with the construct of collaboration having much improved (from 69% to 78%).
When we compare the construct of Apprehension (the feeling of being vulnerable) between the two time periods, we obtain Table 5.13.
I make two observations: first, as can be seen from Table 5.13, k′ or the ratio between Hostile and Defensive positions (the reverse of Apprehension) is near 1.3. It is when k = 1.3—as we have found over the course of many studies—that the levels of Trust, a sense of a win-win relationship (Fairness), and Collaboration are most functional within the realm of project management. Second, the value of k′ (Hostile/Defensive positions) has gone up over time (from time0 to time1): this suggests that team members have gotten accustomed to one another and that they experience a lesser sense of vulnerability.
5.7.5 Cluster analysis
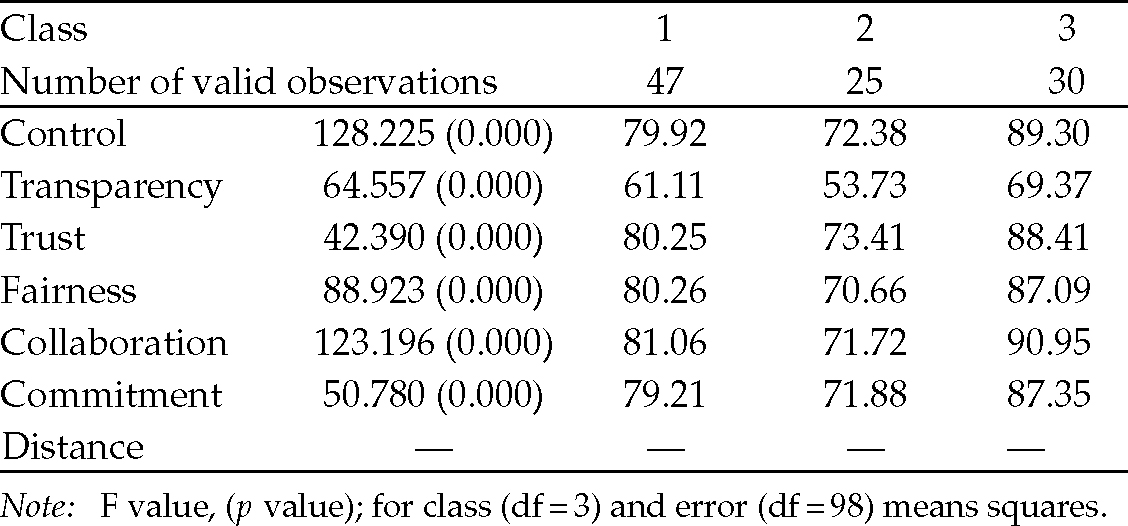
I ran a cluster analysis to see if so-called classes could be inferred from the four groups. I did indeed obtain two classes, as shown in Table 5.14.
I note that the two classes show that when the value of the Hostile position/Defensive position ratio augments (from k′ = 1.41 to k′ = 1.65), the values of Affinity, Trust, and Collaboration increase. In fact, the reverse dynamic occurs as well: as team members find common affinities, develop trust, and collaborate over time (time0 to time1), they gain in self-confidence, they feel less vulnerable and more in control of the work psychodynamics. In this sample, there are two classes of people, with one being slightly more confident than the other.
5.7.6 Structural equation modeling
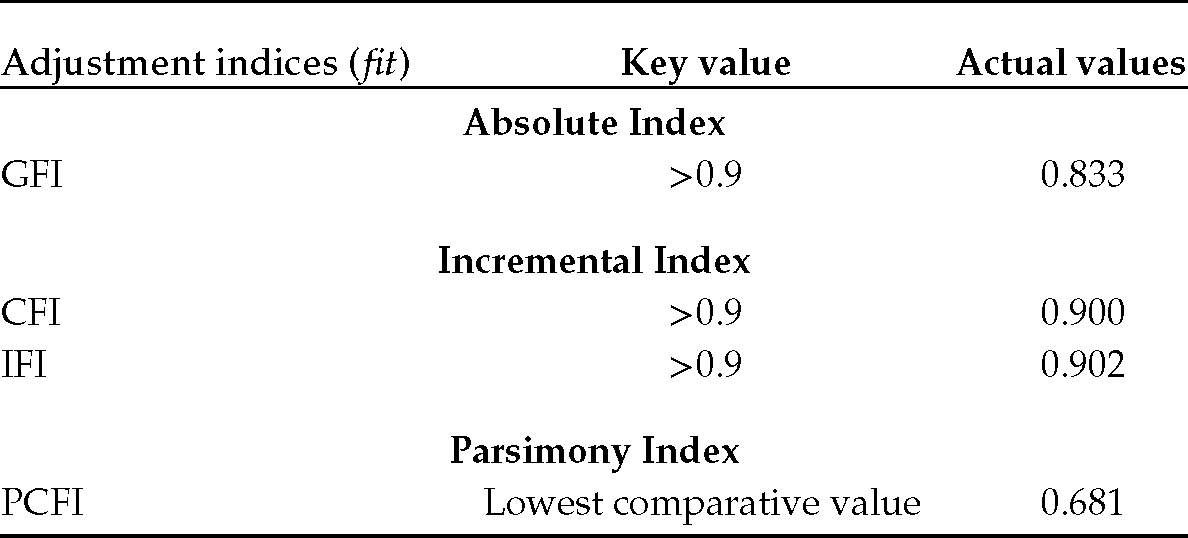
I ran a tentative SEM, the results84 of which are shown in Figure 5.7.
Note that the indices for the SEM are shown in Table 5.15; they show that the model provides a reasonable fit (especially with respect to the CFI and IFI) compared with what was expected.

I make the following observations: First, all four structural variables of Trust (Affinity, Benevolence, Abilities, and Integrity) play a role at some point or another (time0 or time1) in the work psychodynamics. Secondly, Affinity’s role emerges during time1, once team members have had a chance to work together. Thirdly, initial Trust (at time0) (with a β value in a linear regression that I found to be β0 = 0.3) is a key influence on current Trust (at time1). Trust plays an enduring role in work psychodynamics and is built over time.85 Lastly, Integrity is the only structural variable that appears in both time0 and time1, pinpointing the importance of this cognitive variable.


5.7.7 Discussion
My research on four small groups tested at time0 and time1 shows that Pretrust affects Present Trust. In fact, it is Pretrust that most influences present work psychodynamics (PWP). Collaboration is the key direct indicator of the general psychodynamics prevailing among the team members. Trust is hard to measure; a contrario, acts/gestures of collaboration can be easily assessed with such measurements as the flow of communication, the respect of time lines for meetings, task completion, and so forth. Thus, for a feasibility analysis expert, key measurements of a work culture (psycho-dynamics) that present the most objective evaluation are based on the way that tasks are completed and whether they are indeed completed—this can even be assessed through psychometric testing before beginning the project. Collaboration is the most essential valuation tool of work psychodynamics within a project environment, because it is the easiest to measure. Regarding the Trust construct, the measurement is most easily done in a work psychodynamics context by way of an assessment of abilities, and by checking the background of employees and that of management.
Overall, my observations point to the fact that emotions play a large part in a work culture (psychodynamics). This is something we will see time and again in the remainder of this book.
5.8 Interdependence
I have discussed the fact that People must trust each other when working together on a project. Essential components of PWP (work psychodynamics) include Trust and Collaboration. In fact, people develop a feeling of attachment to their colleagues, to their jobs, and to their work. They build an emotional aura around their daily tasks that nurtures a sense of accomplishment. From a processing point of view, People that work along the different transformation stages of a project have no choice but to rely on others to accomplish their tasks correctly; this includes completing tasks at the right time. There is a level of interdependence (most dramatically expressed by causative bonds [C]) between people, and between Forces and Means of Production.
My research as well as that of others86 has shown that dependence serves as a moderating variable (I±) between Trust and Collaboration. That is, dependence may slow down the formation of trust and collaboration, or the reverse: it may promote it. Contexts and individuals are ultimately the ones that decide what form the bond of influence takes: positive or negative. I speculate that together with trust, dependence participates in building the feeling of attachment.87,88
Interdependence increases the stakes of any chain of tasks. The fact that Forces of Production depend on others makes them vulnerable; as they become vulnerable, they generally tend to trust less (or else the opposite, to trust more in order to obtain favors). An interdependent bond between one team member (Force of Production) and another who is unreliable shelters conflicts;89 this is especially true when this concerns access to resources. One project manager says:90 “Conflicts happen when resources are rare.” Rifts, in turn, tend to make people even more unreliable.91
5.9 Blind trust
Some authors92 convincingly explain that trust has a downside: it may actually impair the perception of what is often called ‘moral hazard’ (e.g., in the financial industry), or what are often called ‘threats’, thus increasing one’s vulnerability. This means that trust can sometime go “too far.”93 One of the ways by which people tend to go too far, according to other authors,94 is that they trust either in full or else not at all: there’s hardly half measures when it comes to trust because a half stance is a counterproductive one. It is a little bit like being half pregnant! Constantly being overly vigilant obliges management and the team members (the Forces of Production) to spend energy that could be directed more profitably to deal with real problems rather than with their apprehensions; by the same token, not being vigilant opens the door to abuse and to potential negative outcomes. Trust that is pushed to the limit, that is, to its blind spot, offers artificial relief in the face of danger and signals excessive dependence. In all cases, this generates difficulties somewhere along the transformation process, as the phenomenon of groupthink quite accurately exemplifies. As seen before, a groupthink phenomenon occurs when members of a group narrow down their decision-making options with the feeling that they hold the ultimate truth: they have Blind trust in themselves. This situation is very dangerous, of course.
To illustrate Blind trust, we need to revert back to the U(DS) curve. Recall that this curve is a utility curve, which is the result of balancing external threats and internal POVs given a utility drawback, that is, given the triple constraints. This curve describes a function of utility because it serves to smooth out the pressure exercised by risks and POVs upon the system that is a project. Let’s transfer this scenario and replace Process with People, so that the U(DS) expresses the ability of managers (Forces of Production) to assume a Dominant strategy through the interplay of risks and POVs. We have seen that a manager can be blind in the sense that he could discard completely any personal vulnerabilities or else that he chooses to ignore all external risks. We have also seen that the entire project system is contained within boundaries—the triple constraints—and we have expressed these boundaries along the x- and y-axes by the value of 2.3 (or 1 + k). Recall that we represented this as shown in Figure 5.8.

As mentioned, Blind trust happens when Trust is pushed to a value equal to or superior to 2.2 on a scale that has a maximum limit of 2.3—this is 96%, and we know that we have an allowance of 4% POVs at the minimum in each project. We will discuss the construct of Trust in the next section and see how it relates to the construct of Collaboration.
5.10 Collaboration
My six core competencies model posits that Trust is intimately linked to Collaboration. Collaboration is, in a sense, the behavioral expression of Trust. In fact, tough times may even reinforce the bond between Trust and Collaboration by bringing people closer together. It has been said that cooperation (or Collaboration in our context of project management) “captures the level of coordinated and complementary actions between exchange partners in their efforts to achieve mutual goals.”95 I adopt this definition.
My research has shown that Collaboration is expressed by four functional variables, as displayed in Figure 5.9.
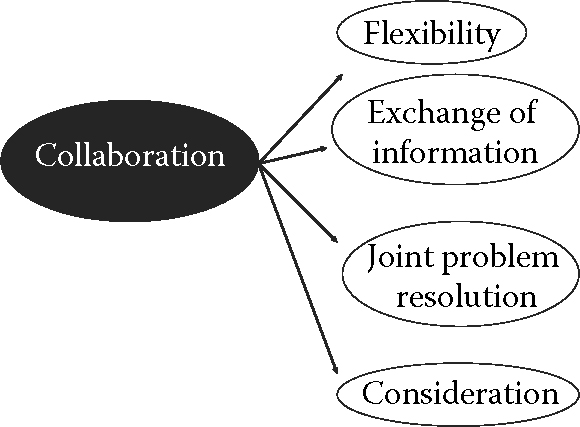
Recall that psychological constructs are illustrated by bubbles and not by parallelograms. Functional variables are expressions of a construct, generally have a high level of colinearity, and are not sine qua non conditions for the meaning or the action of the construct, although obviously having all four variables in this case only makes for stronger collaborative efforts.
Flexibility (FL) alludes to the capacity to adapt to change, knowing change is part of the definition of any project, since projects entail transformation. Exchange of information (EI) refers to communication in any form that is required, joint problem resolution (PR) speaks of a consensus and a capacity to find solutions to dire situations, while so-called Consideration (as in ‘being considerate’, CD) is the willingness to listen to and acknowledge the opinions of others (to support them).
I know from my past research that Collaboration and Trust are linked in the following manner:
Or, in k terms:
Where ß0 = 0.3 corresponds to the initial endowment of Trust, that is Trustt–1 or, to use the terminology favored before, ‘Pretrust’. Note that Trustt can never reach the maximum value of 2.3, because that would force Collaboration to exceed its maximum value of 2.3 (the upper limit in our model). This is why, at a value of [Trustt = 2.3], I refer to Blind trust. In fact, Blind trust is located in the area of [2.2 ≤ Trustt ≤ 2.3].
This means that present collaboration is dependent on previous experience of trust (or pretrust). This seems normal—rarely will people start collaborating with each other without getting a sense as to whether these other people can be trusted or are deemed to be reasonably reliable. Thus, Collaboration Trust there is an initial capital of goodwill96 that is required before collaboration takes place, whether this goodwill results from past experience or from positive hearsay about the vis-à-vis (the person one is collaborating with) is a matter of circumstances.
The Blindness curve is simply Equation 5.2, which has been reversed within the boundaries of the closed dynamic system of the project, with maximum boundaries being valued at 2.3 (or 1 + k). I hypothesize that people trust and collaborate in order to confront risks and POVs.
Given that [Collaboration = 0.3 + 0.9 Trust] and knowing the boundaries of the system, I obtain the following:97
Or
With “3,” of course, being actually [10 (k −1)].
The reverse of the Trust => Collaboration curve98 is simply stating that Collaboration abates with the reverse of Trust, that is (for simplification purposes), with negative trust (trust for which I have flipped the x-axis). As negative trust amplifies (the feeling that one is exposing his vulnerabilities to a menacing vis-à-vis situation), it is much better to limit one’s exposure to risks (not to collaborate with those about to abuse one’s vulnerabilities). Another way of looking at this is that the manager who completely ignores risks (or else all POVs), that is, who is at the extreme of the y- or x- axes, one way or the other, is not likely to generate trust or else to foster a good collaborative spirit on the part of the team members. He/she may be seen as a fanatic that is best not obeyed. He/she becomes an Unfit (an uncontrolled Force of Production, FPnc). Note that because I have set boundaries (the project being a closed dynamic system), I am able to produce curves that all relate to each other (as we shall see in the next section—see Figure 5.13, for example) and that can all be plotted on the same graph, around the constant k. My model is indeed multidimensional.
5.11 Distance
Nowadays, many projects include teams that are physically far apart from each other.99 At times, physical distance is compounded by time zone differences100 as well as by cultural and technological factors. Distance may dilute a group effort. Yet, ultimately, a solid group effort produces, in general, good performance,101 which is what the project manager is after.
Through my numerous studies, I have found the construct of Distance to be a moderating variable between Trust and Collaboration. For some people, it makes communication easier because they do not like face-to-face encounters or are too busy to pay attention to them, while for others it is a hindrance in their capacity to perform.102 In general, though, distance plays against group cohesion.103 Recall that the QMA chief manager had requested that his team members work out of the same office—the building actually facing the construction site—precisely to promote more efficiency.
To test Distance and its role in project management, especially given that more and more projects are spread around the world and include people from different backgrounds, I conducted a study with some 120 participants from 13 different nationalities.
5.11.1 Discriminant analysis
I did not have enough participants representing each country for the sake of statistical analysis, but for cases where I did, I ran a discriminant analysis, the results of which are given in Table 5.16.

Interestingly, only Distance generates a significant difference (at p < 0.05) between the constructs.
5.11.2 Factorial analysis
Table 5.17 provides the factorial analysis (varimax rotation, three iterations) that shows that Distance helps in separating groups of constructs.

Note: (ddf1 = 12; ddf2 = 71).
I observe the following: First, when Distance is not introduced, only one component is formed, and when Distance is introduced, two components appear, with one being radically different from the other. Secondly, when the value of Distance tends toward 0, all other construct values tend toward 1, but when it tends toward 1, all other construct values approach 0. Distance makes trust, fairness, collaboration, and commitment difficult. Third, there is an intricate relationship between the construct Control/Transparency (or put differently, the reverse of Apprehension104) and Distance. A high value of Distance sees low values of Control and Transparency taken individually, and vice versa.
Note that the construct Control/Transparency is to management what the construct Hostile position/Defensive position is to subordinates. Indeed, when employees face a manager who exercises too much control and who is not willing to be transparent, the latter triggers some distrust, just as when an employee faces another employee who seems to want to abuse his/her own vulnerabilities will raise suspicion. Both the ratio Transparency/Control (the reverse of Control/Transparency) and Defensive/Hostile behaviors express somehow the construct experienced by the individual at the receiving end of the interaction: Apprehension.
5.11.3 Cluster analysis
I performed a cluster analysis (25 iterations) with the construct of Distance not being introduced. This reveals three classes, as shown in Table 5.18.
I observe that three classes are obtained. They fall within ‘relational’ individuals (class 1), ‘transactional’ individuals (class 2), and people who favor close relationships or ‘interpersonal’ class 3 individuals (see Appendix 5.3).105
With Distance being introduced, four classes are formed (refer to Table 5.19).

I observe that class 1 and class 3 are both relational; however, they differ significantly on the value of Distance (79.76 vs. 55.66). Distance appears to be a key ingredient in the formation of classes.
5.11.4 Regression analyses
I checked for the normality of populations and residuals; I find that many constructs show significant linear regressions between the variables as determined by their R2 (Table 5.20).106

I observe the following: First, single linear regressions adjust well with the model that is displayed in Figure 5.10, resulting from a structural equation modeling (SEM) analysis. Secondly, an interesting relationship occurs between Control and Transparency. The ratio of Control over Transparency provides the following average value: 1.32, which is the ideal k-value. Values for the ratio Control/Transparency are overall within a functional range (mean = 1.32, standard deviation = 0.12, minimum = 1.10, and maximum = 1.59)—see Appendix 5.3. These findings suggest that managers generally wish to maintain a higher level of Control over the project than that of Transparency. On average, stakeholders wish to have 30% more Control versus Transparency (as k-value ≈1.3). Finally, my analyses tend to show that Distance acts as a moderating variable, a comment that matches some past research; indeed, some authors107 allude to the fact that physical Distance serves as a moderator between leadership and performance.

5.11.5 Structural equation modeling
I performed an SEM using WarpPLS4 because of the relatively small number of participants and the need to assess the moderating role of the Distance construct. I obtained the emerging model shown in Figure 5.10.108
This model suggests that too much control and not enough transparency on the part of project management leads to a reduced sense of trust. However, with a well-balanced share of control and transparency, trust builds up. As trust develops between team members and between them and management, collaboration efforts step up. A sense of fairness reinforces positive feelings. Physical distance serves as a moderator between Trust and Collaboration. Commitment (a proof of motivation) is a natural outcome of a positive environment imbued with trust, fairness, and collaborative efforts. Of course, culture is a major force: it affects all of the aforementioned constructs; indeed, some authors conclude that the success of an international project is linked to the abilities of the project manager, their level of imagination and flexibility, and their capacity to deal with the constraints or peculiarities of foreign culture.109
5.11.6 Discussion
I believe that the results of my investigation make sense: generally speaking, it is harder to instill trust when one cannot see the other person, that is, when there is distance separating the two parties. For some employees, however, distance offers a shelter: they can then use it as an excuse for not performing or for delaying responses (FPnc).110 Distance is indeed a moderator, serving opposing ends depending on context. This may explain why some authors do not agree on its actual role.111 For the most part, my results indicate that Distance exercises a negative influence on the ability to collaborate given a certain level of trust.
Key project-related competencies are part of a dynamic system. These competencies are linked together by specific bonds, be they direct or indirect, moderating (I±) or mediating (I+, or I−). Logically, distance requires better information/communication systems;112 this becomes more and more evident as teams are increasingly dispersed, multicultural, and multidisciplinary.
5.12 Fairness and DS revisited
My database indicates that the participants who filled out my questionnaire share a number of characteristics: (1) their Instrumentally hostile (IP) level is on average higher than their Defensive level (which means that they don’t feel overly vulnerable and hence that they are most probably functional); (2) their Instrumentally hostile (IP) level is not too high—I know that at a level of or above 4.6, individuals tend to become dysfunctional (a little bit too hungry as hungry tigers!); (3) their Instrumentally hostile/Defensive ratio (a proxy of self-confidence) approximates the constant k with a value of 1.3 or thereabouts; (4) their levels of Trust, sense of a winwin relationship (a sense of Fairness), and Collaboration take place in a relational113 as opposed to an interpersonal114 or a transactional mode.115 This also points to a functional group of respondents who are not overly emotionally involved and yet not bluntly cold toward the project in which they participate.
Recall that I resorted to Cobb–Douglas functions in Chapter 4 on Processes to find the point of autonomy. I can find an actual approximation of these functions by looking at my database. Let us set the following equation:
I turn this into log functions and annihilate z′ and β0 in the equation, to allow us to guess the value of β. I picked 16 groups out of my database and plotted their levels of Trust, Fairness (F), and Collaboration (Coll). The approximate value I find for β is 0.3, which is [k −1].116 In the present case, I have found a way to relate all three constructs—Trust, Fairness, and Collaboration—by way of the constant k. Knowing the maximum boundary of the closed dynamic system that a project is, we have the following for [F = z′ −ß0’ Collα Trust(1−α)]:
or
Figure 5.11 illustrates the hypothesized Fairness function that I have found, holding Trust constant.

As can be seen from Figure 5.11, this is a descending curve: the sense of Fairness decreases with the interaction of Trust and Collaboration. Trust is something that must be constantly built and fed, nothing less. Most people will eventually develop the impression that they are not being treated fairly if they keep working hard given a steady level of trust, even more so if they are obliged to collaborate. Many kids’ favorite response to a problematic situation is: “It’s not fair!” This, of course, applies even more eloquently in an environment where risks are potent, and where POVs (which are intimately related to Trust) are present and invigorated. Knowing that trust means accepting to impart one’s vulnerabilities (or one’s POVs) in the expectation that the vis-à-vis has positive intentions (as opposed to malevolent intentions), we can see how the psychological core is related to POVs. Earlier we set a barometer of Trust (Table 5.7). I do not venture at this time to firm up a mathematical formula between Trust and vulnerabilities because I feel this requires further research. Certainly, when one feels that their vulnerabilities are not threatened (they do not face external risks), they tends to trust more.
The psychological core of Trust–Fairness–Collaboration assumes no hidden agendas and no guile (Apprehension or perceived threats = 0). However, from the moment this assumption is betrayed, the psychological core becomes infused with apprehension. This is a very fragile system, as opposed to a robust system, hence the necessity of developing a Contingency strategy and of preparing for Short strategies as discussed in the first chapter.
Indeed, from a People’s perspective, the success of any project hinges on the proper handling of POVs, hence the importance of recognizing them as early as possible, including when doing a feasibility study. In fact, we can probably set forth from the assumption that if team members perceive any malevolent intentions, then most likely there will be no commitment at all, or else very little.
In the absence of POVs, there is no apprehension—in fact, I assume that Apprehension is close to the limit of −2.3 (if such a limit existed). As POVs develop, apprehension takes on a peculiar evolution that forces managers to constantly stay on guard. Figure 5.12) illustrates the evolution of apprehension as POVs grow in intensity.
I hypothesize the Apprehension function to be
or
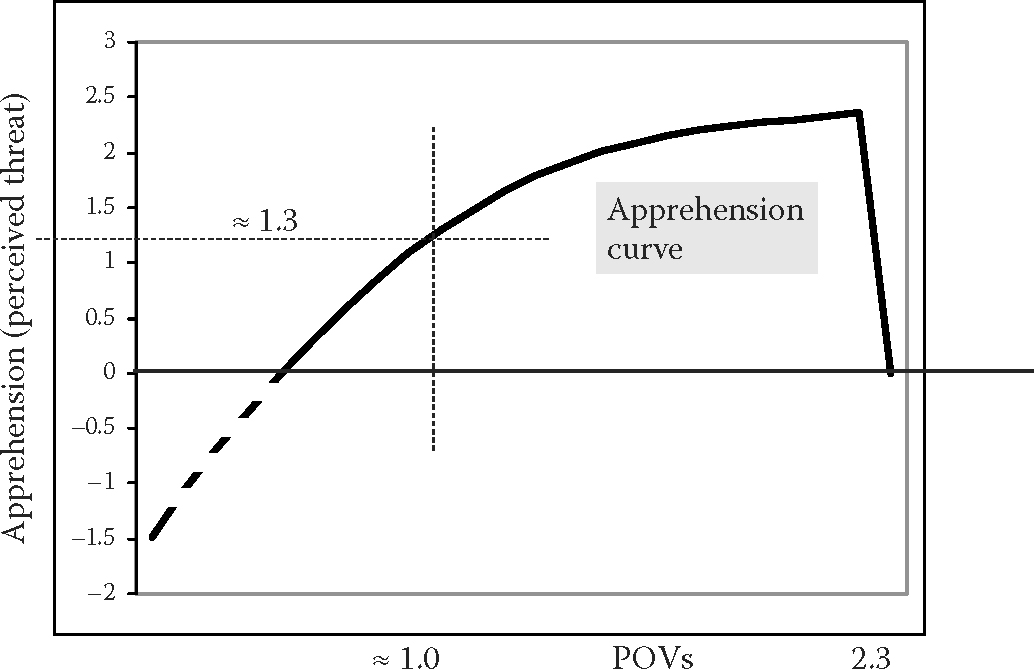
In this function, POVs are measured as what they are going to be in the future (hence POVt + 1).117 Note that the function is nearly ascending linear; very near to the critical boundary point of 2.3, the curve crashes. The curve starts at a negative value (which is not a realistic value because the project system is bound by 0 and 2.3), then engages in a positive range of apprehension at approximately POV = 0.3. The curve shows that there is a maximum threshold (very close to 2.3), past which the system collapses; this is very much how the brain (and especially the hypothalamus and the senses) functions. There has to be a minimum level of threat to trigger an alarm response, and the system cannot pass its maximum coping capacity otherwise it fails completely.
I do not pretend that my functions are all complete and that they are the actual mathematical functions that govern behavior. However, I reckon that they approximate human behavior and tend to explain how People act and react. My formulas are based on my own research and certainly further research will add valuable insight to my proposed model.
5.13 |R and |T
Let me now continue with a logic flow that is in line with what I have presented so far. I postulated in Chapter 4 that team members (Forces of Production) commit to work (expressed by T for travail in French) given some essential resources (R). I have shown in past literature that there is an intricate relationship between the work the team members perform and the use of resources that are absolutely essential for the survival of the project (R). These team members (Forces of Production) need to have a certain amount of knowledge, Th (Th stands for “technology”), and to keep training and learning on the job while they also accumulate nonessential resources (Rn) in the form of, say, a building, equipment, excess inventories, or materials. These surplus items are not immediately needed and will not cause the project to spin out of control or to stop if they are not immediately put to use. Again, my past research has shown the mathematical link between these two process elements: Th and Rn. I plot these relationships in118 Table 5.21.119
These curves can be read as follows: on the left side, holding R (essential resources) constant, the amount of effort tends to shrink. This is normal; employees become accustomed to their tasks and need to spend less energy to perform. They don’t need to accumulate essential resources (hence the fact that I assume R to be constant) just as a person does not need to constantly eat during the day—a satiety point is eventually reached. On the other hand, the time saved on reducing the amount of effort can be spent on accumulating nonessential resources Rn: put in layman’s terms, an individual is likely to relish his/her pay after a hard day’s work, buying themselves a little something extra besides food, such as a ticket to the local theater, which is not an activity essential for survival. As knowledge stabilizes, teams can pile up nonessential resources Rn that they may want to use later on. Hence, there is a trade-off between R and T, between Rn and Th, between R and Rn, and between T and Th.
| For the function: E′ = z′ −ß0 Tα R(1−α) holding one variable constant141 (R = 1) | For the function: holding one variable constant (Th = 1) |
 |  |
| 2.3 − x0.3 · 10.7 | 0.3 + x0.3 · 10.7 |
Let’s make a summary of the various curves we have seen so far (multidimensional Figure 5.13).
Trust is important. There would be no use for T and no accumulation of Rn if there was no trust. Team members must trust each other in order to collaborate (in most cases, and unless coerced, of course) and they would not care about compounding their wealth (in the form of Rn) if they were certain others would steal it (would have malevolent intentions).
At the dynamic Point of Equilibrium, POE, (with x = 1 and y = 1.3), all active psychological forces that drive the project are aligned and, presumably, productivity is optimized. This is a much desired point: team members and management all trust each other (although trust is fragile) and are robust. They balance risks and POVs, collaborate, commit to their tasks, manage POVs in the best achievable way, maintain a high level of utility, maximize their total strategy, and work diligently while preparing reserves for the future. As previously stated, we are able to plot all these scenarios, which provide many viewpoints for the same object—the project—because we have found a constant k by analyzing my database, which we have assumed plays an integral part in every mathematical function I have discussed. As we shall see when I discuss a neurobiological study I did in 2013, this should come as no surprise: the body’s homeostasis (or equilibrium—referring to heat, hunger, thrust, sex drive, and so forth) is controlled by the hypothalamus (which has its own sets of parameters or critical levels that, once reached, trigger the search for food, for example) and which from its lateral portion (the lateral hypothalamus), is responsible for predatory behaviors, generally described as instrumental aggression, and from its medial portion (the medial hypothalamus) for defensive behaviors, generally described as defensive hostility (escaping, freezing, resisting). Thus, the fact that I have identified a hub—the Point of Equilibrium—is simply logical and in line with the way the brain is organized… and people are exactly that: brains!

5.14 Satisfaction
Stakeholders are proud of the projects they participate in. They gladly attend a ceremony when the project is brought to full completion, especially when the project has met the triple constraints of calendars, costs, and norms of quality. We can measure this level of satisfaction by theorizing that the U(DS) curve combines geometrically with the Blindness curve. This combination forms the Satisfaction curve, S (q), where q is simply the independent variable, the achievement of a goal: to reduce POVs down to zero.
This function can be easily calculated since we know the U(DS) and the Blindness functions. It is
Alternatively
The multidimensional Figure 5.14 illustrates the concept of ‘Satisfaction’ and shows how it tends to move the Point of Equilibrium to the right: higher satisfaction is achieved by moving in that direction.

At its optimum point or near it [x = 1 and y = 1.3], satisfaction is actually at or near a minimum; the minimum is actually past the Point of Equilibrium. Note that past the minimal point, team members feel more and more satisfied, in an increasing and quasi-linear ascending fashion. They hence have fewer reasons to be vigilant; they lower their guard, thus providing a fertile ground for POVs to gain in activity and power. It is interesting to note that team members cannot sit on their laurels because POVs constantly loom behind the scene. The Point of Equilibrium is tossed between two opposing trends: Trust and Satisfaction exercise a complementary yet opposing force upon the Point of Equilibrium.
There is one more reason why satisfaction cannot be taken for granted: People’ interact with each other during the transformation phase. Team members at times perceive others as potential threats. They may fear for their jobs, or be concerned that their team members are not willing to cooperate, or else that a particular member is so sloppy that the project is jeopardized. A work culture (psychodynamics) cannot ignore the fact that team members are composed of individuals trying to gain satisfaction by marching away (to the right) from the Point of Equilibrium. This causes tension.
The best way to illustrate these work psychodynamics is to look at the smaller team unit, that is, two people, having to work together. An Edgeworth box best represents how each team member is forced to stay at their Point of Equilibrium despite their desire to gain more satisfaction, because doing so would compromise the satisfaction of the other team member, who would react by wanting to push their own agenda. Figure 5.15 expresses the reality that every Force of Production experiences when working, even on the simplest project.120

As can be seen from Figure 5.15, a team member cannot improve their position (move their U(DS) curve further along its growth curve, which has a slope of 1), which would move the Satisfaction curve further up and to the right for team member 1 (TM1), without entering into the territory of team member 2 (TM2) and pushing their own Point of Equilibrium backward from their perspective. I feel that the Point of Equilibrium shared by team member 1 and team member 2 represents a Cournot–Nash equilibrium: neither team member can improve their strategic position without making it worse for the other, because the other team member will retaliate. I posit that it is also Pareto-efficient: each team member’s position cannot be reinforced without damaging the other team member’s position. Note that because the Blindness curve has a function of [2.2 – 0.9 x] for TM1, it can never match the Blindness curve of TM2. These two Blindness curves will never juxtapose (the slope being 0.9 instead of 1), and certainly not at the Point of Equilibrium. This is why the Point of Equilibrium is actually a dynamic Point of Equilibrium. The best example that can be given for such a dynamic POE is the political situation that prevailed during the Bay of Pigs incident in Cuba in the 1960s, when the United States and the Soviet Union could not move without taking the risk of starting a nuclear war, which would have destroyed both countries. Another dynamic Point of Equilibrium occurred in October 1961, when American and Soviet tanks faced each other along each side of the border at so-called Checkpoint Charlie in Berlin, where the wall had been built overnight a few months before. The confrontation was essentially a test to see who was going to blink first.
Exiting the dynamic Point of Equilibrium (POE) is tantamount to exposing oneself: the other team member is likely to take advantage of the situation. At the dynamic POE, POVs are minimized; outside, there is every reason for apprehensions to influence (and render biased) one’s grasp on reality.
We will see further along in this book how moving away from the dynamic POE reduces the capacity to complete a project successfully.
5.15 Resistance and compliance
For sure, any attempt by a team member to move away from the dynamic Point of Equilibrium (POE) can be perceived as a threat by other team members. Hence, people naturally resist change, and this resistance is amplified by the fact that the dynamic POE represents a state of homeostasis, that is, a state of satiety given the circumstances. Change may awaken Hostile or Defensive positions among the workforce. Yet, a project is by definition a change process (as implied in the transformation phase); team members cannot escape the reality of change and thus the dynamic POE is exactly that: dynamic. Adjustments are needed every day. I have not done any extensive research on resistance, but I propose the following formula to express compliance (i.e., acceptance of change, or, put differently, the reverse of resistance):
Alternatively
How I arrived at this formula is by testing my database and making wild assumptions that need to be verified in further studies.121 Let’s accept it for now and show how it appears on a graph (Figure 5.16).
Note that according to this function, compliance is actually suboptimal in the sense that it is off the dynamic Point of Equilibrium (POE). Compliance starts with resistance (it is negative at first, with the negative area being completely hypothetical because the system’s boundaries are 0 and 2.3) but then keeps increasing as People get to know each other and become excited with the project. But a ceiling is eventually reached; some Fits (FPc) become Unfits (FPnc). The ceiling occurs slightly after the dynamic POE and below it (at [x = 1.1; y = 1.26] instead122 of [1; 1.3], respectively). Then starts a quasi-linear waning in the motivation to accept change, which drags the project down and tends to bring the dynamic Point of Equilibrium (POE) below its optimal point (which is at [x = 1 and y = 1.3]). However, during that descent, recall that the Satisfaction curve keeps increasing: this means that people find a certain pleasure in opposing change, which, from my experience, is not far off the reality. Note also that I have tentatively linked Compliance (or the reverse of resistance) to POVs: the more the POVs, the less the incentives to be compliant. POVs bring about a resistance to change. This is normal: people who feel threatened (whose vulnerabilities are exposed) will want to protect themselves and thus resist change, the more so if apprehension is high.

Inspired by various authors,123 I prepared Table 5.22 to exemplify different means of resistance in relation to the four Ps.
Perhaps my equation for resistance (and its opposite—compliance) is a fair yet not perfect representation of the reality of work psychodynamics in the closed dynamic systems that projects are, but it suffices to express a work dynamic as I see it.

5.16 Culture and work psychodynamics
I have referred on a few occasions to the expression ‘work psychodynamics’. The constructs of Trust and Collaboration, to take only these, do not mean much if we don’t place them within the context of a project, as far as a feasibility analysis goes. I have attempted to prove that People play a key role in projects, in relation to the three other Ps that are Plans, Processes, and Power. To discount the role of People is to ignore the foundation of a project. When we put the six core competencies in interaction with each other as per my model, we actually outline what I call ‘work psychodynamics’ (PWP) or in a general sense ‘work culture’. The question is not whether people trust each other, but rather how team members use trust to achieve the ultimate goal: completing the project on time, within costs, while meeting preset norms of quality.
This question of “How?” is crucial. A culture is, from my perspective, nothing more than how People (stakeholders) in a project use the six core competencies according to Plans. PMBOK 5 (p. 56) refers to “group phenomena.” Culture is indeed increasingly complex. More and more projects call for team members that are dispersed, that belong to different nationalities, and that have highly specialized fields of expertise. This certainly affects work psychodynamics. Collaboration cannot exist without communication, which has its challenges in multicultural projects.124 Distance makes relationships more opaque than they already are. Collaboration cannot be merely reduced to performing tasks; it entails human interactions with its swirl of emotions.125 At the same time, diversity is good; it promotes innovation because new ideas are offered. In fact, diversity can actually be a proactive force rather than a liability.126 It has increasingly become a key feature of large project teams.127
Cultural differences, including competing leadership styles and personalities, affect work psychodynamics, represent a potential POV in multicultural projects,128 and may reduce their chances of success.129 Indeed, as pointed out by some scholars,130 they influence perception, and with this, apprehension (risks and POVs).131
In this context, red flags that signal poor work psychodynamics are worth paying attention to. These flags appear before events actually take place; the feasibility analyst should look for them because they imply behavioral POVs. They include dismissal,132 a reflex that I have witnessed a few times whereby project promoters chose to brush off the reality of the facts and the possibility of a pessimistic scenario occurring; fallacy,133 whereby erroneous assumptions or work hypotheses are formed; normalization of deviance, which can also be detected in errors present in the proposal (I often identify calculation errors that trigger my concerns—how is the project going to be carried efficiently if from its inception such errors occur?); and finally, overoptimism,134 a phenomenon I encounter often when examining project proposals (see Chapter 7). These red flags point to a poor work culture (psychodynamics); they will most likely, sooner rather than later, transpire into stifling conflicts, poor communication, weak management, quirks, stress, the build-up of complexity, and a willingness to choose ignorance over knowledge (i.e., to tend toward the extremes of the Blindness curve).
What I am saying here is that even though the feasibility analyst cannot measure such psychological constructs as Trust and Collaboration before People become People′, that is, before team members are formed and interact during the transformation phase, red flags can be sought with a trained and vigilant eye.
A sound work culture (psychodynamics) is simply assuming a Dominant strategy (DS) to its fullest.
5.17 Conclusion to Chapter 5
This chapter concentrated on the third P of project management: People. I have made a marked difference between so-called success and failure factors, something few books or articles that I have read have attempted to do.
For example, a failure factor is an overwhelming presence of Unfits (uncontrolled Forces of Production) in a high-risk context, especially when there is poor planning involved. Yet, having controlled FP in a low-risk context does not guarantee success. I have also outlined the role of bad apples, something again that few writings in project management address. I have established what Trust is composed of (Affinities, Benevolence, Abilities, and Integrity) and what Collaboration entails (Flexibility, Sharing of information, Joint problem resolution, and Consideration, that is, working for the interest of all), something, again, I believe, and to the best of my knowledge, few books have nailed down to that level.
I have proposed a number of mathematical formulas in an effort to illustrate how humans behave in the context of projects. POVs have proved to be an integral part of human behavior.

5.18 What we have learned about POVs: Chapter 5
POVs …
- Are inherent in the case of competing interests among stakeholders
- Burgeon as FPnc > FPc
- Go hand in hand with Trust in a psychodynamics context
- Can be somewhat guessed by looking at curriculums and answers to particular psychometric tests
- Are closely associated with the barometer of Trust
- Have an impact on a project outcome along with risks
- Are part of Apprehension, when internalized
- Drive people’s behaviors
- Are often known to people, consciously or not (gut feeling)
- Weaken a Dominant strategy
- Relate to Trust given positive intentions
- Influence commitment
- Can reach a value of 2.3, at which point the project system crashes
- That have a value of zero lead to zero Apprehension
- Are fostered by lack of due diligence/vigilance
- Emerge when people sit on their laurels
- Are theoretically minimized at the dynamic POE
- Are related to compliance/resistance to change (the more POVs, the more resistance)
- Are sensitive to cultural contexts
- Are an integral part of human behavior
5.19 Key managerial considerations: Chapter 5
A manager may take note of the following remarks:
- Take the four kinds of stakeholders into account: customers, suppliers, regulators, and bad apples.
- Do all you can to minimize the negative influence of FPnc and bad apples.
- Observe, observe, and observe again.
- Master the project from a parametric, conceptual, and processing point of view.
- Seek to be in control, transparent, and fair. Expect trust, collaboration, and commitment from all people at all levels of the project.
- Hostility destroys a work atmosphere.
- A dynamic Point of Equilibrium is more important to achieve than each and everyone’s satisfaction.
5.20 Case study Chapter 5—Africa versus Haiti
Many projects provide a clear-cut view of the six core competencies model (especially on the importance of commitment). This is no exception in Africa.
5.20.1 Africa
A large number of organizations from all parts of the world try to help various regions across the African continent, some of which are afflicted by illiteracy, a lack of infrastructure, malnutrition, and violence, among other ailments. Organizations can be formal or informal, governmental, private, or paragovernmental, based on economic profits or else on voluntary work. Many not-for-profit (NFP) organizations target the resolution of structural problems within the societies in which they operate. More often than not, a large part of the effort (the development of specific projects) rests on the ability to mobilize the local population, which should appear easy since its own survival or well-being often depends on its involvement. NFP organizations also deal with daily challenges, especially among the poorest—challenges such as access to water and hygiene—and venture into training locals for specific skills.
The World Bank and the International Monetary Fund (IMF) have set development principles that rest on a sense of partnership among the key stakeholders, such as fund providers, local and national governments, the population, and various organizations. Partnership is envisioned in the areas of financing (fund providers finance an NFP organization and let it identify and implement the project), technical assistance (fund providers supply knowledge without interfering with the project managers), and the upgrading of managerial skills. ‘Collaboration’ is the key word. Aid does not come merely in the form of money, but also in terms of in-the-field training. Partnership is also promoted during consultation.
The goal is to hold accountable those stakeholders who participate in any given project, to maximize the chances of success—at least this is the hope. A Canadian agency named l’Agence canadienne de développment international (ACDI) in French and the Canadian Agency for International Development (CAID) in English, has identified four “success” criteria: (1) a precise definition of roles and responsibilities; (2) creating new partnerships where and when necessary; (3) providing key managers with powers and tools that fit their objectives; and (4) the participation of local beneficiaries, especially women.
Many difficulties hinder the realization of African projects such as building a school or digging a well. The sluggish coordination of activities often represents a challenge. Lack of funding for specific programs slows down the process; this is exemplified by poor time management, shortages of materials (e.g., computers), and the gush of unexpected costs. From a human resources point of view, three worries are regularly highlighted: (1) lack of personnel; (2) poor staff competencies; and (3) the fact that beneficiaries have a difficult time in identifying with the project, even though it theoretically has been proposed, funded, and implemented to assist them in their development. Behaviors that accompany such drawbacks include a general lack of enthusiasm and poor quality relationships among stakeholders, all of which often lead to unsatisfactory results.
Often, the local population does not understand the nature and purpose of the project, or chooses to interpret it in its own self-serving way. It has a hard time accepting constraints and obligations. As a result, WBS are rarely implemented as planned. To make matters worse, management is not always transparent; in many countries, it tends to shun accountability.
Circumspect strategic planning, mobilizing (and motivating), and resource management (financial, human, material) are an essential part of any project in the context of African development involving NFP organizations. Often, these functions represent a burden over and above the daily requirements associated with the project, with the result that project leaders experience discouragement and fatigue, and that projects become more and more difficult to complete, and to finish on time, within the planned costs and according to the preset norms of quality.
5.20.2 Haiti
Haiti shares an island with its neighbor, the Spanish-speaking Dominican Republic, which was the first stop that Christopher Columbus is said to have made in the Americas in 1492. Its population is largely black; they are descendants of the slaves whom the French colonists had captured in Africa back in the seventeenth century. It is one of the poorest countries in the world, and certainly in the Americas.
Michel Dubuc is an architect and founder of Aedifica, a private consultancy based in Montréal (Canada) with 175 professionals working on various architectural and engineering projects, including in Haiti. I interviewed Mr. Dubuc and asked him to find parallels between the previously described African situation and Haiti.
Michel Dubuc:
We arrived in Haiti in 2010 as part of the well-known international reconstruction effort after the devastating earthquake.
There is no doubt in my mind that there are a number of similarities between the two regions. In both cases, Africa and Haiti, those engaged in implementing projects are forced by circumstances and events to get out of their zone of comfort.
We discovered that Canadian or U.S. construction regulations, for example, could not necessarily and readily apply in the kinds of environments we are dealing with there. Installing sprinklers, a mandatory device in Canada and often a requirement imposed by international donors, was out of the question for us in Haiti: no one was trained to operate and fix them in case of failure—we had to palliate with other measures, such as devising additional exits. Our ways of doing things had to be adapted to the harsh reality of the living conditions we faced.
Because the country has been economically depressed for so long, infrastructures and human skills are absent. We become agents of change when trying to implement projects according to our quality and performance standards.
We had to find novel ways of doing things, for example, in the engineering of a low-tech air circulation system within a new hospital as an alternate to air conditioning given the high cost of fuel and the lack of electrical infrastructure. We had to plan for two corridors in a particular hospital—one reserved for the staff and one for the visitors—to make sure visitors and family, who traditionally bring food to the patients, would not interfere with staff and cause circulation bottlenecks. Our experience taught us that success for a foreign consultant is predicated on his capacity to adapt to the local reality and culture: we had to be cautious when renovating an existing hospital because the sounds and vibrations of the heavy construction equipment alarmed the patients, who thought another earthquake was looming.
We also had to listen to our new local partners and respect our differences, which were vast on all technical accounts. It was surprising to see that understanding construction drawings was a challenge, so that we had to rethink our communication patterns to make everything crystal clear. With regard to job safety, for example, it was not rare to see workers without protective gear or doing work beside high voltage wires without any appropriate safety measures having been taken. Regretfully, in a country where basic needs are not being met, safety is often a low priority.
We had to negotiate endlessly and deal with abrupt changes all the time. In fact, if you ask me for a definition of adversity, I can provide one quite easily. The way we view it, adversity is about abrupt changes that see no ends. Adversity is about supply chain management: finding basic cement blocks of acceptable quality and locating repair parts for construction equipment proved to be a Herculean effort. It’s about delays that follow as an inevitable consequence, with associated costs and tensions in human interactions at all levels.
It’s also about the lack of expertise and resourceful personnel—for example, it was a real challenge to find a project manager who would want to stay in the chaotic circumstances that plagued the country. Adversity is about the lack of guidelines, of legal structures, and of benchmarks—our parameters just didn’t fit in the new and devastated environment, which we faced when we arrived in Haiti.
Adversity also emerges from the contrasts between the traditional artisan do-as-you-go techniques and modern, proven, technically sound methods that we encouraged and were trained to abide to. Adversity is about a work culture: Haitians are not at ease in working in confined environments such as cavities located under the floors where wires and conduits have to be installed. Our Haitian partners responded well, but the learning curve was long and could be discouraging. This may at times have led people to losing self-confidence and believing less and less in the value of the project. Adversity is also about the lack of cultural references indeed; it is only by explaining over and over again our plans and methods and by adapting to the local culture that we could somehow arrive at realistic architectural solutions, given the context. Being sensitive to culture and to history also means being cognizant that foreigners can be perceived as selfish, given the colonial past of the island.
It takes a huge dose of determination to stay focused on a country where projects fail because of poor planning and lack of risk management. We had to rise above adversity.
The author: “Thank you for sharing your experience with us, Mr. Dubuc.”
5.20.3 Questions related to Case 5: Africa versus Haiti
- Describe the general culture of international and private aid as seen in this case.
- Discuss how control, transparency, trust, fairness, collaboration, and commitment appear and interact in this case.
- Highlight the POVs related to People.
- In your opinion, are there uncontrolled Forces of Production in this case?
- Give your definition of adversity versus chaos.
5.21 Appendix 5.1: Constructs found in the literature
Affinities: Diallo and Thuillier (2005); Dong and Glaister (2006); Zeng et al. (2009)
Being proactive: de Brentani and Kleinschmidt (2004)
Commitment: Black et al. (2000); Brière and Proulx (2013); Briscoe et al. (2001); Dainty et al. (2005); de Brentani and Kleinschmidt (2004); Diallo and Thuillier (2005); Dulaimi et al. (2003); Duncan and Moriarty (1998); Frankel et al. (1996); Halman and Braks (1999); Hampson and Kwok (1997); Hauck et al. (2004); Jung and Wang (2006); Kadefors (2005); Kerzner (1995); Kumaraswamy and Anvuur (2008); Nicolini (2002); Rahman and Kumaraswamy (2005); Stanley et al. (2006); Tailby et al. (2004); Turner (2004)
Common goals: de Brentani and Kleinschmidt (2004); Jodl (2012)
Conformity: Cheung et al. (2003); Cowan (1991); Jarvenpaa and Leidner (1998); Kadefors (2005); Kumaraswamy and Anvuur (2008); Ng et al. (2012); Thompson and Sanders (1998); Wood and McDermott (2001)
Control and leadership: Biro et al. (2006); Chevrier (2003); Turner (2004); on collaboration: Carmel and Agarwal (2001); Dong and Glaister (2006); Jodl (2012); Turner (2004); Zeng et al. (2009)
Communication: Anvuur et al. (2011); Carmel and Agarwal (2001); Chen and Popovich (2003); Clarke (1999); de Brentani and Kleinschmidt (2004); Diallo and Thuillier (2005); Duncan and Moriarty (1998); Grönroos (1994); Kumaraswamy and Anvuur (2008); Mentzer et al. (2001)
Culture: Hammer et al. (2003); Kealey et al. (2005)
Cultural distance: Chevrier (2003); de Brentani and Kleinschmidt (2004); Globerman and Nielsen (2007)
Fairness and win-win: Cleland (1999); Jodl (2012); de Brentani and Kleinschmidt (2004); Hauck et al. (2004); Jodl (2012); Kadefors (2005); Kumaraswamy and Anvuur (2008); Lusthaus et al. (2002); Rahman and Kumaraswamy (2005); Wood and McDermott (2001)
Feedback and follow-up: Lusthaus et al. (2002); Pinto and Slevin (1988); on safety: Toor and Ogunlana (2010)
Flexibility: Chevrier (2003); Cooke-Davies (2002); Kealey et al. (2005); Kerzner (1995); Lusthaus et al. (2002)
Integrity: Cooke-Davies (2002); Jarvenpaa and Leidner (1998)
Loyalty: Kumaraswamy and Anvuur (2008); Wang et al. (2005)
Listening to others: Cheung et al. (2003); Cowan (1991); Hauck et al. (2004); Jarvenpaa and Leidner (1998); Kadefors (2005); Kumaraswamy and Anvuur (2008); Nicolini (2002)
Objectivity: Black et al. (2000); Cheung et al. (2003); Halman and Braks (1999); Kumaraswamy and Anvuur (2008)
“Openmindedness”: Black et al. (2000); Cheung et al. (2003); de Brentani and Kleinschmidt (2004); Halman and Braks (1999); Kadefors (2005); Kumaraswamy and Anvuur (2008); Nicolini (2002); Rahman and Kumaraswamy (2005); Thompson and Sanders (1998); Wood and McDermott (2001)
Planning: Clarke (1999); Cooke-Davies (2002); Ozorhon et al. (2007); Zeng et al. (2009)
Pride: Wang et al. (2005)
Project definition: Anvuur et al. (2011); Clarke (1999); Diallo and Thuillier (2005); Esteves and Pastor (2001); Mentzer et al. (2001); Morris and Hough (1987); Ozorhon et al. (2007); Zeng et al. (2009)
Resources: de Brentani and Kleinschmidt (2004); Dong and Glaister (2006); Jung and Wang (2006); Khang and Moe (2008); Lusthaus et al. (2002); Ozorhon et al. (2007); Toor and Ogunlana (2010); Zeng et al. (2009)
Sharing and reciprocity: Cheung et al. (2003); de Brentani and Kleinschmidt (2004); Dulaimi et al. (2003)
Performance: Zeng et al. (2009)
Stakeholders: Biro et al. (2006); Ng et al. (2012); Pinto and Slevin (1987)
Teams and team spirit: Jarvenpaa and Leidner (1998); Wang et al. (2005); Carmel and Agarwal (2001)
Technical competencies: Dong and Glaister (2006); Globerman and Nielsen (2007)
Training: Morris and Hough (1987); Vickland and Nieuwenhuijs (2005)
Transparency: Dong and Glaister (2006)
Trust: Diallo and Thuillier (2005); Jarvenpaa and Leidner (1998)
WBS: Carmel and Agarwal (2001); Clarke (1999); Zeng et al. (2009)
5.22 Appendix 5.2: Questionnaire on a project’s work


5.23 Appendix 5.3: Tables of constructs and k values
U(DS) is maximized when PWP’s k = 1.3
| Value of k′ | 3.1–4.6135 | 3.0–1.8 | 1.79–1.1 | ≤ 1.0 |
|---|---|---|---|---|
| Observed behavior | Some tense erratic behaviors | Some erratic behaviors among group members | Fairly stable groups | Groups suffer from high turnover level |
| Value of the core psychological constructs | Less than 70% | From 70% to ≈80% | Over ≈80% |
|---|---|---|---|
| Trust, Fairness, Coll. | Transactional relationship | Relational relationship | Interpersonal relationship |
| Characteristics | Contract based Distant | Day-to-day Open | Deep Emotional |
| Nonemotional | Polite | Friendship | |
| Occasional | Trust based | Personal history |
Endnotes
- Belout and Gauvreau (2004); Sartorius et al. (2011); Martin-Alcazar et al. (2011).
- See Mulcahy (2013, p. 169) and our case on Sea Crest Fisheries (Chapter 4).
- See Cleland and Kerzner (1986).
- PMBOK 3 (2004, p. 25) and PMBOK 5 (2013, p. 30).
- Déry, È. (Interviewed March 2015).
- Anderson and Gerbing (1988, p. 414).
- Oakley, G. Interviewed March, 2016.
- This questionnaire cannot be used without the written consent of the author.
- See, for example, Russell and Stone (2002, p. 154).
- One probable causal link I have found over years of research is that a sense of unfairness (injustice) leads to anger.
- Ackoff (1957, p. 7); Brewer and Hunter (1989, p. 42, 149); Brannen (1992); Neuman (1994, p. 43, 99); Cossette and Lapointe (1997, p. 49); Miles and Huberman (2003, p. 273); Buchanan and Bryman (2007, p. 494).
- Anderson (1983, p. 19) and later Van Bruggen et al. (2002, p. 470).
- Wieseke et al. (2008, p. 324).
- For a substantial review ranging from 1963 to 2002, see Gond and Mercier (2005).
- See Jepsen and Eskerod (2009).
- PMBOK 5 recognizes the importance of collaboration as follows (p. 6); “managing a project typically includes, but is not limited to: (…) setting up, maintaining out communications among stakeholders that are active, effective, and collaborative in nature (…)”
- See Wessinger (2011) for a substantial review ranging from 1995 to 2013.
- PMBOK (2013, p. 394).
- As pointed out by Meredith and Mantel (2009, p. 1).
- See PMBOK 5 (2013, p. 51).
- See the section dedicated to work psychodynamics.
- International fund providers often refer to the concept of ‘good governance’.
- Cleland and Ireland (2006, p. 201).
- Fetchenhauer and Dunning (2009, p. 264).
- Van’t Wout and Sanfey (2008); Wishniewski et al. (2009).
- Fehr et al. (2005); Douhou and Magnus (2012).
- See, for example, Bejarano et al. (2015).
- See Pearson et al. (2008).
- Raichle (2011).
- Manikutty (2000, p. 280).
- See Weidenbaum (1996).
- See Ang et al. (2000).
- Wang et al. (2011).
- Brooks and Rose (2008).
- See Kaye (1996).
- See Palmer et al. (2005).
- Campbell and Kirmani (2000).
- The present and further sections in this chapter on People require knowledge of statistics.
- For example, my research tends to show that Attachment is a combination of Trust, Dependence, and Distance; motivation would be formed by a combination of need and the core competencies, and so forth.
- The questionnaire I use to assess the PWP can be made available to the readers given that certain conditions apply, such as payment of royalties and of a round-trip to the Bahamas (!), and respect of confidentiality.
- Le Boterf (2005).
- See Grant (1991); Prahalad and Hamel (1990); Amit and Schoemaker (1993); Peteraf (1993).
- Buchanan (1991).
- On average, project managers are recruited within approximately 25 days from the first interview across the main most advanced Western countries (and Australia). See PM Network, January 2016, p. 9.
- Even if time has no polarity, I can still show the positive influence of Trust onto Collaboration as I do in Figure 5.7; Trust certainly influences Collaboration but the more profound force is time: Trust requires time to build.
- See Gidel and Zonghero (2006).
- From a neurobiological point of view, this makes sense as we shall see. The pituitary gland that releases hormones (such as stress, attachment, or action hormones—cortisol, oxytocin, adrenaline) directly or indirectly cannot feedback to the hypothalamus (in the HPA axis). These hormones must be released in the circulatory (blood) system, which then reach the hypothalamus.
- Stough et al. (2000).
- Bourne, 2015, p. XV.
- See also: Garel et al. (2005) who link performance to commitment.
- Deveau, J.-P. Interviewed March 1, 2016.
- See Gneezy (2005).
- Garbarino and Slonim (2003, p. 229).
- The results of the SEM will somehow vary from one group to the other, but overall, each SEM result tends to emulate quite closely our core six competencies model, which I would qualify as the generic model.
- See Rousseau et al. (1998); Bell et al. (2002); Riedl and Javor (2012).
- Mayer et al. (1995, p. 712).
- Lewicki et al. (1998, p. 439).
- Deveau, J.-P. Interviewed March 1, 2016.
- Oakley, G. Interviewed March 2, 2016.
- Nienaber et al. (2015).
- Such as Chua et al. (2012).
- Ainamo et al. (2010).
- I consider Affinities and Benevolence as emotional variables.
- I consider Abilities and Integrity as cognitive variables.
- See Crosby et al. (1990); Ganesan (1994); Ravald and Grönroos (1996); Doney and Cannon (1997); Smith (1998); Nicholson et al. (2001); Svensson (2001); Bell et al. (2002); Gurviez and Korchia (2002); Wood et al. (2008); Mallalieu and Nakamoto (2008).
- For Competence/Ability/Credibility, see Wood et al. (2008, p. 29); Mallalieu and Nakamoto (2008, p. 184); for Abilities and Benevolence, see Doney and Cannon (1997, p. 36); Ganesan (1994, p. 3); for Integrity, Abilities, and Benevolence, see Gurviez and Korchia (2002, p. 53), Bell et al. (2002, p. 66); for Affinity, see Wang et al. (2011); for the four variables, see Svensson (2001).
- As previously mentioned, there are two kinds of aggression: offensive, which is predatory in nature, and defensive, which is unplanned.
- See Van Goozen et al. (2000).
- Jones and George (1998, p. 536).
- Residuals were found to behave normally as well.
- Bstieler (2006).
- Stahl et al. (2010).
- Anderson and Narus (1990) with an estimator at 0.73. One noticeable difference: these authors argue that Cooperation precedes Trust on a time line, which is contrary to what the majority of studies, including mine, have shown. This discrepancy can be solved by realizing that there is a loop arrow going from collaboration that eventually goes to trust as in our six competencies core model. See also Morgan and Hunt (1994), and Palmatier et al. (2006).
- In many studies, the word ‘cooperation’ is used; in the context of project management, I use the term ‘collaboration’.
- Palmatier et al. (2006).
- All samples have been checked for normality of populations and of residuals; outliers were eliminated where necessary, but, for the record, there were rare. The standard alpha used is α = 0.05 or 95% degree of confidence.
- Nunnally (1970).
- Equivalently, ‘perceived threat’, a term found in the science of ecology (e.g., Johnsson et al., 2004, p. 390). The concept is well established in psychology. I give it a particular meaning in this book by emphasizing the element of surprise.
- Ein-Dor et al. (2011).
- Keil et al. (2000, p. 318).
- Such as Albescu et al. (2009).
- One project leader says: “We put in lots of efforts to inform our team members. I personally tour our plants on a regular basis and make a ‘state of the union address’once a year. I can’t always deliver good news, but it is better than letting rumors poison the atmosphere because suspicion leads to decline.” Deveau, J.-P. Interviewed March 1, 2016.
- Which I refer to as the law of perceived predation in the context of financial predation, the likes of the 2006–2008 U.S. predatory mortgage crisis.
- ‘Intention’refers to intention to stay with the team.
- I will refer to this as ‘Pretrust’.
- Vlachos et al. (2010).
- For the origin of the concept of ‘attachment’, see Bowlby (1973).
- See Grönroos (1994); Mikulincer (1998); Garbarino and Johnson (1999).
- Ochieng and Price (2009).
- Tardif, P.M. Interviewed April 2016.
- See Appelbaum et al. (1998).
- Olsen (2012).
- Bechara and Gupta (1999, p. 182).
- For example, Houser et al. (2010).
- Palmatier et al. (2006, p. 140).
- Says one project leader: “We’ve had to create all kinds of teams over the years in order to invent and market our value-added products. Good communication between all and goodwill generate outstanding results. It’s in the heart of every one of us.” Deveau, J.-P. Interviewed March 1, 2016.
- Without the regression error term, that is unnecessary to prove my point.
- My use the sign ⇒ to signify a linear regression.
- See PMBOK 5, p. 21 on “distant locations” as well as p. 38: “Virtual teams are often necessary for projects where resources are locate onsite or offsite or both, depending on the project activities.”
- See Lee-Kelley and Sankey (2008).
- Yang et al. (2011).
- Adenfelt (2010); Verburg et al. (2013).
- Brucks et al. (2007).
- Recall that Apprehension (perceived threat) is Defensive/Hostile positions.
- These classes are recognized in the literature. See, for example, Freeman (1984) and Dontenwill and Reynaud (2005).
- Durbin–Watson values are acceptable for all regressions.
- Howell et al. (2005).
- As the reader can see, the result is slightly different from that of the core model. Each group will generally have its own variations.
- Youker (1992).
- See Birnholtz et al. (2012).
- Brock et al. (2011).
- Chen and Popovich (2003).
- Grönroos (1994).
- Grayson (2007).
- Williamson (1975).
- Since α does not pertain to any psychological constructs I have discussed, I chose to transform it into [k – 1]. I hold the hypothesis, therefore, that [α = k – 1]. This remains to be further studied, of course, but it allows me to proceed with my model.
- This function is hypothetical; it is an attempt to portray how behaviors relating to Apprehension look. It was developed through a series of transformations operated on my core functions.
- My graph is stylized.
- Together, R and Rn are referred to as |R and Work (T) and Knowledge (Th) as |T.
- I posit that each team member has a growth curve with a slope of 1 starting from the point of origin (at 0) for the sake of simplification.
- This function is hypothetical; it is an attempt to portray how behaviors relating to Compliance look. It was developed through a series of transformations operated on my core functions.
- Note: at x = 1.1, the team member has given an operational margin of 10% versus the optimal value of x = 1 set at the dynamic POE.
- See in particular Lines et al. (2015).
- McFarland et al. (2006).
- See Kumar et al. (2004).
- Stahl et al. (2010).
- Seymen (2006).
- See Milosevic (2002).
- Fitzsimmons et al. (2011).
- Low et al. (2015).
- See Liu et al. (2015).
- Gagnon-Bartsch et al. (2013).
- Flyvbjerg (2013).
- Lovallo and Kahneman (2003).
- I had no results from my diverse researches for values above 4.6. Chaos is assumed above that level.
- The term ‘win-win’comes from the team members. It is much easier to relate to than the concept of Fairness in the context of project management. Everyone wishes to give and receive something positive in a working relationship. Many project leaders consider that being fair is part of their duties: “Our philosophy at Algues acadiennes is to treat all team members the same way: we look for abilities, efforts, experience, and results. We’re in this together, as a team.” Deveau, J.-P., Interviewed March 1, 2016. PMBOK 5 states (p. 2): “When interacting with any stakeholders, practitioners should be committed to honest, responsible, fair practices and respectful dealings.”
- I discounted nationalities for which there wasn’t a sufficient number of respondents.
- Not corrected for outliers.
- Not corrected for outliers.
- I used Baron and Kenny’s (1986) method; my analysis shows that Fairness is a partial mediating variable between Trust and Collaboration. The Beta value for Trust in the regression Collaboration = f (Trust + Fairness) is lower (at 0.297) than the Beta value for Trust in the simple regression Collaboration = f (Trust) (at 0.668) taking into consideration that all regressions between Trust, Fairness, and Collaboration are significant.
- As one must remain equal to himself at all times, which is one of the main premises of my model.