
chapter six People (In action)

So it is, said the Wise Eagle, that those who cheat succeed, as they get to the Emptiness faster than anybody else does.
Darloz
6.1 Introduction to Chapter 6
In order to verify that a sound work culture (psychodynamic) for a given upcoming project is present, the feasibility analyst tries to detect who is likely to be a top performer, that is, who is or can be a fully efficient Force of Production (FP), as opposed to a costly uncontrolled Force of Production, FPnc. Who is the Star?
There are ways to do this that I address in this chapter: we ought to examine personality from the angle of attachment theory1 and see how the brain, under stress (submitted to some form of threat), elects Hostile or Defensive2 behaviors—these behaviors can be so strong and enduring that they actually become part of the modus operandi of individuals. One refers in this case to so-called Instrumentally hostile (IP) and Defensive positions (DP). We must also look closely at egregious individuals, who are the most dangerous FP—these are people who are fully functional, but who operate based on a hidden agenda that can tarnish any aspect of the project. First, let’s look at commitment.
6.2 Commitment
My six core competencies model suggests that people commit to their tasks. As some people say: “You won’t go to jail if you collaborate!” For sure, collaboration is crucial, but there has to be a direction: that of realizing the project within the triple constraints. Otherwise, collaboration may just be a big party with no palpable results. I set Collaboration as a precedent to Commitment; cooperative team members show each other that they are committed. This tends to reinforce collaboration when the team spirit is positive and strong.
I did not measure Commitment in my various studies, but I believe it is akin to the idea of a cumulative effort as described by the Project Management Body of Knowledge (PMBOK), with efforts focused in particular on subduing POVs. Efforts expand over time and they tend to reach a plateau as the project nears its deadline. Essentially, I assume that the Commitment curve emulates the Rn–Th curve, with cumulative efforts | constraints being on the y-axis and resources on the x-axis (Figure 6.1). A number of authors spanning across decades and countries have recognized that the issue of resource procurement and handling is important in project dynamics.3

As we have seen in the previous chapter, we already know the function of this curve because we know the function of the Rn–Th curve. The Commitment curve, as I define it here, seems to make sense; if efforts are put in, this implies some form of commitment. But efforts could be spent uselessly. However, if efforts lead to an increasing use of resources, then, most likely, People are committed to the Plan and to finishing the project; otherwise, resources (total resources, that is [R + Rn], or |R) would sit idle and team members would eventually put less effort in and even forget about their initial goals.4 People trade off present and future knowledge (Th), and present and future nonessential resources (Rn) as time goes on; for example, team members (Forces of Production) learn for a while, then relax while the new information sinks in, then they use newly acquired knowledge that complements past knowledge. This process goes on at a shrinking rate because a saturation point5 is eventually achieved, either because of fatigue or because the team members (FP) have learned everything there was to know in order to perform their tasks; say, to operate a particular, recently installed piece of first-aid machinery6 such as a defibrillator. These team members (for instance, being trained in first-aid emergencies) will have to take some time off from learning and practice a bit, before learning new things about the subject and practicing again.
Squirrels in a city park can serve as an example (not in first-aid care!). They eat nuts now (Rpresent), yet they also hide some nuts away in anticipation of future consumption.7 While eating at the present time (Tnow), they cannot dig the ground and hide nuts for future consumption (Tfuture). While they dig, they cannot eat during the present time: present- and future-oriented behaviors are mutually exclusive. In fact, these behaviors compete with each other. This competition is based on a perceived threat (apprehension) and POVs: eventually, the squirrel will be hungry and will need to feed, perhaps despite the presence of predators (the squirrel will then trade off between the risks—the predators—and its vulnerabilities—hunger). Similarly, the team members (Forces of Production) need to acquire new skills because, eventually, they can be replaced by younger, more alert, and technologically advanced employees, or else by robots. External threats such as competition from the outside and internal POVs work together to force direct and indirect resources (|R and |T) to be optimally utilized.8 This dynamic transpires in our six core competencies model: Apprehension, which invariably exists in correlation with POVs, impacts the psychological core of Trust–Fairness–Collaboration, which then, over time, supports commitment, which amounts to efforts being made in using all of the resources efficiently in order to complete the project.9
I hypothesize that saturation points for present and future uses of resources are achieved at the dynamic Point of Equilibrium. Indeed, because resources (direct and indirect) have a life span, that is, as saturation points only last a certain amount of time, the Point of Equilibrium (of homeostasis) can only be dynamic.
This perspective allows me to qualify Commitment as a series of efforts made using a certain number of resources, whether direct (R + Rn = |R) or indirect (T + Th = |T), that are spread along a time line (in reality, that are submitted to the utility drawback) that outlines a competition between present and future use, and that leads to at least one saturation point.
The following is the equation for Commitment, as I assume it to be, with |R and |T:
or
or
Recall that I plotted the R−T and the Rn−Th curves on the same graph to find the point of autonomy and to discuss the dynamic Point of Equilibrium. I assume that I can do the same here: the Commitment curve goes up and the Fairness curve goes down.10 As time goes on, People express more grievances because they discover unheard of POVs that play against their own welfare and hence tend to want better working conditions; at the same time, they must perform and put in more effort (as they operate in a closed dynamic system that is bound by the utility drawback or triple constraints). The point where they feel that they are treated reasonably well while not overextending themselves forms a psychological state conducive to productivity and repellent to counterproductivity. This point is, of course, the dynamic POE (multidimensional Figure 6.2).

It is worth noting that in recent studies (at least, those I have accessed) in the field of project management, the constructs of Control, Trust, Collaboration, and Commitment, all appear as behavioral competencies in IT projects; yet, Transparency and Fairness are ignored.11 Numerous studies on competencies in project management fall short of identifying Transparency and/or Fairness (or the sense of a win-win situation) as being important factors, when in fact it is hard to imagine anyone wanting to commit to a series of tasks and perform at a high level while feeling something is hidden from them or that they are being or will be treated unfairly.
The feasibility analyst may pose three questions when looking at a project proposal:
Are adequate managerial skills in place?
Do all of the stakeholders trust the project and each other?
Are all of the necessary total resources available (|R and |T)?
I assume that these are sine qua non conditions to the feasibility of a project within the triple constraints (Figure 6.3).

Overall, I have hypothesized that Commitment and Fairness share some common grounds: there is an interplay between them that allows me to plot their curves on the same graph.
6.3 Identifying the stars (top performers)
Functional groups are divided differently depending on the author. The PMBOK classifies what I call the “controlled Forces of Production’ (FPc) according to the stage of the transformation process: (1) start (vision), (2) planning, (3) execution (mobilization), (4) monitoring and control (deployment), and (5) closing (completion/evaluation).
Finding the right employees (the “Fits”), and especially the top performers (the “Stars,” those who display the ideal DS and CS curves), for the completion of a project is key to meeting its deadline, budget, and norms of quality. A project may incorporate great employees, but it may also be subject to bad apples or Unfits. Additionally, a project is naturally prone to some forms of defects (POVs). As pointed out by some authors:
(…) based on the interviews with project management professionals, it is clear that project-based work does produce a number of unintended pathogens that can significantly affect both the way in which project management professionals do their work as well as they manner in which they interact with critical stakeholders.12
Not only are projects sensitive to constant changes, but the current world itself sees dramatic turmoil (environmental, legal, and political) that may represent clear and present danger (risk), at a rate probably never seen before. This is even truer in the context of international projects, where stakes are spread across cultures, distances, and time differences.
The National Aeronautics and Space Administration (NASA) has developed a “federated approach” that states that effectiveness is (structurally) formed of people’s skills and behaviors; this includes abilities (which I have captured in the construct of Trust), alliances (which obviously are related to the construct of Collaboration); assignments (which are included in my construct of Work or T); and attitude (which I include in my construct of Consideration). All of this ultimately serves to differentiate between functional and dysfunctional People.
Increasingly, projects resort to cross-functional work performed in multiple locations based on a diversity of teams.13 The temporariness and heterogeneity of the workforce renders the working environment more volatile and more vulnerable than before. Inefficient employees (FPnc) may not be promptly detected. Opportunities for conflicts may arise faster because unknown factors surface; this happens within a pressured framework that commands specific deliverables, given time constraints, and a predetermined budget. Many risks hinder project developments. In addition, projects must integrate various areas of knowledge and expertise (Th) in unique ways. This is true for projects of all disciplines (including software projects) from decades of project ventures.14
As such, a project environment is subject to high volatility. One can say that the key characteristic of contemporary projects is, indeed, volatility: a characteristic that did not exist to such an extent in the past and that is likely to rise in intensity in the future. More and more, innovations invade markets, projects are developed internationally, the workforce is multicultural and multidisciplinary, and events succeed each other at high speed given such communication tools as the Internet.
The volatile reality of contemporary project environments suggests a potential for “shocks of personalities” to occur.15 These clashes lead to the rise of insecurities. Indeed, employees sometimes feel threatened by their coworkers, their employers, or their environment. Insecure employees beget more volatility, and as the sense of threat worsens (the threat toward one’s job or safety and security, fear of negative outcomes as a project develops, etc.), employees lose motivation, make more errors,16 and resort to counterproductive behaviors.
A review of actual projects across various countries reveals that both personality (profile of shareholders) and what is called an “attitude toward risks’, are assumed to play a role in project outcomes.17
Indeed, it has been found that “the underlying cause of most disputes was the reaction to the (…) personalities of the key players (…)”18 However, it may not be so much the personality types than the way individuals respond to threats that matter in a project environment. It thus appears important to examine what threats are all about and how individuals process them.
Some authors recognize the fact that “(…) there are at least two quite separate types of threat. On the one hand, there is a definite, localizable, actual threat (…); and, on the other, there is indefinite, diffuse, potential threat, (…).”19 However, the authors also note that “the threat must be only mild if approach is to be a viable option.”20 Transposing this in the reality of a project environment, it may be that an employee who perceives his employer or his environment as a threat will tend to avoid it or else react in a counterproductive manner.
Inasmuch as there is high volatility in contemporary projects, certain pillars of stability provide a base for the development of the project. Managerial tools and techniques such as those promoted by the Project Management Institute (PMI)21 are used internationally. Given that the expression of some emotions (e.g., hostility) is similar among different cultures,22 some managerial techniques that assist with the decoding of verbal and nonverbal cues may deal with them with a certain level of success. These factors of stability help to provide a productive environment, but do not necessarily overcome difficulties arising from employees showing flimsy project capability. Additionally, they take place during the transformation stage, not before. Our objective is to detect and minimize the POVs related to People’s inabilities before the project begins, at the feasibility analysis phase.
The term project capability can be associated with the capacity to adopt “the appropriate knowledge, experience and skills necessary to perform prebid, bid, project and postproject activities.”23 It is to a project what a Dominant Strategy (DS) is to the manager. Project capability is imperiled by exceedingly volatile environments that present previously unseen challenges, hence the importance of the proper screening of employees prior to commencing the project or even during the realization of long-term projects. I assume that there are employees with high and others with medium and low project capabilities and consider that it is important to identify them ahead of time in order to secure proper project evolution and ultimately completion within time and budget constraints.
The project management literature addresses the personality of leaders—especially with respect to leadership style—in an attempt to somewhat explain project capability. On the other hand, the Diagnostic and Statistical Manual of Mental Disorders (DSM) IV24 (the most notorious authority in terms of personality assessment) states that personalities contain structural and functional domains, along four levels,25 as follows:
The behavioral level, marked by expressive acts (e.g., impulsivity) and interpersonal conduct (e.g., exploitative).
The phenomenological level, which includes cognitive style (e.g., pessimistic), object representation (e.g., concealed), and self-image (e.g., discontented).
The intrapsychic level, with its morphologic organizations (e.g., divergent) and regulatory mechanisms (e.g., dissociation).
The biophysical level, referring to mood and temperament (e.g., hostility).
I choose to concentrate on a limited version of this appraisal of personality, with the key components put in parentheses—I am searching for top performers, that is, for the Forces of Production (FP) that can most probably swoop down on POVs and lead the project toward its forecasted completion.
In the context of management, it has been shown that control (being assertive, taking charge) and competitiveness (a dislike of losing and willingness to win) are two personality traits that predict whether managers will achieve higher rankings in the organization’s hierarchy; this research covered a seven-year stretch.26 Some authors found that intelligence was to be regarded as “the most important personality attribute (…), followed by physical condition, maturity, sensitivity, emotional stability (…).”27 I argue that intelligence is not, however, a personality attribute.
For the most part, the literature focuses on the technical skills of project managers,28 not on the interpersonal skills of stakeholders, including employees. Technical skills address one of the structural components of Trust (Abilities) but are far from encompassing other psychological variables that form Trust—Benevolence, Affinity and Integrity—or Collaboration—the capacity to be flexible, to exchange information, to solve problems jointly and to be tactful and supportive when interacting with others (so-called consideration).
Various tools are promoted for capturing managers’ personalities, and countless studies have reported results based on the “Myers–Briggs personality test” (MBTI). Many authors29 have resorted in their research to the “Big Five” personality factor theory—agreeableness (friendly/considerate), conscientiousness (efficient/organized), extraversion, openness to experience, and neuroticism (negative emotions)30—and to conflict resolution styles such as accommodating, avoiding, collaborating, and competing31 as well as compromising and enforcing. Various studies report correlations and predictions based upon the Big Five. Yet, it has been noted that “although this model is generally accepted, it has not always been agreed upon that five major factors explain personality, neither has the definition of each factor received consensus.”32
Research has supported the utility of personality assessment tests, but only to a limited degree, alongside other forms of assessment.33 Such tests are recognized as an aid to select employees34; yet, they do not hold strong predictive power.
6.3.1 A personality theory
Coping mechanisms have been acknowledged by many scholars35 by way of an established four-personality model36 (avoiding, anxious, hostile, and stable) under the Attachment theory. Escaping/avoiding personalities tend to run away from the source of threats. Anxious personalities establish shaky relationships with their colleagues. Hostile personalities resort to aggression. Finally, secure (stable) personalities have enduring traits that are most conducive to performance. Several studies (some spanning several decades) have demonstrated that secure individuals tend to be endearing. They stay married longer—in other words, attachment is a good predictor of the length of a relationship.37 It has been found that couples that display communication, intimacy, secure emotional commitment, and trust are more accommodating and caring than others.
Most obviously, a project leader would want to be surrounded by stable personalities and free of pugnacious ones, hence the importance of identifying them. The coping strategies underlying the attachment model have been at the heart of other research. For example, some authors have emphasized the following characteristics: confrontational coping (hostility); escaping, avoiding, and distancing (avoidance); social support–seeking (possibly anxiousness); and finally self-controlling, being responsible, effortful problem-solving, and positive reappraising (stability).38 PMBOK 5 (p. 53) refers to “core personality characteristics.”
The four personalities described in the Attachment theory (anxious, avoidant, hostile, stable) have been heavily documented. Anxious people, for example, make more errors and repeat their errors over time, thus showing poor learning from past experience.39 In particular, research shows that contrasting personalities react differently to trust building and trust violation: more secure individuals tend to favor intimacy in the first case and to talk with a significant other in the second scenario. Avoidant and anxious people long for security in the first case and resort to denial (avoidance) or rumination (anxiousness) in case of trust betrayal.40 Anxious people, in their need to find security, tend to over-trust, that is, to blindly fall into other people’s arms without regard for their own vulnerability.
My own research shows that stable individuals form ideal candidates while unstable individuals see a 20% reduction in their capacity to trust and collaborate with others, versus stable individuals. Stable individuals are likely to deal with conflicts in a fruitful way, to display efficient tolerance to risk, to encourage a means-end approach, and to exercise smarter forms of control. In this book, I do not view being “stable” as a personality trait; rather, I believe it is a condition resulting from well-organized personality traits.
People rarely adopt one single personality trait at once, but experience bouts of these various traits (anxiety, avoidance, etc.) so that an overall balance is established between Hostile and Defensive positions, much in line with a prediction deriving from Lotka–Volterra equations.41 In other words, people tend to be stable. Indeed, stable people make sound decisions and establish durable relationships.
Thus, different strategies aimed at building trust are necessary, with each speaking directly to the particular team member (the one exhibiting offensive42 or defensive behaviors, or else stability43).
The well-known Big Five nomenclature does not allow for differentiating between so-called stable and ill-disposed personalities and hence cannot be used as a valid tool to achieve this, even though it refers somewhat to personality styles as given by the Attachment theory: agreeableness (stability), conscientiousness, extraversion, openness to experience (the reverse of avoidance), and neuroticism (anxiousness). Furthermore, to the best of my knowledge, there is no neurobiological evidence supporting the Big Five theory or other similar theories. However, I can fit some elements of the Attachment theory into the way the brain actually works.
6.4 Hostile and defensive behaviors
I simplify the aforementioned theories by proposing a dual coping mechanism, that of instrumental hostility and defensive hostility. The latter would include anxious (the “maybe”), avoidant (the “I gotta go”), and resistant (the “no”) individuals. I bet that many project managers who read this book recognize these patterns.
A note here to warn the reader to differentiate between Dominant and Contingency or Short strategies, and Instrumentally hostile and Defensive behaviors nested deep in the brain (the hypothalamus). As explained in Chapter 1,44 a Dominant strategy and a Contingency strategy refer to a managerial stance which we compared with strategies wielded by chess players: both positions have value. Hostile and Defensive behaviors refer to behaviors that occur as the result of experiencing Apprehension (a perceived threat, or a vulnerability, e.g., being hungry would lead a tiger to become a ferocious creature). The Dominant strategy, DS, is far from being malignant: it is a strategy adopted to complete the project. Individuals who master Dominant and Contingency strategies (as opposed to Short strategies) have also mastered the art of controlling hostile and defensive behaviors to serve their objectives. On the other hand, defiant behaviors disrupt projects.45 Note that defensive hostile behaviors are temporary in nature.
Hostile and Defensive actions and reactions are coping mechanisms because they are awakened in situations of apprehension (perceived threat). Once coping mechanisms have an enduring presence, I characterize them as (instrumentally) Hostile position (IP) and Defensive position (DP). When the enduring presence appears regularly, at least within the realm of a short- or medium-term project, I qualify the position as profile. When it is part of the personality of the individual (which is divulged most often during long-term projects), I then use the terms (instrumentally) hostile and defensive personalities, which, as mentioned, come in three personality types: anxious (A-X)—the “maybe” people; avoiding (A-V)—the “I gotta go” people; and resistant-defensive (A-R)—the “no” people. To review, we have
Short-term coping mechanisms (reflex-based): (instrumentally) Hostile and Defensive behavioral responses.
Midterm coping mechanisms (including both emotional and cognitive efforts): (instrumentally) Hostile positions, IP, and Defensive positions, DP.
Longer-term coping mechanisms (with their loads of emotional, cognitive, and conative characteristics): (instrumentally) Hostile and Defensive profiles.
Enduring mechanisms (with their set emotional, cognitive, and conative patterns that define individuals): (instrumentally) Hostile and Defensive personalities.
As mentioned, so-called stable personalities are not personality per se in my model; rather, stability is a trait or state that results from people managing all four basic coping mechanisms (instrumental aggression, anxiety, A-X, avoidance, A-V, and resistant-defensiveness, A-R) in an effective way, given the circumstances. It is actually risky to pretend that we can identify personalities without doing long-term, longitudinal research, which we have not done. My results thus focus on positions and profiles rather than on personalities, hence the terms “Instrumentally hostile position”, IP and “Defensive position”, DP.
Also, the reader, who may not be familiarized with the functioning or the anatomy of the brain, may consult Appendix 6.1 and simply view the brain as a mechanism. In Appendix 6.1, I have endeavored to portray the brain much like a machine with its separate parts and underlying constructs (e.g., Trust) in order to ease the understanding. The brain is a convoluted system that is controlled by some set pathways and behaviors, by a clock (in the hypothalamus46 and in genes), and by homeostasis standards (stored in the hypothalamus47).
The key point of this discussion is that a project should be free of spiteful behaviors; they represent significant POVs because hostility elicits hostility (and retaliation), causes instability, and damages trust.
There is neurobiological evidence supporting the four types of coping behaviors that are generated when facing external threats or internal vulnerabilities (in both animals and humans), which, when properly balanced, are assumed to form so-called stable personalities. Consequently, and as mentioned, stable personalities are seen not as personalities per se, but as the result of an individual adequately balancing his reactions or coping mechanisms when experiencing apprehensions.
The hypothalamus is, indeed, the brain structure that governs the four coping responses (also called “adaptive responses”;48 again, see Appendix 6.1 to gather more details on the brain and the hypothalamus). It contains encoded (or “encapsuled”49) patterns that date back to our human phylogenetic ancestors.50 Obviously, they impede on the development of trust, because by definition, they manifest themselves in the presence of perceived or real threats (that cause apprehensions). In a purely raw animal sense, the four patterns can be classified as follows51:
Instrumental aggression52 is commonly called “hostile” (IP). In nature, one calls it predatory behavior: actions are planned and calculated to catch prey by surprise,53 serving the predator’s interest and causing that prey harm or death. One talks of an abrasive personality, or, in psychiatric terms and when pushed to the extreme, of (functional) psychopaths. From a project management perspective, this refers to hostile, feisty individuals.
Freezing, fleeing54, and defensive rage.55 These actually translate into the three following defensive positions: anxious (A-X)—the “maybe” people, avoiding (A-V)—the “I gotta go” people, and resistant-defensive (A-R)—the “no” people.
The four behavioral positions model is based on ethological and neurobiological evidence. In short, four responses to threats are recognized, one being purely offensive—instrumental aggression (or IP in the terminology used in this book) and the other three being defensive (freeze, flight, or fight—also referred to as “defensive aggression”). This is represented in Table 6.1, where A-X, A-V, and A-R combine to form a DP in contrast with an IP.
Anxiety (A-X), flight (A-V), and resistant-defensive fight (A-R) are responses to threats that are found in all animals:56 “Fight, flight, and freezing are at the lowest level and result from a contacting or proximate danger, circumstances in which there is little time for analysis of the situation or freedom of action.”57
| High (T/CRT) (steroids) | Low T/CRT) (steroids) |
|
|---|---|---|---|
Low impulsivity (slow) | IP: instrumentally hostile | Freeze/Anxious (A-X: anxious) | High (5-HT/OXT) (hormones) |
High impulsivity (fast) | Resistant-defensive fight (attack to resist: A-R) | Flight (escape) (A-V: avoiding) | Low (5-HT/OXT) (hormones) |

Defensive coping mechanisms, transferred into a human context, have been found to be counterproductive in many projects, across decades and across countries (Table 6.2).58
Both instrumental and defensive aggressions have been extensively studied, especially in cats, who, like humans, are also mammals. Recent research provides the evidence59 shown in Figure 6.4.
In the model shown in Figure 6.4, an emotion leads to a response. The response is composed of two mutually exclusive reactions (hence the inhibition-activation mechanism): either offensive (IP—predatory) or else defensive (prey). The periaqueductal gray region (PAG) of the brain serves as an absolute mediator; this means that should the defensive reactions be opted out, the road to the alternative response—offensive reactions—is fully open. To use a mnemonic trick, all there is to remember is that stable people have a talent for balancing their hungry tiger side and their lonely sheep side, with the sheep freezing, fleeing, or resisting depending on which option is readily available in the face of danger. As an exercise, the reader can mentally run through his average day and check when they adopted a hungry tiger behavior (“I planned my used car purchase well in advance so that the salesman didn’t have a chance to argue with me today”) or else a lonely sheep behavior (“Today, I got ripped off by an unscrupulous used car salesman who sold me a lemon”)—most readers will be baffled at the result!

In humans, it remains unclear whether hostile and defensive behaviors are completely exclusive as is the case with cats. In other words, people would be able to stay in a defensive posture while also planning for instrumental attacks in the future. This would be the case of, for example, an employee sparring with his/her colleagues whom they perceive to be a threat, thus being constantly on the defensive, while planning to get them in trouble by way of various means (e.g., hiding some documents). However, the reality is that the individual is just switching from one coping strategy to the next over time rather than opting for them both simultaneously. In fact, when I plot some of my data and contrast the constructs of a Hostile position against a Defensive position, I obtain an R2 of 0.092, which is insignificant, signaling that the two behaviors are mutually exclusive. When I plot natural log functions of the Hostile and Defensive positions, I do obtain a near ascending linear curve as opposed to an elbow curve that would tell the story of mutually exclusive phenomena (see Table 6.1).
Indeed, I can postulate that Instrumentally hostile positions (IP) and Defensive positions (DP) are of two very different natures: they are mutually exclusive (surely in cats; most probably as well as in humans60). I opine that instrumental hostility is simply a delayed response to a defensive condition (we will see in Chapter 7 how I put this mathematically). Indeed, instrumental hostility implies low impulsivity. Some authors offer similar explanations as to how the defensive system works.61 Directed escape is controlled by the medial hypothalamus and undirected escape by the periaqueductal gray, while discriminatory avoidance of danger is the function of the anterior cingulate cortex62 and avoidance by the amygdala. The defense system is viewed as a hierarchy of coping mechanisms that can, in project management terms, lead to resistance. First, an employee says “maybe,” then they say “I gotta go,” and finally they settle for a blunt “no.”
Many brain areas are indeed solicited by hostile and defensive dynamics. Again, contrary to other personality theories, the four-encoded behavior model based on Attachment theory and various other scholarly works63 rests on sound neurobiological foundations.
Indeed, besides from the hypothalamus, the brain structures that participate in defensive responses as well as in instrumental and defensive aggression have been identified. As an example, the amygdala (in the brain) plays a fundamental role in emotions, including in “anticipated frustration.”64,65 This is in line with findings by various authors,66 who report that the amygdala plays a key role in the detection and avoidance of danger (perceived threat)67 and in socialization.
Along these lines, it has been recognized that defensive mechanisms are prompted according to two conditions: the proximity of the threat and the possibility to escape.68 According to this model, the flight response entails that the flight option is available and is more pertinent as the prey is farther away from the predator; failing that, the prey may resort to a defensive threat (resistance in the first stage) and then a defensive attack (resistance in a second stage). On the other hand, and still according to this model, the freezing response is assumed to be an available means only if flight is not an option. Again, the more intense the threat (the closer the predator is), the more the prey will resort, as an ultimate option, to a defensive threat/attack. Tests performed with cats submitted to threatening stimuli show this pattern of reactions: Cats momentarily freeze if the threat is not deemed high. If so, the cats will tend to escape if possible. If not, as the predator gets closer, they’ll make defensive threats and as the predator gets within reach, they’ll attack (defensively) the best way that they can, with the option of escaping as soon as it’s feasible. If, on the other hand, the threat seems high and the predator is distant, cats will not hesitate and run for their lives.
Here, I am telling the story of hostility and resistance so often found in a work project environment, especially when the team is not well glued together.
Defensive behaviors in the context of project management do not represent a substantial POV to the evolution of the project as they are expressed by reactive persons who can generally be controlled through adequate managerial tools such as task design and reward. The most concerning POV for a project comes from people who intentionally plan to disrupt it. This is referred to as “Instrumentally hostile individuals” (IP) or “hungry tigers”, the extremes of which are so-called functional psychopaths. Individuals adopting hostile aggression (IP) plan to stop the project’s development, either by way of, say, the creation of conflicts with stakeholders, information withholding, sabotage, or voluntary delays. This leads to apprehension on the part of other team members: as previously discussed, in the context of project management, apprehension refers to the perception one has that of the vis-à-vis has negative intentions and/or hidden destructive agendas directed against oneself. It is deeply rooted in the brain and is at the core of social behaviors. It affects such feelings as trust and may inhibit such behaviors as collaboration.69 Hence, viperous behaviors have the potential to poison a working atmosphere.
A factorial analysis has been offered that contrasts defensive, instrumental aggression, and stability from a personality point of view.70 According to this model, well-adjusted individuals belong to a group that is separate from a group consisting of individuals who manifest compulsive, paranoid, passive-aggressive, and schizoid behaviors and from another group of individuals generally described as cyclothymic, hysterical, or sociopathic.
IP-associated types of individuals differ from passive (reactive) individuals, they have been described in these terms: “Given an appropriate incentive, they simply exploit whatever resources are available to gain advantage (…)”71 Along these lines, it has also been said of them that they are “Pursuing one’s concerns at the expense of the other party.”72 Hostile personalities are indeed a POV.
The reader can imagine what kind of dynamic is likely to take place within a project should the workforce be plagued with hostile individuals. A concrete example has been provided: “As a result, they developed a closer relationship with the architects and viewed the contractor’s motivations suspiciously, believing they possessed a hidden agenda.”73
In short, defensive personalities are mostly reactive. A proper environment will guarantee that they perform according to plan. Hostile individuals, however, voluntarily try to ruin the project on many fronts, most commonly in viscous ways.
Given that 70% of a project manager’s time is spent communicating with people, and given that we have partly defined collaboration by the capacity to exchange information, hostile individuals—with their hidden agendas—are likely to have a strong negative impact on a project’s evolution and to awaken their coworkers’ defensive mechanisms. Hostile individuals strive on manipulating interpersonal conflicts (sometimes defined as “the perception of interpersonal incompatibility which includes annoyance and animosity among individuals”74 as well as “tension, irritation and hostility among team members”).75
While conflicts associated with tasks are sometimes found to be beneficial—as recognized by many authors76—they are not always productive. In fact, dysfunctional conflicts obliterate trust.
I proceeded to retrieve a database dating back to 2008 with n = 300 in which all four constructs of relevance (Instrumentally hostile position, IP, Defensive position, DP, Collaboration, and Dependence) were measured.77 I performed a number of cluster analyses testing for the most-eloquent scenario. The best output is shown in Table 6.3.
| Class | |
|---|---|---|
| 1 | 2 |
Hostile (IP)/Defensive positions (DP): (k’) | 1.55 | 1.30 |
Collaboration/Dependence | 5.67 | 1.22 |
Number of observations | 5 | 295 |
Only a small percentage of individuals (5/300 = 2%) fall into the potentially hostile category (high [Hostile position/Defensive position ratio] with a relatively high [Collaboration/Dependence] ratio), which again is expected, given the voluntary setting (respondents could leave the project if they wanted to). The results show that our measuring system that employs two ratios (Instrumentally hostile position/Defensive position and Collaboration/Dependence) seems to make sense and could be utilized to assess hostility, subject to further research.
The constant k is found with the Hostile position/Defensive position ratio for group 2; k is established at 1.3 for the large majority of participants. It can be inferred that this sample population of n = 300 is representative of the average population.
Interestingly, the corresponding Collaboration/Dependence ratio is similar, at 1.22, to k. Overall, a Hostile position/Defensive position ratio (a proxy for Self-confidence) given a particular Collaboration/Dependence ratio seems to relate to individuals characterized as stable under the Attachment theory. This remains to be probed further.
6.5 Hungry tigers and lonely sheep under stress
When conditions that have favored hostile or defensive (freeze, fight, and flight) actions and reactions persist over time, what amounted to simple reflexes become more enduring traits, at least for as long as those conditions remain. Slowly but surely, individuals adopt their actions and reactions as a means of coping and eventually as a means of being. An individual adopting a DP, for example, is to a certain extent making the choice not to be instrumentally hostile. For those who have seen the movie Silence of the Lambs, this is easy to comprehend: Jody Foster is, for a while, the lonely sheep. While she plays the lonely sheep, she is not out actively chasing the villain. She becomes the hungry tiger toward the end of the movie, when she catches the (dysfunctional) psychopath.
Both perceived and actual threats beget stress in the eye of the receiver. As is well documented, stress may be dysfunctional. High stress levels are known to increase the occurrences of depression and cancer for both animals and humans.78 In laboratory experiments, three-quarters of mice submitted to electric shocks with no possibility of escape eventually suffered from tumors. On the other hand, a quarter of the mice that could escape did not develop such health impairments.79
In the context of projects, stressful events oblige team members to stand hypervigilant, a posture that leads to fatigue, and thus, to lower productivity. Team members (just like animals) adopt two contrasting positions under stressful conditions: one of instrumental hostility and the other defensive (possibly including resistance). Indeed, findings have been reported whereby small changes in posture breed predator (IP) or defensive mental positions, alongside neuroendocrinal changes.80 This is important to know for the project manager: Who hasn’t faced resistance from team members when trying to implement a change in a project?
When I plot the ratio [Hostile position/Defensive position] as a proxy for risks against [100-Trust81], I obtain somewhat of a rectangular hyperbola. Recall that most of my data has been obtained in environments where stress was moderate; I predict that under more stressful conditions, the ratio Hostile position/Defensive position would grow faster than the function [100-Trust] so that the curve would eventually adopt the shape of a rectangular hyperbola.82 We would have Figure 6.5.

This requires further study, but again, finding teams that are willing to be tested while under high levels of stress is quite difficult.83 However, the tests I performed and that are discussed in Chapter 7, point to the fact that under high stress conditions, the element of vulnerability (herewith somewhat expressed by [100-Trust]) is temporarily put aside in favor of an IP response, which tends to shift the U(DS) into the shape of a rectangular hyperbola.
6.5.1 A study
I conducted a study to verify whether I could differentiate between the two positions based on k’ values. I included the construct of Dependence to examine its role in our six core competencies model (Dependence not being a core competency, however).
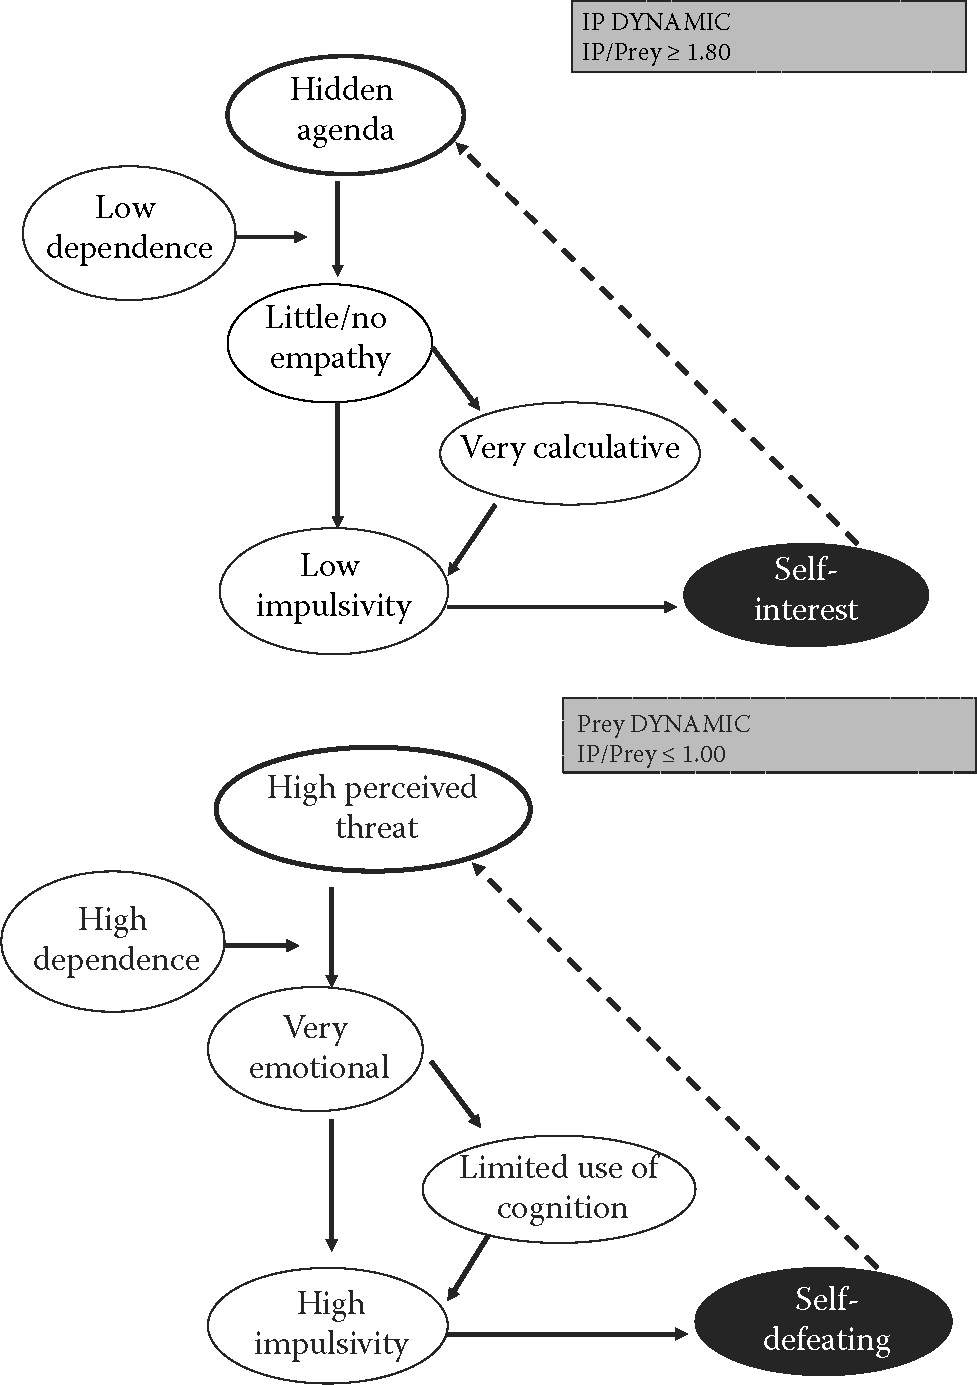
Figure 6.6 exemplifies how I went about adapting the six core competencies model to fit the two positions.
As can be seen from Figure 6.6, the model differs substantially between the two positions—Hostile (instrumentally hostile) and Defensive. Note that I replaced Commitment with Reward because a reward can be measured in the brain: dopamine levels, for example, are an expression of some sense of satisfaction resulting from a reward. Yet, because I tested before the project was completed, I assumed that participants would have left the project if they could not reap any benefit from it. Therefore, that reward was in the end replaced by intention to stay in the project.84
6.5.2 Results
I ran a structural equation modeling (SEM) test on a database of 1324 participants issued from 33 different group projects that I collected over the years, using Amos software (part of my analysis consisted of separating them into two groups—controlled, CG, and uncontrolled, UTG.
Results, for the entire group, irrespective of the k’ value, are shown in Figure 6.7.
The model presents a good fit.
6.5.2.1 Single regression analysis: Trust => Collaboration
Irrespective of the SEM, I verified that the link between Trust and Collaboration was as per expectation, for the entire group. The group displays a normal distribution: in other words, it behaves normally. It shows a strong correlation between Trust and Collaboration.
The R2 for [Trust => Collaboration] is 0.734 for the CG and 0.917 for the UTG;85,86 both show well-distributed data forming an elliptical shape around the mean (what I call the “football” shape).
6.5.2.2 Factorial analysis
I also wanted to check whether the law of Apprehension—which is at the heart of our model—applied as expected.87 The factorial analysis results are listed as shown in Table 6.4.

In short, the listed results are in line with all of the other groups I have studied over the years. This means that this sample can probably be generalized so that I could pretend it is a fair representation of the population at large (within the limits associated with my research), at least on these important characteristics.
6.5.2.3 Evidence of the two positions
Various results with respect to two ranges of k’ values were obtained. I proceeded this way because my research indicated that a k’ value equal to or higher than 1.80 is indicative of a hostile profile and that a value equal to or lower than 1.0 signifies a defensive profile (Figure 6.8).
Table 6.5 compares the sets of values (indicators linking the constructs).
Some differences are noticeable in the relationship between Apprehension and Trust and between Fairness (win-win) and Collaboration with respect to Hostile and Defensive positions. The Hostile individual pays more attention to changes in Trust, perhaps because he/she checks their Defensive position stubbornly, having ulterior motives (bad intentions). The Defensive individual adopts Blind trust more readily, which eventually leads to their demise. As expected, the Hostile individual is less motivated by an equitable collaborative relationship with the Defensive individual.

6.5.3 Another study
I also tested a group of participants who were organizing a food fair, and who had to work together before, during, and after (to wrap up the event) its implementation. I tested them before they got to know each other and afterward by way of my questionnaire.88 In addition, I measured the level of interdependence to see how it would fit into my model. Note that the group was small, and that it is impossible to draw sound statistical conclusions from it; note also that the group expanded, in fact, it nearly doubled between the start date (sample population = 14) of the project and its completion date (sample population = 30). Yet, I feel authorized to pen down some observations, within the inherent limits of such small (and changing) populations (Tables 6.6 and 6.7).

I observe that participants engaged in the project from an interpersonal point of view (see Appendix 5.3). They were quite excited about the project and tended to trust and collaborate with each other rather readily. After the food fair, levels of most constructs declined to a relational or even an interactional level (see Appendix 5.3). Note that the Hostile position was stronger at first. In the end, the ratio of Hostile position/Defensive position remained about the same, near or at k = 1.3. When the level of interdependence abates, so do the values of Trust, Fairness, and Collaboration.


These results are quite typical of how people react when they engage in a project and when they eventually become part of the transformation stage of the project whereby People’ then interact within the context of active and influential Plans’, Processes’, and Power’ structures. The reduction in levels of intensity for the constructs of Dependence, Trust, Collaboration, and Intention to stay in touch with others after the event is significant between the before and after periods (at p < 0.0589).
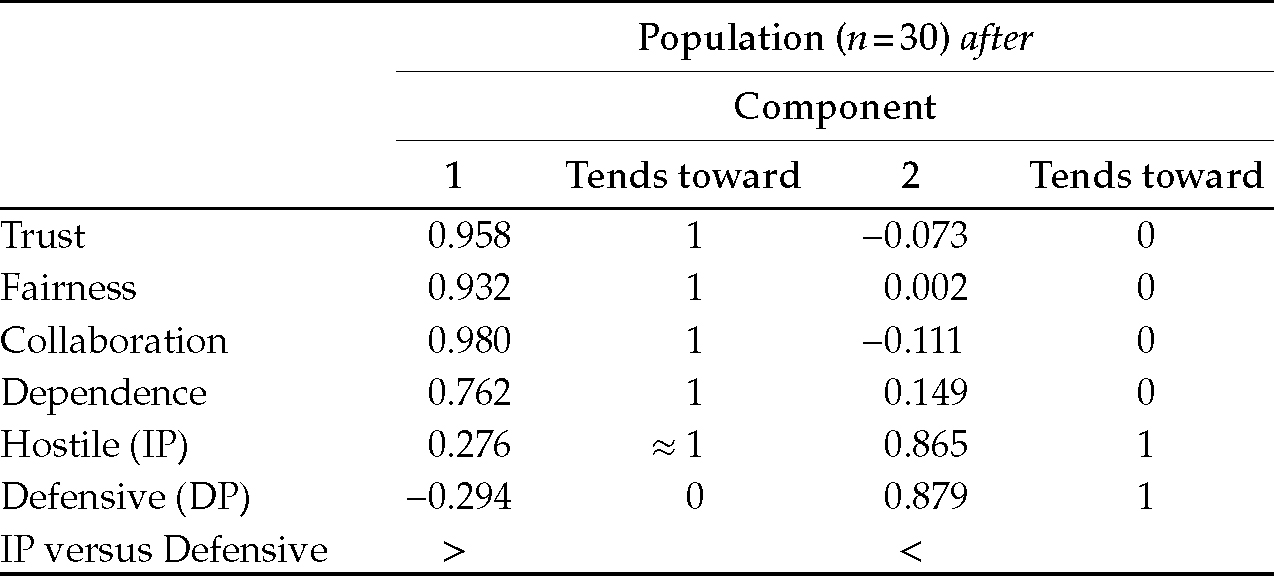
The law of Apprehension, checked by way of a factorial analysis, proved true again in the after period, once team members have had a chance to work with each other, as shown in Table 6.8.
Comparing component 1 and component 2, one can suppose that as apprehension (Defensive position/Hostile position) augments, the mobilization of the vital resources by team members fades out.90
I cannot relate these findings directly to Hostile and Defensive positions, but I can “guesstimate” that there is an element of such positioning in the way that team members in the food fair project engaged and disengaged with it. When put in an environment that does not require hostile or defensive reflexes, People still deeply rely on the core principle underlying these two contrasting coping mechanisms by way of adopting, most probably in an unconscious manner, either a Hostile or a Defensive position, or, more realistically, a nonsimultaneous mixture of both (leading to an ideal k ratio of 1.3).
6.6 Identifying hungry tiger (IP) profiles
Ideally, projects must be exempted from hostile individuals (so-called hungry tigers); they represent a considerable POV. It is thus important for the feasibility expert to be equipped with a means of detecting them.
I conducted a study with the objective of measuring Hostile (PIP) and Defensive profiles (A-X, A-R, and A-V), with the former (instrumentally hostile individuals or hungry tigers) measured by four known traits: calculative, cold, egoistic, and cunning. I also sought to measure such constructs as Apprehension, Trust, Fairness, Cooperation, and Intent to stay in the project.
6.6.1 The study
I approached 343 artists from 9 different one-time shows and asked them to evaluate their director using my questionnaire. I merged the results because the responses were almost identical across the nine directors, although I recognize the limits of such a procedure. The questionnaire had been used in a number of studies and had been meticulously tested for its psychometric value. For all constructs, except for the Hostile position/Defensive position, results are given in percentage, computed from a 7-point Likert scale. The constructs of the Hostile position and Defensive position are measured through five items each and results are computed on a 7-point Likert scale, but not transformed into percentages. Results for the Hostile position are also posted on a 7-point scale. The code “stable” refers to a self-assessment of stability.
The research took place during the 2010s in Canada. Fifty-two percent of the participants in the sample were female, 42% male, and 6% did not respond to the question about gender. Forty-two percent were aged between 18 and 30, 15% were aged between 31 and 44, and 43% were between 45 and 65 years old. The 343 participants were composed of nine groups, most of them musicians and other artists as well as support staff (e.g., stage set) who engaged in the project of producing a one-time show involving a choir and/or an orchestra. The team had rehearsals once a week for nearly a year and twice a week in the few weeks prior to the show. I distributed the questionnaire during a break between two sessions of a rehearsal three weeks prior to the concert with the approval of the project director. The team members were to evaluate their director and, embedded in the questionnaire, I included questions about the respondents’ profiles.
The following constructs were measured with respect to how the team members viewed the project director: the Hostile position, the Hostile profile (related to how much Apprehension the project director generated), Trust, Fairness (a sense of a win-win relationship), Cooperation, Conflict, and the Intention to stay in the project. The following constructs were measured with respect to the participants (how they themselves felt toward the project director): the Defensive position, A-X, A-R, A-V, the Stable as well as the Hostile position (potential for instrumental aggression), and Dependence.
My reasoning was that I would see the impact of a Hostile position on the perception of the director taking into account two measures of Apprehension: Hostile position/Defensive position and profile (PIP or “Profile of Instrumental hostility”).
The questionnaires were collected on the spot and analyses were performed using a “Statistical Package for the Social Sciences” (SPSS) 15 as well as Partial Least Square (PLS 4).
6.6.2 Results
I provide an analysis of my key findings segued from identifying the basic emerging model to examining the role of a Hostile position (the way individuals respond to perceived threats by using uncivilized behaviors), the creation of a project capability index (PCI), and the identification of Stars.
6.6.2.1 Main statistics
The main statistics obtained for the entire group was as shown in Table 6.9.91

These results indicate that for the entire team, their relation to the project director is mostly in a transactional/relational mode (with Trust, in particular, being at 75%; see Appendix 5.3), which means that the project director was mostly regarded as a “business” colleague rather than as a friend. I also observe that the Hostile position/Defensive position ratio (the reverse of Apprehension) of 1.3 corresponds to the standard k-value found in other similar research.
6.6.2.2 SEM model
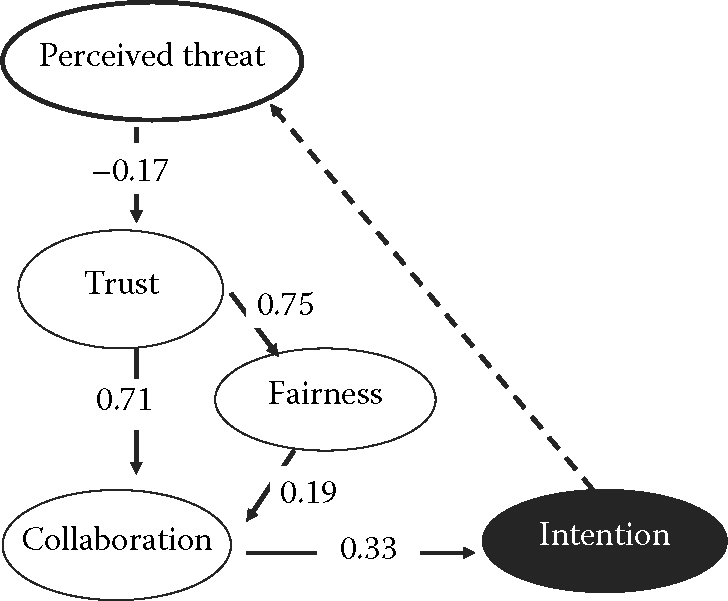
I ran dozens of structural equation modeling (SEM) scenarios with the best model appearing as shown in Figure 6.9.92
The so-called estimators (β values) and the degrees of significance (p-values) indicate that this model is acceptable. The model reads as follows: self-confidence (the ratio of Hostile position/Defensive position, the reverse of Apprehension) has a positive impact on Trust. As Trust builds up, collaborative behaviors increase.93 This is encouraged by a sense of a win-win situation (Fairness) between the parties. As Collaboration takes place, the Intention to stay in the project gains ground; this, in turn, has a positive impact on Self-confidence. Dependence on the director (and hence on the project) serves as a moderating variable.

Conflict also serves as a moderating variable, this time between Collaboration and the Intention to stay. This may be somewhat surprising because many models assume conflicts have a direct negative impact on a group dynamic. However, as noted previously, conflicts within projects can have two sides: functional or dysfunctional. Therefore, it is logical to see that Conflict serves as a moderating variable because it will affect the Intention to stay positively or negatively depending on its nature and intensity. The reader may think of conflicts as if they were hurricanes. North of the equator, hurricanes rotate counterclockwise, but south of it, they spin clockwise, yet they both are hurricanes, which may cause heartbreaking devastation.
These results corroborate findings extracted from various projects that spread across cultures and decades. In the case of the Pendjari National Park Project in Benin in 1993, for example, it has been noted that a sense of trust leads to positive results while conflicts muster delays.94 Countless scholars highlight the fact that trust promotes team integration (Collaboration).95 Some recognize the fact that dysfunctional conflicts bear additional costs.96 Hence, at least two of the three elements of the triangle of constraints (time and budget) are afflicted by the dynamic exemplified in Figure 6.9.
Also of interest is the fact that the Hostile profile (PIP) equally serves as a moderating variable, this time between Trust and Fairness (the sense of a win-win situation). This means that a Hostile profile (in the sense that a profile is composed of a certain number of traits) does not cause conflict by itself, but rather impacts on the emotional (Trust) and cognitive (evaluation of Fairness or the sense of a win-win situation) views of the team dynamic. This also makes sense: for some people, certain personalities will be conducive to better interpersonal relationships, while for others, the opposite view prevails. Hence, profile by itself cannot explain hardships that may arise during the course of a project.
Rather, what seems to count more directly are the levels of self-confidence (the Hostile position/Defensive position ratio) and of the Hostile profile considered jointly. This is what I examine next.
6.6.2.3 The role of hungry tigers
I computed and compared all profile types (IP, A-X, A-V, and A-R; adding Stable as a check measure97). Anxious, escaping/avoiding and resistant-defensive profiles all showed a normal distribution curve when plotting the percentage of individuals versus intensity. PIP (instrumentally aggressive) and stable profiles displayed opposite trends, as shown in Table 6.10.

Unequivocally, when most people claim to be stable, the same people contend not to manifest instrumental aggression.
I ran some factorial analyses98 and found that Hostile position was an excellent discriminator between the groups, as shown in Table 6.11.
I observe that when the Hostile value is higher than the Defensive value, scores for Trust, Fairness (win-win), and Collaboration tend toward 1. However, when the Defensive value is higher than the Hostile value, (i.e., when one feels very vulnerable), the scores for these same constructs tend toward 0. Interestingly, in the first group, the Hostile position is negative and in the second, it is positive.99 This could well be an indication, albeit subject to more verification, that Hostile position is a key marker of the project capability construct.

A discriminant analysis further tended to confirm the intricate part that the construct of a Hostile position plays in our six core competencies model (Table 6.12).
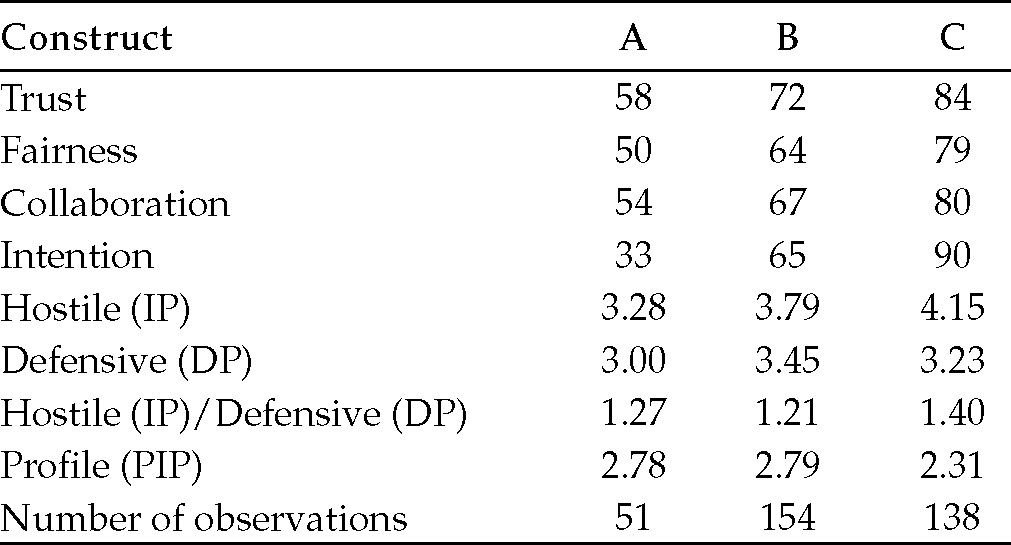
I find in the analysis that the Hostile position/Defensive position ratio is quite close for class A and class B; the same applies for PIP. For class C, however, the Hostile position/Defensive position ratio diverges by about 15% versus classes A and B, and the value of the Hostile position differs by about 18%. Furthermore, each class represents the three known interactional modes with class A being transactional,100 class B being relational, and class C interpersonal (see Appendix 5.3).
6.6.3 An index to separate the Stars from the average team members
Based on these findings, I developed an algorithm (the project capability index)101 that takes into account the Hostile position and the variance between the functional and actual Hostile and Defensive values, functional and real Hostile position/Defensive position ratios, and the three core psychological constructs: Trust, Fairness (sense of a win-win situation), and Collaboration. Since we had measures of Hostile and Defensive positions and Hostile profiles (PIPs), I suspected that I had enough information to separate exceptional (“top performers” or Stars) from average individuals (“others”).
Results show that the project capability index (PCI) sharply divides the top performers (the Stars and incidentally the most stable people) from the others, as shown in Table 6.13.

As can be seen in Table 6.13, the PCI discriminates well between the Stars (the top performers) and the others. Values of Trust, Fairness, Collaboration, and even the value of Intention, correspond to the most stable individuals, using an interpersonal mode (above 85%). This means that these individuals recognize the efforts for trust building, the sense of a win-win situation, and the collaborative endeavors sustained by the project director and “buy” into his/her performance; their Hostile position/Defensive position ratio is functional, at k’ = 1.56 (see Appendix 5.3). Their PCI value is approximately one-third that of the “other” group, those who are not Stars (not top performers). Standard deviations for the constructs do not have as wide a spread for the Stars (top performers) as for the others, which indicates that the former are more focused.
A factorial analysis further confirms the utility of the PCI, as shown in Table 6.14.

I observe that the “‘Stars 1”’ (top performers) have a higher construct mean (0.649). Also, when the PCI index is positive (0.035), values of Trust, Fairness, and Collaboration tend toward 1. Hence, the PCI index respects the law of Apprehension, which predicts that a functional Hostile position/Defensive position ratio leads to higher values for these important psychological constructs.
I performed another discriminant analysis, this time using the PCI and comparing the three groups (all participants: Stars and others), with the results in Table 6.15.

Since, according to my algorithm, the PCI must be under the value of 25, one can see that the top performers/most stable people are found in classes C (3 participants) and I (14 participants) for a total of 17 individuals out of 343, or 5% of the total participants. These two classes also record the best measures for all constructs as well as for the Hostile position/Defensive position ratio (albeit quite high for class C) and the score for a Hostile position (IP), which is expected since the PCI algorithm is based on these measurements.
Lastly, I decided to reconfirm that the two groups (Stars and others) were indeed significantly different, by performing a one-way analysis of variance (ANOVA). Groups (top performers/stable vs. others) are indeed found to be significantly different at p < 0.05 on all constructs except Defensive Position DP at sig. = 0.999).
The PCI seems to effectively delineate those who are stable (called “top performers” or “Stars”) from those who are not as stable. This PCI allows us to establish subcategories among the “others” group, so that I can identify, say, the next 10 or 20 superior performers below the actual top performers.
6.6.4 Discussion
My results indicate that there are two distinct groups, called “top performers” and “others” (Table 6.16).

Top performers (Stars) display high values for the constructs of Trust, Fairness (win-win), and Collaboration. They tend to want to stay in the project longer than the “others” group. They feel a sense of attachment epitomized by high values of both Trust and Dependence.102 Their value for the Hostile position/Defensive position ratio is 1.3, which equals the standard k-value, and this value is half that of the “others” group (at 2.69). They also display much less standard deviation than the “others” group for all constructs, which means they are more focused. They show an excellent balance between the core constructs that are Trust, Fairness (win-win), and Collaboration. They are not geared toward conflicts.
Overall, the so-called top performers are the ideal employees in projects of any kind. They truly are the Stars.
Table 6.17 shows that for the same Hostile position/Defensive position ratio of 1.3 (the k-value), the two groups diverge quite substantially. The Hostile position and the Hostile profile appear to play a role that could explain this difference.

It can be noted that when the Hostile position/Defensive position ratio equals or tends to equal the value of the Hostile profile (1.29 in the last case, close to the k-value of 1.3), top performers stand out. In other words, stable employees are those who manage to find a fair and harmonious balance between their self-confidence level (Hostile position/Defensive position ratio) and their tendency to respond to threats (Apprehension) by way of instrumental hostility. Those employees are most likely to face project volatility with a mature and efficient response.
It can also be observed that for the same k-value of 1.3, the Stars (top performers) display construct values that are on average approximately 20% higher than that of the “in between” group. The Stars (top performers) tend to see the world in a more positive way and to have, from the start, a lower hostile profile. In other words, when the hostility level doubles, the perception of the world changes by approximately −20%. This tends to confirm a generally accepted view that unstable individuals likely view the world in more negative terms than stable individuals.
Most particularly, stable individuals have been found to share a number of characteristics that are highlighted in my results and discussion. High project capability individuals rank well on Trust, Fairness (win-win), and Collaboration. They are focused; they are well balanced emotionally, intellectually, and from a behavioral point of view (Trust, Fairness, and Collaboration); and they maintain their relationships for longer, and display little resentment. In addition, they have a functional level of self-confidence and are not geared toward conflict; they have a strong sense of attachment with the project and enjoy a positive vision of the world. This likely indicates that they will perform better (hence, my labeling of “top performers”). All these characteristics are in line with theories about secure personalities. In harmony with my argument, some authors make the following comment:
A large literature indicates that secure people engage in positive, intimacy-promoting, and tension-reducing interpersonal behavior, and have a positive memory bias for interpersonal exchanges. In contrast, avoidant people are relatively disengaged during social interactions, easily become bored or tense, and are likely to forget their partner’s feelings and remarks.103
The authors mention that stable people “try not to become either positively or negatively emotional.” Antsy people have a hard time forgiving; they juggle between positive and negative reactions and debate between their need for closeness and their need for self-defense. They resort to negative self-assessment.
Stable individuals are flexible and respond to the needs of others. They privilege people first, rather than tasks. They are predictable and use a heuristic logic, taking into account a large view of the world rather than a padlocked, somber view of it. They do not display episodic mood changes or unexpected variations in their decisions. They are usually better at developing their own talents and tend to excel academically and/or in extracurricular activities. They are able to concentrate, are not bothered by negative thoughts or souvenirs, and don’t feel victimized by events or by others.104 Rather, they show control in their cognitive, emotional, and conative processes. Some authors report quite succinctly on the difference between stable individuals and the “others” by way of the following results obtained from their own research.105 For what I judge the construct of Trust to be, the following traits are proposed (with a valence evaluation in parenthesis): trustworthy (0.95), caring (0.91), responsible (0.91), attractive (0.79), and confident (0.63). For Fairness: emotionally stable (0.91). For Collaboration: sociable (0.90) and intelligent (0.70). Finally, for Hostility: dominant (-0.30), unhappy (-0.70), aggressive (-0.75), mean (-0.78), threatening (-0.78), and weird (-0.85).
In summary, stable individuals have a good grip on their hostile tendencies, both in terms of action (k) and their general demeanor or general level of hostility (IP). These people are likely to outperform others. They represent the ideal candidates that a manager would want in a volatile environment, the likes of which are common in contemporary international projects. They are also the ones that should most likely be identified from the get-go and rewarded so that others can follow their tracks. As a manager, wouldn’t you agree?
I strongly suspect that my measures associated with the Hostile position/Defensive position ratio and Hostile profile are not only ingrained in the brain (most particularly, in the hypothalamus and the PAG for the coping mechanisms), but that they are part of the evolution of human nature. As DSM-IV notes when referring to human beings at an early age: “From the evolutionary model presented earlier, trust and mistrust represent facets of the pleasure and pain constructs, generalized to “adaptational” venues within the physical environment (…).”106
People who have a better perception of the quality of trust to attribute to others are likely to be less defensive, that is, they are likely to be more open and to find instrumental hostility unjustified. This behavioral disposition, in turn, generates a climate that is conducive to a friendly atmosphere,107 which then forges a better working environment.108 People who gain trust and respect interdependence are likely to face risks (and thus the threats that are part of volatile environments) and apprehension most effectively. As it has been pointed out in the context of supply chain management: “Trust must exist in an alliance since there is interdependency between the parties to mutually achieve goals (…) trust needs to exist for allies not only to share critical strategic information.”109
Some scholars have demonstrated that two characteristics of stable individuals—meticulous problem-solving and positive reappraisal—lead to satisfactory outcomes in a significant way when it comes to interpersonal relationships.110 In a more recent study, it has been shown in the context of buyer–supplier industrial relations, that levels of trust are highly correlated to positive performance.111
Overall, it appears fair to say that stable employees are likely to perform better, or at least to engage in more productive relationships with their peers. The PCI seems to be a strong predictor of such a positive outcome.112 Of course, the challenge for the feasibility analyst is to identify the Stars (top performers) ahead of time; this is only achievable by examining past records or by developing tests based on scenarios that would highlight hostile personalities and hostile profiles, as well as through interviews.
6.7 Functional and dysfunctional FPnc
The previous section examined top performers, that is, Forces of Production that excel—the Stars. I now discuss the Unfits (uncontrolled Forces of Production, FPnc): the Forces of Production that may block the development of a project. The Unfits (FPnc) may perform a variety of actions that prevent others from completing their tasks in three ways: they affect their mobility by delaying the action plan or by transmitting erroneous information, they hold possession of assets such as valuable information or even material or equipment, and they slow down or attempt to stop activities scheduled for the day. There are two types of FPnc:
Those that are functional
Those that are dysfunctional
Functional ones have a hostile profile and have found a way to adapt to their environment in order to maximize their selfish gains.
Dysfunctional FPnc present anxious, avoidant, or resistant-defensive profiles that are completely distinct from general behavioral norms and that cannot bring about a positive contribution to a project. Functional FPnc are hard to detect while dysfunctional FPnc stand out. Overall, both types of individuals are Unfits.

Often, functionalnc are willing to wait in order to get a sense of reward from their action. They plan for long-term, self-centered gains. They often go undetected, thus representing a significant POV, because they can at times excel at executive functions and in displaying goal-oriented behavior (which is why they are functional). Functional FPnc display weaker responses than others to disturbing emotional information113 that could affect a project. Because they at times do not seek material gain, longing instead for other forms of gain such as mere power,114 they are not necessarily sensitive to financial rewards and may not be willing to adjust their behaviors to fit the needs of the project. They have their own agendas—they belong to the Instrumentally hostile category. Functional but uncontrolled in some sense, these Forces of Production respect social norms, but will brush them off when convenient to do so.115 They are often charming. They may dream of taking charge of the project, but they don’t tend to reveal their intentions; they may play the “diva” when this meets their objective. They are known to excel at conceptual and linguistic tasks. This alone separates them from the dysfunctional Forces of Production,116 as the latter tends to fuss rather than to charm. If I were to test the functional FPnc, I would probably find that they rate low on the Hare psychopathy checklist—revised (PCL-R) scale117 on dysfunctional psychopathology. Yet, functional FPnc share the four fundamental traits of psychopathology as mentioned before: they are (1) calculative (manipulative) in their collaborative efforts, (2) cold (they show little or no empathy) in their approach to control and transparency, (3) selfish when committing to projects, and (4) sneaky (deceitful) in their trust-based relationships. Some authors refer to Machiavellian tendencies.118 Perhaps this terminology resonates with the reader; in any case, most project managers or team members have been confronted with such types of individuals and their shenanigans.
In stark contrast, dysfunctional FPnc cannot hide; they exhibit their antisocial behavior right away.119,120 They are reactive in nature—they belong to the defensive category as defined previously. They don’t plan; they merely react emotionally to the situation, at times in the extreme.
Recall my model of the six core competencies (Figure 5.4). I found that the construct of Control/Transparency (or equivalently, the Hostile position/Defensive position construct) had a direct one-way link to Trust. There was no direct feedback arrow to the construct of Control/Transparency (Hostile position/Defensive position or the reverse of Apprehension) from the construct of Trust. This forces the entire psychological mechanism to go through the process that sees Trust leading to Collaboration with time, and with Fairness being a mediating variable. Collaboration encourages (C+) Commitment, which then is followed by a feedback loop stretching from Commitment to the construct of Self-confidence (the opposite of Apprehension). This means that functional and dysfunctional Forces of Production (FP) eventually get exposed at some point, most likely during the most pragmatic stages of a project, which call for commitment and whereby tasks are to be completed imperatively. Indeed, there is no other way around it because, again, Trust does not feedback directly to the construct of Self-confidence (or its reverse: Apprehension). I found this by way of numerous macroanalyses spread over many years of research. Interestingly, the anatomy and physiology of the brain corroborate this flow (see Appendix 6.1). As seen before, the hypothalamus (the center for apprehension) does feed the pituitary gland (from which emanates, directly or indirectly, the key hormones relating to the four coping mechanisms), but the pituitary gland does not feed back to the hypothalamus. Hormones have to go through the entire blood system before reaching the hypothalamus again. What I am saying here is that the essence of the six core competencies model may be supported by neurobiological evidence. For me, this is good news: I estimate that the brain works much like a production process121 with its specific parameters (e.g., those ingrained in the hypothalamus such as body temperature, energy level, heart beat, hours of sleep, and sexual desire) and flows of activities (like that of hormones). Naturally, this flow has to transpire in the way people (read: FP) behave, and this is exactly what I have discovered.
As an example, it has been found that antisocial individuals (FPnc) typically show significantly reduced prefrontal activity;122 this is in line with what is to be expected from our model. On the other hand and to paraphrase some authors,123 functional FPnc perform differently; they can meet “specific computational demands” and excel at “representation, valuation, action selection, outcome evaluation and learning.” There are other marked idiosyncrasies between functional Hostile (functional FPnc) and defensive, dysfunctional FPnc. Appendix 6.1 compares hostile (instrumentally hostile individuals) and defensive psychological constructs and their accompanying brain structures. Hostile individuals show little changes in their vegetative system before attacking: a slow cardiac rhythm allows them to tolerate stress more effectively. The ability to keep their “cool” in the presence of high stress conditions may even encourage the employers to hire such individuals as project managers. Indeed, panic leads to more errors in decision-making:124 dysfunctional FPnc threaten projects and, additionally, tend not to learn from negative experiences.125 Overall, functional FPnc seem much more attractive than dysfunctional FPnc; the problem is that they are a potent source of headaches because of their hidden agendas. They are, indeed, invisible POVs.
6.7.1 A study and its results
In one of my studies, I found the distribution for a group of 191 participants (shown in Figure 6.10).

Where the x-axis is the self-perceived hostile profile. Eight participants out of 191 definitely fall within the “pure hostile profile” (but none appear at the extreme value of more than 6.75/7.00; this is to be expected, if it were the case, they would have been kicked out of the team and maybe would already be spending time in jail!). This represents roughly 4% of the sample population, that is, 4% of people admitting (unknowingly) to have a pure hostile profile. This is in line with our observation made in Chapter 1 that every project contains at least 4% POVs. Interestingly, 5%–10% is the average known level of violent individuals in most societies since the sixteenth century.126
The majority of people prefer to be seen as “low-hostility individuals”, or else are “low-hostility individuals” because their response is below the middle point of 4 on the Likert scale of 7 points. Yet, the majority of people are neither overly feeble nor overly bellicose. In either case, they would be completely dysfunctional within the project. In fact, most answers range between 2.5 and 4.5, with the majority being close to 3.5 on average, signifying a docile temper that again is to be expected within project teams. I conducted various statistical studies on this sample group (n = 191); I present the results in the next sections.
6.7.1.1 Main construct values
Comparing the values of the main constructs between the eight hostile individuals and the rest of the team, I found a significant difference127 (Table 6.18).

Using a p value of 0.05, I note that the only significant difference pertains to the Defensive position construct. However, the ratio Hostile position/Defensive position or its reverse (Apprehension) is not significantly different: hostile individuals (functional FPnc) mix well with other people and pass by undetected.
6.7.1.2 Factorial analysis
I obtained Table 6.19 by performing a factorial analysis128 where two groups appear.
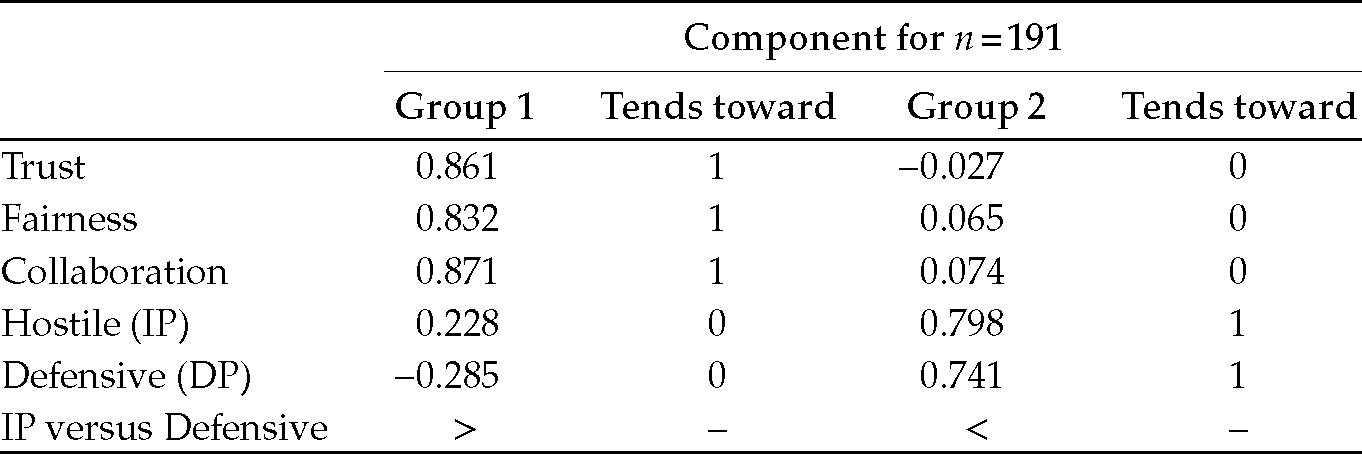
The law of Apprehension is respected yet again: when Apprehension is low (Defensive position < Hostile position), that is, when it tends toward 0, the constructs of Trust, Fairness, and Collaboration each tend toward 1. This can be interpreted as follows: when team members feel vulnerable (Defensive position ≥ Hostile position), they tend not to trust, they feel they are treated unfairly, and they are hesitant to collaborate.
6.7.1.3 Structural equation modeling
I performed an SEM on the sample consisting of 191 participants. The model parameters were found to be relatively poor: the CFI = 0.796, which is smaller than the critical value of 0.9, but the “root mean square error of approximation” (RMSEA) = 0.305, which is greater than the critical value of 0.10. The resulting model is exhibited in Figure 6.11.
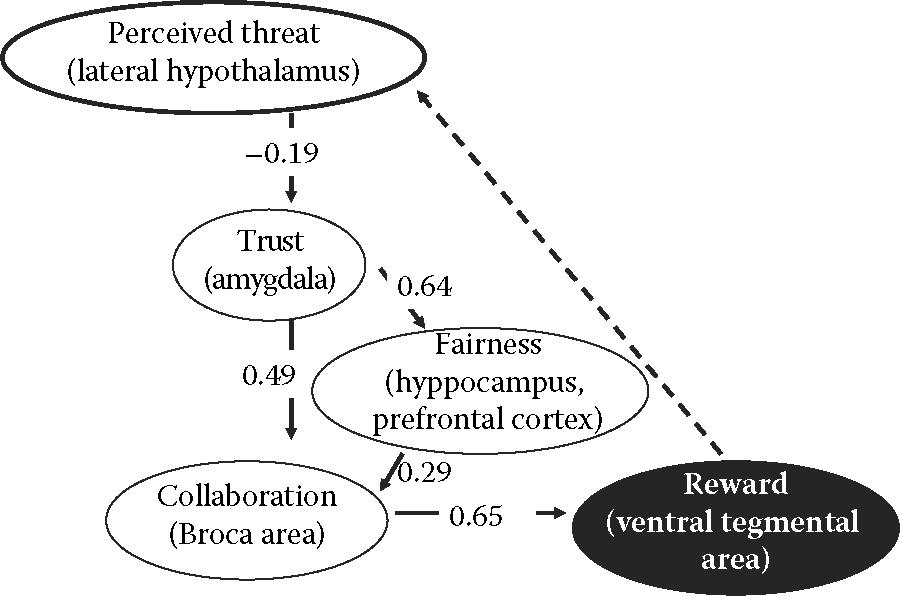
The model is in line with other studies that I have conducted, as explained previously.
6.7.1.4 Cluster analysis
I referred to the profile types that I presented in Section 6.4129 and drew Table 6.20.

There is no hostile class that stands out when doing a cluster analysis. This may mean that the eight hostile individuals are included in the stable or anxious populations, which accounts for 91% of the sample. Again, I know that they are there, but I am not necessarily able to detect them; this characteristic alone is typical of POVs.
I decided to introduce a new construct formed of the reverse of the interplay of the core psychological constructs that are Trust, Fairness, and Collaboration. I temporarily call this reversal of the core psychological construct “Propensity to hostility”.130 I obtained a triangular distribution, which is typical of a moderating variable, as seen in Figure 6.12, where the x-axis is the Hostile profile (PIP) and the y-axis the Propensity toward conflict, by percentage.
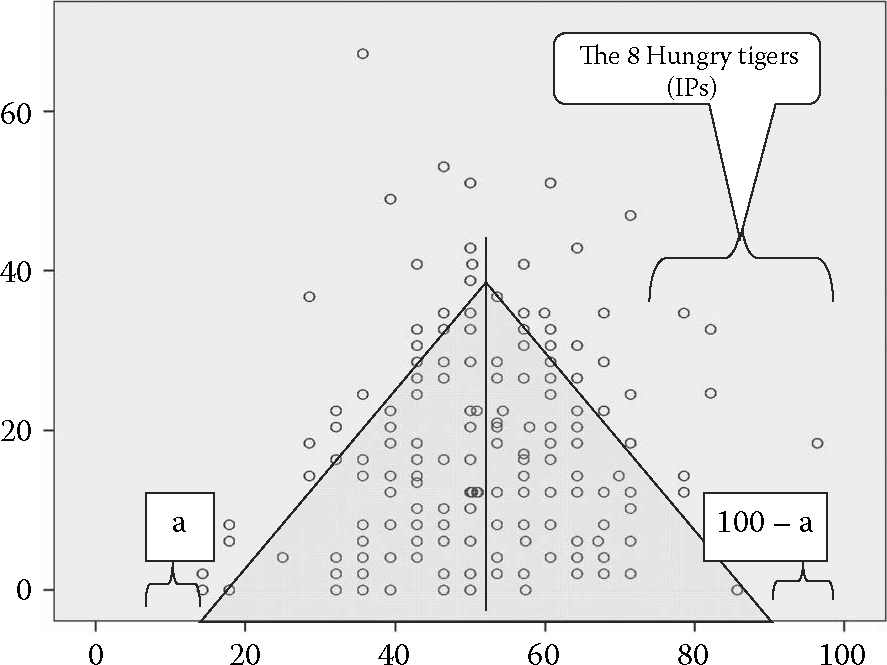
This triangular distribution tells us a story. Very weak hostile individuals avoid conflict: they don’t feel they can win the battle. Most people experience antagonistic situations at various levels. We would assume that these levels are functional in a project environment. The propensity toward conflict rarely exceeds the threshold of 40%–60%; at most, 60% of interactions between members contain some level of disagreement. This seems to be in line with what most of us experience in a project setting. People with hostile profiles long for confrontation and escape the triangular distribution.
I computed the edges of the triangle and obtained these equations:
The slope of 1.14 turns out to be the average of the Hostile position/Defensive position ratio seen earlier. We could hypothesize that the equation is therefore (e.g., left side of the triangle):
I found a relationship between the Hostile position/Defensive position construct and the Hostile profile; I had developed an algorithm based on that same observation in the section on Stars (top performers).
6.7.1.5 Discussion
Based on the sample available, my research shows that about 4% of average teams consist of FPnc of the functional type (Instrumentally hostile individuals). Conflict (Propensity to hostility), when it remains functional, can be good or bad depending on the circumstances and who is involved. A feasibility analyst can expect 4% of any team to be composed of potential hostile individuals, that is, of hostile personalities; these people will likely interfere with the project at some point when this fits their hidden agendas and as such, they represent a POVs right from the start.
6.8 Conflicts
As can be now recognized, the transformation phase, which consists of the four Ps interacting with each other, may have its load of challenges, especially when it comes to People’. The core of the dynamic of the Forces of Production, whether controlled or uncontrolled, rests on the tight interaction between three psychological constructs: Trust, Fairness, and Collaboration. Once this is somehow established, then the team members really commit themselves; they cannot commit to work diligently until that core has been set somehow, even to a minute degree. However, this triumviri is very sensitive to a psychological phenomenon called “Apprehension”, or, if I reverse it, “Self-confidence”. Hence, the psychological core could be seen as a process, as shown in Figure 6.13.


As a process, Figure 6.13 can be written as: Input (Apprehension, or its reverse: Self-confidence) (I− or its reverse: I+) → Transformation: Core (C+) → Output: Commitment. An understanding of the psychological meaning of Commitment is provided by a project leader I interviewed, as follows:
Team members and managers alike embrace a prosperous future. We encourage ownership of the work; we recognize that everyone at all levels of the projects and at every step of it plays an important role. We are part of a team; we are proud. The combination of these positive feelings drives us to outperform ourselves every day: we do our best work day in and day out and look forward to a larger goal. This sense of accomplishment is well represented during milestone events such as the launch at sea of a new vessel, when workers bring in their families and rejoice.131
The psychological foundation works hand in hand with Processes, which I examined in Chapter 4. Ignoring this state of affairs is assuming that Processes are not subject to human intervention, which is not a possibility.
The issue is that the entire psychological process is very sensitive. As apprehension gains momentum, as trust and collaboration become hard to develop, and as a sense of fairness trades places with a sense of inequity, frictions arise. Conflicts are ubiquitous in any project.132 With the increasing complexity of projects—making Planning more tedious and Processes more sensitive to excruciating details, and as People work in multiple remote locations, with various cultural backgrounds, devoting their time to highly specialized tasks—comes the possibility of developing misunderstandings, delays, and frustration. Along these lines, some scholars have pinpointed four interactional challenges, mostly related to international contexts, that impact teams negatively133: (1) contrasting attitudes toward hierarchy; (2) difficulties with language, accents, and fluency; (3) divergence in leadership style; and (4) indirect communication.
Some authors suppose that the level of conflict varies with the stages of the project’s life cycle.134 Confrontations would be at their peak during the planning stage, then somewhat to a lesser level at the vision and deployment stages and to an even lower level at the completion/evaluation stage.
I question this view because it does not espouse the Commitment curve that I have found at the beginning of this chapter. Since Conflicts stand in sharp contrast to Trust, Fairness, and Collaboration, and since Commitment results from a savvy combination of these three constructs, I would expect Conflicts to somehow mimic the pattern of the Commitment curve, especially as qualms accumulate (as compliance recedes). Furthermore, I feel that all tensions are related, directly or indirectly, to resources—recall that I set Commitment as a function of efforts and resources. Not all resources are accessed or expensed in the initial stage, far from it. They are rather used mostly during the deployment stage. Evidently, if commitment is low, little achievement is to be expected.135
The presence of antagonistic demeanors at the beginning of a given project is certainly a good indicator of the fact that deadlock situations will pop out thereafter. Quite naturally, some scholars note that conflicts are a major concern for project managers.136 Some authors137 have interviewed a number of managers and found that the following are short sighted actions that can nurture conflicts (in parentheses are the percentage number of respondents). For Plans: unrealistic due dates (67), hazy goals (63), lack of planning (56), and inappropriate changes of goals/resource allocation (42). For Processes: inadequate resources (69). For People: a lack of commitment (59), communication gaps (54), and conflicts between teams (35).
Not surprisingly, Power is not listed—managers don’t blame themselves. Not puzzling either, Apprehension does not appear: People simply do not admit that they feel threatened by others; it is much simpler to blame communication mishaps or a lack of motivation. On the lack of commitment, it is interesting to note that even in the animal kingdom, it is cause for dispute, as pointed out by some scholars: “chimpanzees attack allies that do not support them in third party conflicts, and queen naked mole rats will attack workers that they judge to be lazy.”138
The following comment has been made, which describes well the dynamics underlying difficult projects: “often there is frustration, unease and suspicion because of the complexity of the situation, which is one of total dependency, lack of control and uncertainty.”139 Somehow, apprehension is linked to uncertainty, which is taunted by the levels of risks (external threats).
Many observables that pertain to conflicts can only be detected once the project is in marching order, not during the feasibility analysis period. These include complaints and grievances, errors, and turnover. We are left with guessing the level of turmoil ahead of time.
Conflict is not a dead construct: it is indeed dynamic and has a life of its own. I contend that conflicts are resource based and that they are composed of four main sine qua non characteristics: First, they burst out because they have an opportunity to do so (an opportunity, which is linked to the availability and importance of resources). Then, generally, bad luck, lax managerial measures, or some network arrangements that disfavor a particular team or a team member over another, which fuels confrontation, jealousy, and resentment, are also involved. However, this is not enough. There has to be a means of expressing the discontent; it can be a meeting, an e-mail message, or some rumors. Additionally, there has to be a motive; People do not engage in confrontations without an ulterior motive, which is to gain a position that allows them better access to or control of said resources. Finally, strong, negative feelings arise because People do not see a solution; they stick to the obstacle. Hence, a conflict is a means of finding a solution to a particular problem, with the risk being that it may turn out to be more dysfunctional than functional. Figure 6.14 illustrates the components of conflicts.

Falling short of determining ahead of time what dilemmas will likely rotten the project, the feasibility analyst can nevertheless check whether some of their sine qua non components are present. Identifying motives, obstacles, opportunities, and tools all at once is one way of predicting their inevitable emergence.
I have expressed the fact that conflicts revolve around resources. This is certainly true in organizations as well as in the animal kingdom.140 We have also seen in Chapter 4 that resources come in two forms: essential (R) and nonessential (Rn). In fact, I argue that work (T) and knowledge (Th) are a form of resources, because work and knowledge eventually lead to the acquisition of R and Rn. A well-paid job, for example, allows the worker to buy fancy, unnecessary assets that he/she may enjoy during their leisure time. Hence, by extension, quarrels arise as a result of a scarcity of R, Rn, T, and/or Th. Often, boorish behaviors degenerate in a spiral with tit-for-tat behavioral games; aggression may even take place.141 Scarcity implies apprehension: it threatens the homeostasis of the individual. The more the apprehension gains in intensity, the more valuable |R and/or |T become. To draw a parallel in the animal kingdom, the “valuation of cover increase(s) with perceived threat.”142 Brown trout subjected to prior predatory attacks (hence, which have accumulated knowledge about a threat) show more aggressiveness in protecting their territory than other trout precisely because they have acquired knowledge about a real threat. We can therefore suggest that the conflict is a function of resources, in the four forms that they can take |R and |T.
Because I have established that Commitment is expressed by efforts that are made versus the uses of resources, because I have just determined that resources can take four forms (directly R and Rn, and indirectly T and Th), and because I have recognized the fact that Conflict can be functional at times and dysfunctional at other times, I can therefore set that Conflicts serve as a moderating variable between Collaboration and Commitment. This is actually what I have found in some of my research (see Figure 6.15).

As the reader can assess, I am completing the initial model to include Dependence, Distance, Profiles and Conflicts, as moderating variables. All of these variables can have either a positive or a negative impact on the project, depending on circumstances.
Grudging face-offs are generated by the inability of team members to deal with scarce resources, whether they come in direct (|R) or indirect forms (|T). It exacerbates apprehension, as People feel endangered by the fact that they are not likely to sustain their level of comfort (or homeostasis) for much longer if resources are depleted. This in turn has a negative impact on Trust and Fairness, and then on Collaboration; in short, on the psychological core. This, then, reduces the ability to deal with scarce resources and is compounded by interdependence, the presence of Unfits (uncontrolled Forces of Production, FPnc), and Distance. A negative cycle is triggered that can cause the project to capsize.
6.8.1 Vulnerability and conflicts
I assume that there is a correlation between perceived vulnerability (or perceived points of vulnerability) and conflicts. POVs are related, in essence, to |R and |T: the more an individual possesses each of these direct and indirect resources, the more invulnerable he/she becomes. Points of vulnerability present two interesting features:
They occur with a relative stable frequency from the mere fact that production, during the transformation phase, is partly repetitive.
The occurrence of an active point of vulnerability is independent from the time span of past occurrences.
These two features obey the conditions inherent to the law of Poisson; this means that over time, as POVs occur, confrontations tend to normalize. Put in terms of human experience, people get more and more accustomed to living with their differences, expecting that there will be occurrences of points of vulnerability as time goes on and accepting their stochastic occurrences. From this perspective, POVs tend to foster the normalization of conflicts; put differently, a system (a project) where fighting is prevalent points to the existence of POVs. This is the order of things: as people anticipate their vulnerability (i.e., as they feel their job is threatened by failures in the system they cannot or would not address), they become more defensive, less willing to trust and to be fair (as their own interests prevail over that of others at this point), and less inclined to collaborate.
As just mentioned, the normalization of conflicts, which is a function of the occurrences of POVs, is best described by the law of Poisson, as shown in Figure 6.16.

At a value of 7, which is the maximum level of Conflict on our scale (Hostile position > Defensive position), Conflict is deemed normal as the curve mimics a near normal distribution pattern (bottom left corner in Table 6.22). This explains one particularity of human behavior: the tendency to work amid or even to nurture confrontations, especially when POVs keep occurring. Put differently, there is a process of habituation (a phenomenon that is well documented in neurophysiology): a large number of POVs are initially deemed to be threatening, but the work environment is somewhat mellow.143 As time pressure mounts (there is a deadline for the project), the situation becomes more and more critical, yet points of vulnerability that were once considered to be discomforting are now seen as being of lower importance because people got habituated; they developed coping strategies whereby they view the problems as trivial (left tail), or whereby they regard them as serious (average), or whereby they consider them to be very serious (right tail). As time progresses, however, this tendency for normalization (habituation) keeps being reinforced. On average, in the end, the team pays less attention to potential difficulties induced by POVs,144 and fewer individuals join to counter them while confrontational episodes keep growing. Of course, if the occurrences of POVs could be predicted, the dynamic of human behavior would differ: the fact that team members in a given project know that POVs will inevitably keep popping up, but that the occurrences are not predictable because there are no time span correlations between past and present occurrences, creates an irritating environment. This provides a fertile ground for misunderstandings while, at the same time, team members develop coping strategies and habits, resulting in a culture of conflicts. From a project management perspective, this is the worst possible scenario, because things will only get worst.
An example of this dynamic is provided by the Stanford Prison Experiment.145 In this famous case, which changed the course of research in the academic community, a number of candidates (roughly 30) were chosen to play prison guards and inmates in a setting that emulated a prison. It took only a couple of days before the guards started to abuse their artificial power, trying to go around the rules of conduct that were placed upon them, and before some of the fake inmates began to truly believe that they were being victimized. The situation festered rapidly and soon became out of control. Much to the scientists’ surprise and dismay, it showed how quickly humans adopted predator and prey positions and stuck to them, at times vehemently, if not violently altogether.
This observation is important for project managers. People will tend to get accustomed to skirmishes as POVs keep occurring, with the result that they are expected to emerge and to become a privileged tool in trying to address POVs, a managerial approach that, of course, is counterproductive.
Conflict intensity may be particularly more acute in the early stages of the implementation of the project (but not in the vision or planning stage); as the deadline fast approaches, they are often tied to technical problems and procedures, prioritizing, and scheduling, but not to costs.
This leads me to the fifth law of project feasibility.
6.8.1.1 Fifth law of project feasibility: Law on conflicts
The more conflicts among stakeholders are intense, frequent, and cover critical issues, the less likely the project is feasible.
6.8.2 Solving conflicts
The PMBOK addresses conflicts to some extent and makes various recommendations for project managers: developing a vision, establishing effective communication, “getting things done” (i.e., being committed), motivating, negotiating, and solving problems.
Table 6.21 is a rendition of some various authors’ advice completed by my own comments.146

Some authors also computed the recurrence of conflicts in a list that I adapted to the four Ps as follows147 (in parenthesis are the number of conflicts at the start, during, and at the end of the project). In relation to Plans, the sources of problematic situations are priorities (35, 24, and 16), schedule (29, 36, and 30), and cost estimates (13, 15, and 11). For Processes, they are administrative procedures (27, 15, and 9) and technical changes (26, 31, and 11). Finally, for People, we have employees (25, 25, 17) and personality (19, 15, 17). At the start, there are a total of 174 sources of conflict; during the project, 160; and at the end, 111. Overall, the setting of priorities and procedures seems to be the redundant sources of problems; they both have an intimate link to resources.
As can be seen, the majority of conflicts take place during the starting (vision) stage of the project according to this research. This contrasts with my viewpoint probably because they are not defined in the same way: most likely, so-called conflicts at the vision stage are, in fact, benign disagreements; otherwise, it is unlikely that the project would have been given the go-ahead.
The theme that keeps recurring is “priority”. Indeed, the scarcer the direct and indirect resources are, the more dissensions are likely to surface. Put differently, the more critical (prioritized) |R and |T are, the more stress is generated and the more conflicts find a fertile ground from which to bloom. A point of vulnerability exists here with respect to the criticality of the access to resources. Thus, to enlarge my definition, such tensions are really a function of resources given the triple constraint, with time being exemplified in Table 6.21 by way of the notion of priority. Conflicts relate primarily to the three sides of the Bermuda Triangle: as the utility drawback looms larger and larger, the project itself is threatened, with people’s jobs and reputations being at stake.
As mentioned, various authors provide advice as to how to deal with these hellish situations. Some authors make extensive lists that include avoiding aggressive comments and tone, vilifying, and making judgmental inferences; building true (and not fake) trust; identifying oneself; saying “hello” in the morning; showing empathy; and so forth. I provide hereafter a few examples extracted from various sources.148,149 The strategies for physical conflict are being swift and ascertaining oneself; containing, dividing, and conquering; intimidating the opponent; leaving no vulnerable position open; sizing up the opponent; staying on guard; and verifying the facts. The strategies for emotional quagmire are given as follows: avoiding making judgments; letting down one’s guard; limiting futile argumentation; opening up and exposing vulnerabilities (I am not sure I concur with this recommendation); individualizing the response; pacing the conflict; seeking equality; and lastly, showing confidence by being open to vulnerability (Hmmm, not sure about that either!). Other recommendations have been made: in the case of divergence → resort to commitment; of guarded, censored, withheld information → encourage open communication; of impermeable feelings → work through disagreements; of people taking advantage of one’s vulnerability → try mutual trust (I am not sure this is the right strategy here; I can hardly see how a lonely sheep would want to entertain a hungry tiger on the virtues of friendship); of a cold, strained, unpleasant, formal atmosphere → nurture a positive atmosphere (easily said, but difficult to implement).
As can be seen from these lists, vulnerability (POVs), as well as Trust, Fairness, and Apprehension, comes into play when providing advice on conflict management.
6.8.3 A small study
I performed a small study to see how a resource could affect Conflict. I could not, for obvious reasons, deprive team members from a valuable resource and examine what would likely happen. Instead, I operated in a different way. I introduced a resource that I could control, that of a negotiating skill identified as Th and verified its impact on a small team before and after it was introduced, for two groups, one that received the training in negotiation (TG) and one that did not (UTG). This research was conducted in 2011 and 2012.
6.8.3.1 Core values
The two groups, UTG and TG, which received training or equivalently Th, were compared to see if there were substantial differences between them.
The UTG and the TG before and after values for the key constructs of Hostile-Defensive positions are shown in Table 6.22.

I observe that some of the Hostile position/Defensive position values changed significantly150 for the Hostile position construct and the Collaboration construct. There is a tendency for the 95 members of the Untrained Group (UTG) to develop Intrumentally hostile (IP) behaviors in the absence of training (Th). Collaboration levels were expected to rise since the members had a duty to collaborate. For both groups, the values indicate transactional relationships.
6.8.3.2 Structural equation modeling
I conducted an SEM151 for the before/after data, as illustrated in Figure 6.17.

I found that Apprehension (expressed as Defensive position/Hostile position) has a significant (negative) impact on Trust right from the beginning of the relationship between the members of the Untrained Group (UTG).
The 95 UTG members were invited to be part of a negotiation setting without prior preparation (without the indirect resource Th). While they tried to collaborate, their hostility “traits” spiked upward significantly. Perhaps this means that short of appropriate resources, people tend to resort to hostility, that is, to adopt a more hostile approach as a means of winning the negotiation. If this holds true, this is an indication that resources such as training are a good starting point to minimize hostile tendencies; in other words, a project feasibility analyst will look at the presence of training programs in the project plan as a means of assessing whether certain POVs can be kept under control.
Note that the 54 members of the Trained Group (TG) received a substantial amount of training in negotiation (Th), and the group had a similar sociodemographic profile to that of the Untrained Group (UTG). The Defensive value changed significantly; the participants with training chose to position themselves in a less victimized way (defensive) and ended up necessitating less hostile tactics.
The SEM152 for the TG (before/after) is shown in Figure 6.18.
The ratio of the Defensive position/Hostile position (Apprehension) construct versus Trust in the before and after periods was not significant (p = 0.416/0.635 > 0.05).

6.8.3.3 Discussion
One probable explanation for my results delves into the concept of an “asymmetry of information” (see Chapter 7): the trained individuals (TG) did not feel as threatened as their untrained counterparts (UTG) probably because they had better information. The cure to uncertainty is transparency; the cure to chaos is control.
Recall that I have connected Th with Rn (nonessential resources) and T (work) with R (essential resources) and that I have equated Commitment with efforts (direct (|R) and indirect (|T) resources). My results point to the fact that a surge in Th leads to better commitment, so that this would entail requiring a diminishing input of Rn during that stage, and, presumably, an increased input of R and a decreased input of T. In other words, POVs that are tackled by way of training also demand, at the same time, a rise in the supply of |R; the feasibility expert would be advised to look at training programs throughout the entire project, in not only one single stage or the other.
6.9 Chaos
Transparency—by way of training, for example—is key to a project’s success. At the same time, a certain level of control needs to be exercised, because the four Ps, once in the transformation phase, tend toward chaos. This is because the project is a closed dynamic system: there are theoretically no possible exits for behavioral outliers (e.g., FPnc) so that the entire system may become infected, so to speak, by antagonistic behaviors.
My model sets the boundary value of the Hostile position/Defensive position ratio at 4.6 (2.3 + 2.3) with [2.3 = 1 + k], past which it is assumed that the system becomes disorganized, even chaotic. The value 4.6 is, incidentally, near the Feigenbaum constant (4.669)153 in a logistic map function, which expresses chaos.
Based on some of my research, I set some equations we have already seen with respect to Trust and Collaboration into a logistic map function (which expresses a disjointed state and which is formulated as [xn + 1 = r xn(1−xn)]), as follows154:
Doing so, we obtain Table 6.23.

Recall that when I examined, in Chapter 5, the relationship between Trust and Collaboration, I found that they were substantially correlated, with an R2 (or estimators for SEM studies) of roughly 0.75 in most groups I (and other authors) analyzed. As can be seen from Table 6.23, the k-value that best meets the requirement of a high correlation between the constructs of Trust and Collaboration for an initial value of [Pretrust=0.3] as seen in Chapter 5, is indeed 1.3, the constant that is at the basis of my model.
6.9.1 A study
I looked at a database of my own, consisting of some 834 individuals spread across 19 different projects. I examined the way each of these 19 groups operated by attending their daily work once a week over several weeks. My observations are shown in Table 6.24 (see also Appendix 5.3).
k’ value | Observed behavior |
|---|---|
4.7 | Some tense erratic behaviors |
3– ≈2 | Some erratic behaviors |
≈2–1 | Fairly stable groups |
<1 | Group 7 and Group 11: These two groups showed a high turnover level |
I actually could find some of these groupings done by using the k’ value by way of a cluster analysis (Table 6.25).
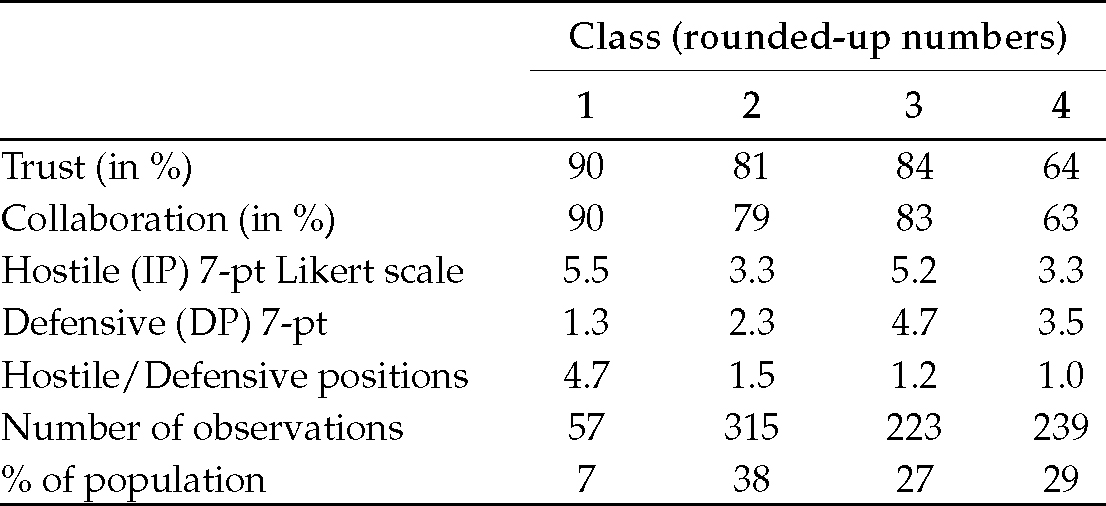
The class with a high Hostile position/Defensive position ratio (5.5 over 1.3 for a ratio of 4.7) is, of course, indicative of hostility. Over time, groups where the value of k’ was hovering over 4.7 or where the value tended to sit under 1.0 displayed dysfunctional behaviors: some members quit the project and a high turnover was observed.
The k’ values and corresponding behaviors that I witnessed tended to approximate a logistic map. As k’ approaches the Feigenbaum constant, the group became quite dysfunctional and sustained a lot of stress. I set the following equation, [Collaborationt + 1 = k (0.3 + 0.9 Trustt) (1-(0.3 + 0.9 Trustt)]:
where “Hostilityt + 1” is a behavioral manifestation of instrumentally hostile aggression (planned aggression) and “Hostilityt” represents defensive aggression (present reactive aggression).
It should come as no surprise that behaviors adopt a certain mathematical logic. Our biological body operates with some form of mathematical logic, the circadian rhythm controlled by the hypothalamus and red blood cell reproduction patterns being prime examples.155
Equation 6.5 entails that future hostility is a function of present hostility, which seems to make sense; this is indicative of retaliation. Unless proper conflict management is introduced in a closed dynamic system, such as a project, people will tend to become more and more aggressive in an effort to shield their gains and to avoid losses.
The logistical map function discloses the presence of loops. A loop, as it happens, is included in our six core competencies model (the t loop going from Commitment to Apprehension). Recall that we established that our model had sound neurobiological foundations (see Appendix 6.1). As it turns out, the brain is indeed equipped with self-regulatory loops. As seen before, there is efferent circuitry, leaving from the hypothalamus and going to the pituitary gland; however, there is no afferent circuit coming into the hypothalamus from the pituitary gland. Hence, hormones secreted by the pituitary glands must go through the entire blood system before reaching the hypothalamus, which will regulate their emissions and levels. Also, as another example, so-called Renshaw loops, permit immediate feedbacks once the neurotransmitter acetylcholine is produced in order to modulate muscle action and avoid overreactions.
From this perspective, my model, which was initially developed at the macroscopic level—examining groups of individuals and their psychological constructs—finds correlates in the way the brain functions.
This may be good news for the model: it stands to reason at both the macroscopic and microscopic levels. From a managerial point of view, project managers are spread between two opposite ends: one tending toward Collaboration and one toward hostility (read “Conflicts”) [Hostilityt + 1 = k Hostilityt (1−Hostilityt)]. The presence of intense hostility traits among the Forces of Production or of extreme hostile profiles or personalities is a marker of future problems. In the context of a project, there are only two options, as shown in Figure 6.19.

The level of one option gives the level of the other. In other words, the probability of success in terms of People only (irrespective of the three other Ps), rests in the maximization of functional collaboration and the minimization of dysfunctional conflict. Some scholars put it this way156: Hostile → neutral → friendly → teamwork. As it turns out and as mentioned, some of my research points to Conflict as being a moderating variable between Collaboration and Commitment. Some other researches posit that hostile profiles (hungry tigers) act as a moderating variable between Trust and Fairness, as shown in Figure 6.20.


These last two observations require more research; however, it is obvious that some level of strife may be constructive given specific circumstances.
6.10 Conclusion to Chapter 6
This chapter oversaw the third P of project management: People, in a dynamic context. People cannot be reduced to human resource management, although proper employee compensation and recognition are certainly a source of motivation, which can potentially lead to improved performance. People live with behaviors (and attitudes), beliefs, heuristics, and personalities; they clash; they engage in trust building and collaborative efforts; they judge based on fairness and performance; they display hostility or stability depending on their circumstances; and they generally long for some sense of pride in what they are doing. We have seen that Apprehension may exercise a strong influence on the psychological core that is Trust–Fairness–Collaboration.
Overall, projects are the making of People. POVs can affect any parts of the projects; in the end, it is People who identify the POVs, treat them, and achieve success. Top performers can be identified through an in-depth feasibility analysis where such effort is justified.
6.11 What we have learned about POVs: Chapter 6
POVs…
May play against People’s own welfare.
Diminish with People’s commitment.
Are related to the constant k.
Are best tackled by top performers.
Are linked to hostile behaviors.
Are, at their peak, composed by the people wanting to intentionally disrupt the project (hungry tigers).
Are related to |R and |T.
Foster the normalization of conflicts.
Affect Trust, which, being intimately bonded with Collaboration and a sense of Fairness, impacts Conflict levels.
Foster blind management when left unchecked.
Are, in part, unpredictable.
Demand employee training and the supply of |R.
6.12 Key managerial considerations: Chapter 6
Equilibrium in project management is a dynamic event; it is constantly challenged by circumstances and people.
Three simple questions may be posed to rapidly assess a project:
a. Are adequate managerial skills in place?
b. Do all the stakeholders trust the project and each other?
c. Are all the necessary resources available (|R and |T)?
Top performers (Stars) must be quickly identified and encouraged for what they bring to the team.
Weed out instrumental hostility; deal with hidden agendas and dysfunctional Forces of Production.
Address problems and conflicts right away; do not let things rot (they inevitably will).
6.13 Case 6: The MID: The best managed project in the world
Interview with Clément Demers, architect (Ordre des architectes [OAQ], fellow de l’Institut royal d’architecture du Canada [FIRAC]), urban planner (L’Ordre des urbanistes du Québec [OUQ], Institut Canadien des Urbanistes [ICU] or Canadian Institute of Planners [CIP]), and project manager (project management professional, PMP). He is the cofounder and was the general manager of the Montréal International District (known as QIM for Quartier international de Montréal in French, but will be referred to here as MID—“Montréal International District”—to avoid confusion with the “Montréal Olympic Stadium” [MOS] and the “Québec Multifunctional Amphitheatre” [QMA]). He is also a part-time professor and coordinator of the graduate studies program in project management at the School of Architecture in the Faculty of Environmental Design at the University of Montréal. The interview was completed in May 2016.
6.13.1 Project description
Question 1 (The author): “Please give us a description of the MID project:”
Answer 1 (Clément Demers):
“The MID project was (and still is) the largest urban redevelopment project to have ever taken place in Canada. It covers an area of 27 ha right in the center of Montréal, just between Old Montréal and the central business district. We planned 8 ha of pedestrian space such as parks, sidewalks, and streets. The project forecasted three stages with stages I and II to be completed by remodeling 7 ha of urban development. The stages included coverage of an existing highway (named Ville-Marie)—a trench that separates parts of the downtown business core of Montréal from Old Montréal—over 1300 feet.
Public squares and sidewalks were to increase by 40% with the creation of close to a mile of new interior pedestrian corridors embellished by 500 mature trees. The current area was to be completely refurbished and the highway fully covered. By comparison, the Big Dig Project in Boston was 25 times larger and its cost was 250 times higher.
The project eventually attracted a larger number of investment properties bordering the facilities. The modern core business center and the business center of Old Montréal used to be quite active until the 70s, before the Ville-Marie highway was built and cut it in two sections. Old Montréal features stone-paved alleys, large stone building with high ceilings and monumental wooden doors, all of which offer a cachet of old France. It is home to inimitable restaurants, numerous businesses, and a large church (“Notre-Dame”), which transforms into a media magnet when celebrities marry or when sorrowful and touching eulogies are pronounced. A 15 min walk suffices to reach the more modern Montréal business center, but one must cross over the highway.
A new business center was eventually developed around Place Ville-Marie (a set of high-rise towers). The Convention Center, built in 1983, forms a so-called bridge building over the Ville-Marie highway but does not provide sufficient access to Old Montréal.”
6.13.2 The project’s key calendar of activities
Question 2: “Could you give us an overview of the milestones of the MID project?”
Answer 2:
“The important dates were as shown in Table Case 6.A.
The calendar was fully respected.”
6.13.3 Need
Question 3: “To what need did the MID project respond to?”
Answer 3:
“The urban space now known as the MID is an area that provides access to Montréal for countless motorists coming from the United States and the rest of Québec and Canada.
The issue of the redesigning of the various highways that meet in the downtown core was originally raised because of climatic concerns, not because of pollution or business interests. The highways, built in the 1960s, aged prematurely due to the many cycles of freezing and thawing during the harsh Montréal winters and the consequent use of deicing salts. The economic development of the metropolis was certainly a priority. Indeed, Montréal had just come out of a recession and had an urgent need for a big project that could help revive its economy and image. We saw an opportunity to requalify this portion of the city to strengthen the bond between the main business district and Old Montréal.”
6.13.4 Goals
Question 4: “What were the primary goals of the projects?”
Answer 4:
“The first objective was to palliate the aging infrastructures. The second was to create a world-class district that would benefit Montréalers as well as visitors and international tourists. In this area, the Convention Center was already attracting a large international clientele. The quality of its equipment ranked second in North America. Several international organizations, including the International Civil Aviation Organization (ICAO), took offices there.
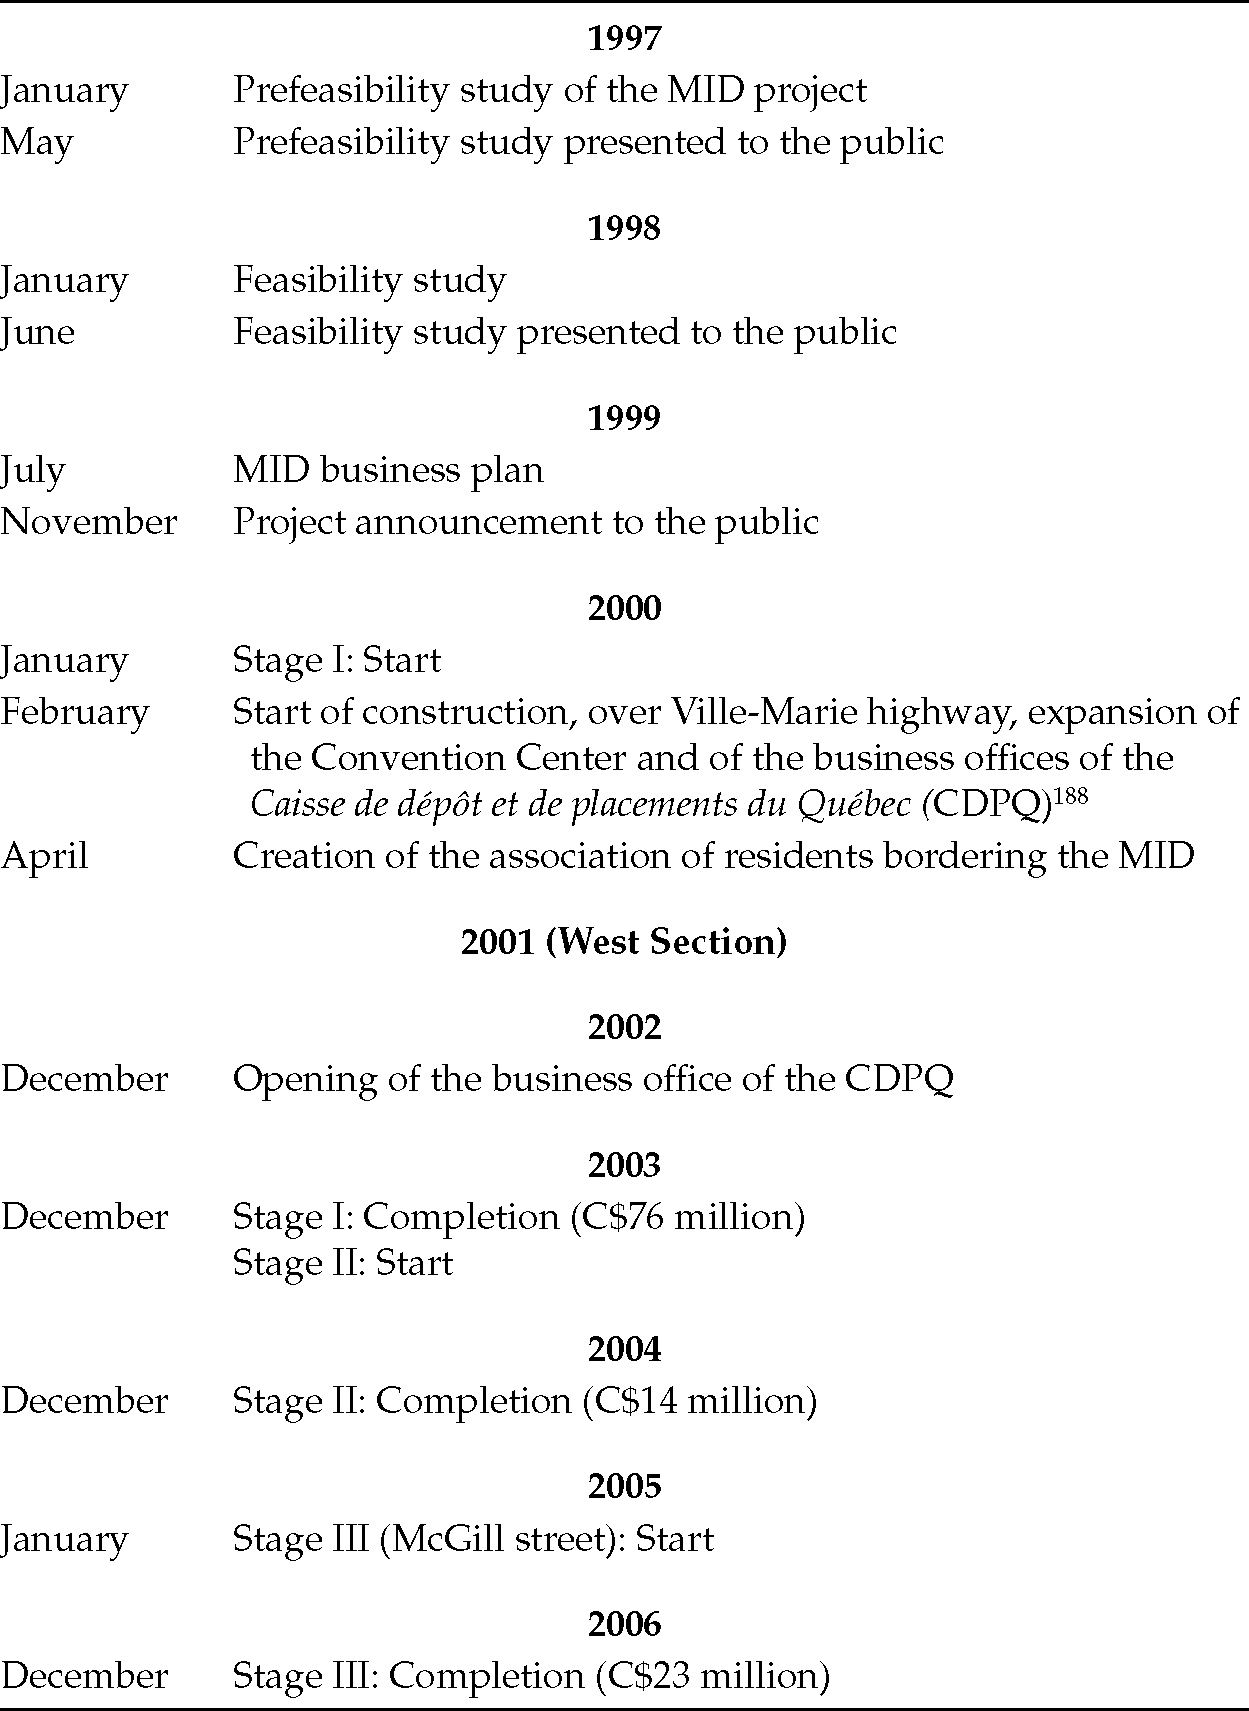
A third objective was the development of a sustainable urban environment. Initially, this project was not limited to cover the motorway; it was mainly intended to transform and enhance the urban environment. Coverage of the highway was therefore a means rather than an end in itself.
Also, we wanted to showcase our local know-how in the field of architecture, industrial design, landscape architecture, planning, project management, and, of course, urban design. Our creators had encountered some difficulties to break through internationally in these creative fields. Many people thought that Québecers were only able to stand out in the show business—think of Celine Dion and the Cirque du Soleil, for example—when in fact they are also very adept in other artistic fields.
Another objective was to promote walking and public transportation.
In summary, the objectives of the MID were multiple: we wanted to offer an attractive, upgraded district that would attract real estate development and benefit from a leverage effect—as infrastructures improved, so would business investments in the area. We realized that it was also essential to develop indoor parking and pedestrian access, and to upgrade public spaces.
Between 1999 and 2006, the increase in traffic in the subway stations was of a tiny 1.52% in downtown Montréal. After the completion of the project, the traffic in the MID area rose by 15%, almost 10 times more than in the rest of downtown, all thanks to the new real estate development, which included offices and some 2000 residential and hotel units.”
6.13.5 Challenges
Question 5: “What were some of the challenges you faced?”
Answer 5:
“The project was a first for Québec’s Ministry of Transportation. It contained many challenges, especially with the covering of the existing highway. From an engineering point of view, the implications are very different depending on whether a highway is a trench or a tunnel. Among the issues that concerned the ministry were the operational costs of the tunnel, the air circulation, and the dust and noise levels. Most notably, passage of dangerous goods in tunnels are forbidden. In a city like Montréal (which is an island), alternative routes for the transportation of hazardous materials by trucks are rare. The work had to be done at night, which caused some noise and kept nearby residents awake. To handle all that traffic on the highway was a very tortuous procedure indeed.
The initial investment and annual operating costs did not come with a guarantee that business-related revenues would follow suit. Other elements to take into account included allowing for the risks of accidents in the tunnel; establishing a fund to cover maintenance costs; finding support from sponsors to cover future operating costs; mitigation measures during construction to ensure the work could be done efficiently; securing title deeds in order to provide access to the site at all times; and securing the capacity to maintain the infrastructures. Costs included the initial investment—not only the operating costs but also reinvestments in infrastructures. As an example, while tiles are sturdy, communication devices and lighting have a limited life span of 5–10 years, especially in Canada due to salt spraying during winter. Thus, they must be replaced regularly. Typically, the operating cost of a covered highway is five times higher than that of a trenched motorway.”
6.13.6 Stakeholders
Question 6: “Who were the key stakeholders and what were their roles?”
Answer 6:
“This project was conceived as a public–private partnership that saw many partners working closely together. The promoter, the Caisse de dépôt et placement du Québec (CDPQ), had been involved in the project of the World Trade Centre in Montréal (not the one in New York City), built in the same area. The largest landowner was the City of Montréal, which owned all public and civic spaces in the area. As for the Government of Québec, it owned the highways. For its part, the Government of Canada provided financial support to the project. The main fund providers were therefore public. Local owners formed a group named the Association des riverains du Quartier international de Montréal, which helped with the project with great enthusiasm.
The project enjoyed the support of many partners and one not-for-profit organization; the company the Quartier international de Montréal (MID) was born thereafter. It was mandated by the city to coordinate the project. Other stakeholders included a board of directors, the management team and a group of professionals under contract with the architecture and design firm named Daoust Lestage Inc. (which submitted the original idea of the project). Partners such as some of Montréal’s large corporations and even foreign investors poured funding in for the implementation of some of the project components. Some of the key players included those shown in Table Case 6.B.
We all worked together to attain our goals.”
6.13.7 Stages
Question 7: “Describe to us the different implementation stages of the project.”
Answer 7:
“The project developed in three stages: the first stage took place between 2000 and 2003 and the second between 2003 and 2004. The first deliverables consisted in improving the infrastructures. The highway, the exchanger, and the metro were underground. This sector already included the largest concentration of optic fibers in Canada; major sewers and high-pressure water systems were present.

The highway’s coverage was the second deliverable; this included the construction of bridges and the building of a parking lot. The Convention Center was expanded; protected pedestrian sidewalks were extended and a cultural showcase area was designed to promote the works of art by local artists of international caliber. Finally, a pedestrian signage system was put in place and we renovated the accesses to the subway network.
The third deliverable would see the redevelopment of the public spaces and streets covering a total surface of 8 ha, part of which represented a 40% improvement compared with the existing pedestrian area. This increase was reflected in the widening of sidewalks, the installation of new public squares (Place Jean-Paul Riopelle), the execution of an important canopy consisting of 500 large-caliber trees, as well as the installation of public fountains and urban art. In the end, this endeavor offered an attractive center that encouraged property development. Soon, access to the metro, adjacent to a sophisticated landscaping area, almost tripled.”
6.13.8 Impacts
Question 8: “What were the impacts of the MID?”
Answer 8:
“More than C$700 million of real estate developments in five years and more than C$2 billion after ten years have enriched the district with such business infrastructures as brand new hotels.
The first investment by the City of Montréal, which was of C$14 million, brought in C$20 million a year in property taxes immediately at the completion of stage II, in 2004. As for the Canadian government, its initial investment of C$30 million led to revenues, by way of direct and indirect taxes, of C$42 million plus an additional recurring revenue of C$6.6 million/year. The project has attracted foreign currencies as international congresses have multiplied. Tourists have discovered the city and real estate investors have invested in Montréal. The project allowed those who participated, including designers, to obtain contracts abroad.
The project accumulated a striking number of awards in a variety of fields: in all, 32 national and international awards were received covering 15 different areas—arts and design; business, economic development; engineering, environment, and project management including design and urban development; landscape architecture; real estate, innovation, industrial design; sustainable development; tourism and urban design; transportation; and urban planning. In 2005, it received the “Project of the Year” award given by the Project Management Institute (PMI) as it was judged the best managed project in the world.”
6.13.9 Key Success Factors
Question 9: “In what way was the project a success?”
Answer 9:
“The project respected the schedule; was completed under budget and all the high-quality objectives were met; this was achieved without conflicts or complaints.
A number of factors or actions can be associated with our success.
A favorable context (Plan): The MID project was the result of a long process. It corresponded to the needs and expectations initially set forth; it had the support of stakeholders who were eager to develop an international neighborhood.
The initial capital (Plan): An initial investment of C$35,000 paid for a small commissioned team to design the project, allowing it to make the project appealing to the City of Montréal, the financial institutions, the governments, the neighbors, and the potential sponsoring partners. A second down payment covered the feasibility study. It provided a pristine vision of the project and of its targeted quality standards.
Sustainable development (Process): Our goal of ensuring sustainable development was supported by a strong will emanating from the designers and managers involved; our focus was on quality—the quality of the concepts from start to finish, the quality of materials, the quality of realization, and finally, the quality of operation and maintenance.
Competencies (People): Professionals were hired on the basis of experience, talent, and skills, rather than on their tenders. There is a big difference between skills and talents. It is the soul and creativity, the art of thinking and thinking outside the box that typifies the talent and the special quality of a project. These criteria were favored in the choosing of the project’s various teams.
Autonomy (People): The various teams enjoyed great operating autonomy. A clear vision and a limpid decision-making process made this feasible.
Commitment (People): Team members made the necessary compromises and avoided divergent orientations. People committed wholeheartedly to the project.
Leadership (Power): A project of this nature must be driven by a strong and committed leadership. The CDPQ played a predominant role. Its president at the time, Jean-Claude Scraire, manifested an ongoing adherence to it from beginning to end, and encouraged consistency of efforts, as well as the promotion and the pursuit of the project’s objectives.”
6.13.10 Lessons learned
Question 11: “What have you learned throughout this project in terms of its value?”
Answer 11:
“I learned that it was possible to grow together, as a team, even though our project was ambitious. We knew it was inspiring and feasible. That was our source of motivation; we maximized our calendar of tasks and activities and aimed for efficiency. We individually and collectively put all the energy and passion toward this project. It was a win-win situation for all the participating stakeholders, including the managers, the City of Montréal, the various institutions, and the users.
Such a project is nothing other than a great source of pride for everyone. It just feels good.”
The author: “Thank you, Mr. Demers, for having shared your enthusiasm with us.”
6.13.11 Appendix A of Case 6: Pictures of the MID157


6.13.12 Appendix B of Case 6: Awards won by the MID158
2008 | Mention d’honneur—Concours international de design urbain: Biennale de Quito2008 Prix Brownie 2008—meilleur projet toutes catégories: Canadian Urban Institute Prix pour le meilleur projet d’aménagement—Place des designers québécois 2008: 9ème conférence mondiale de la FIV sur le vieillissement Grand prix d’excellence en transport 2008—Prix Transport collectif: Association québécoise du transport collectif Urban Leadership Award 2008: Urban Renewal Canadian Urban Institute |
2007 | Mention 2007: Mouvement québécois de la qualité |
2006 | Prix Fondateur—Élexir 2006: PMI Montréal Prix national de design urbain 2006: Institut royal d’architecture du Canada |
2005 | Mention spéciale 2005: METROPOLIS, Berlin Project of the Year Award 2005: Project Management Institute (PMI), Pennsylvania Certificate of recognition 2005: Project Management Institute (PMI), Pennsylvania Prix Ulysse 2005—Attraction touristique—50,000 visiteurs ou plus: Tourisme Montréal |
2004 | Prix d’excellence en architecture—Design Urbain 2004–2005: Ordre des architectes du Québec Prix du Choix des enfants 2004–2005: Ordre des architectes du Québec Prix spécial du jury 2004: Nouveautés touristiques Bienvenue Québec Prix Thomas-Baillargé 2004: Ordre des architectes du Québec Prix Entreprise 2004: Institut de design de Montréal Prix Canada (urbanisme) 2004: Institut de design de Montréal Prix de la Métropole (architecture du paysage) 2004: Institut de design de Montréal Prix infrastructures urbaines 2004: Association du génie-conseil québécois Prix d’excellence en immobilier 2004: Institut de développement urbain du Québec Gold Award 2004: Urban Design National Post Design Exchange Awards Prix Orange 2004: Sauvons Montréal Prix aménagement 2004: Les Arts et la Ville et Télé-Québec Mention prix orange 2004: Transport 2000 Gold Award 2004: Landscape Architecture National Post Design Exchange Awards Prix du public 2004: Nouveautés touristiques Bienvenue Québec |
2003 | Prix du design industriel 2003: Salon international des inventions, Genève Médaille d’or 2003: Salon international des inventions, Genève Prix Canada (design industriel) 2003: Institut de design de Montréal Plaque témoignage 2003: Destination centre-ville |
6.13.13 Questions related to Case 6: The Montréal International District
Please find the POVs in this case, if any.
Please explain in what way a project that is well designed, well planned, and that has the support of all the key stakeholders produces tangibles that exceed its original goals and targeted intangibles that can help foster economic development.
6.14 Appendix 6.1: The brain and the hypothalamus
Some scientists provide a useful description of the hypothalamus,159which in humans is the size of an almond160: “Almost every major subdivision of the neuraxis, or central nervous system (CNS) communicates with the hypothalamus and is subject to its influence”. The same authors add: “hypothalamic structures are thus able to recruit a sequence of motor acts that appear in logical order.”161
The hypothalamus is a very special brain area: it is an archaic structure that generates strong reactions, which are, however, exempt of full cognitive control. It is autonomous and yet it is in partnership with the autonomic nervous system (ANS), which controls, among other vital functions, heartbeats and sleep patterns. It communicates with other brain structures through hormones and neurons and produces its own so-called pleasure chemical—nitric oxide, NO. It operates on a two-speed system: a slow one (neuropeptids) and a fast one (neuromediators/modulators).
The hypothalamus is involved in the body’s visceral and most fundamental activities: (1) blood flow (cardiac, renal function, etc.), (2) energy metabolism (body temperature, food, water, and sleep), (3) growth162, (4) reproductive functions (sex, pregnancy, and lactation), and (5) responses to threats (stress hormones, sympathetic, or parasympathetic tone, etc.).
As previously mentioned, the hypothalamus is in charge of the body’s homeostasis; it can deploy defensive rage, also called “sham rage”163 through its ventromedial section when needed. It has been explained that “the medial hypothalamus (…) provides a mechanism that modulates feeding, generates affective processes, such as rage behavior, in animal and people.”164 The medial hypothalamus also promotes escape as a coping mechanism for dealing with threats while the lateral hypothalamus is in charge of instrumental aggression.165
The hypothalamus, the center for the four core coping mechanisms (one offensive, three defensive) receives inputs from various parts of the brain and sends outputs to various parts of the brain in return. In some cases, there are reciprocal connections, in some others, such as with the pituitary gland, this does not occur. This last comment is crucial for the model I have presented: the hypothalamus sends efferent and vascular connections to the pituitary gland, and both, together with the adrenal glands, form the “hypothalamic–pituitary–adrenaline,” (HPA) axis, in charge of fast responses to stressful stimuli. However, as discussed before, the pituitary gland does not reciprocate to the hypothalamus; the hormones produced in the pituitary gland (some under the influence of the hypothalamus) do not go right back to the hypothalamus; they must enter the vascular system (the blood), which, circulating through the entire body, will eventually reach the hypothalamus where they will pass on important information on the state of the body. My model takes into account this biophysiological dynamic: there is no direct arrow going from the construct of Trust (associated with the amygdala) to the construct of Apprehension (associated in part with the hypothalamus).
The amygdala is an important brain structure related to sensory perceptions through the thalamus and to the memory through the hippocampus, and is linked to attachment (and thus to trust). Indeed, the amygdala plays a central role in emotions such as trust and attachment, in socialization and in the expression of contextual fear and hostility avoidance.166 The anterior, cortical, medial, and basomedial amygdala are related to defensive rage, but not to predatory attack; the central, lateral, and basolateral amygdala are associated with predatory aggression but not with defensive rage.167 The thalamus is connected to the prefrontal cortex where cognitive functions take place. The HPA axis is coupled with the HPG axis, where G stands for gonads—this refers to sexual activity and testosterone release in particular. Predation cannot be understood from the HPA alone; it must include the HPG axis as well. In the animal kingdom, withdrawal or loss of necessary food resources activates the HPA168; this may lead to potential, calculated aggression (search for meat for carnivores). Imminent threats lead to defensive reactions.169
Table Appendix 6.1 provides some clues as to how the brain works.
6.15 Appendix 6.2: An understanding of hostility
Defensive aggression (rage) is indeed different from instrumental aggression (predation). Animals that experience rage hiss, lunge, and attack.170 Predators show their teeth, bite, and attack. Some authors171 emphasize the difference between the two types of aggression as follows: affective (defensive) aggression is impulsive, overt, and unplanned; while instrumental aggression is without emotion, goal directed, planned, and sneaky. It is not preceded by autonomic arousal, such as an acceleration of heart rate. In sharp contrast, “anger entails physiological arousal (e.g., increased heart rate and blood pressure) and preparation for verbal and physical aggression.”172 Studies with cats (which display easily measurable reactions such as hissing and hair erection) show that irritants do indeed cause defensive rage.173
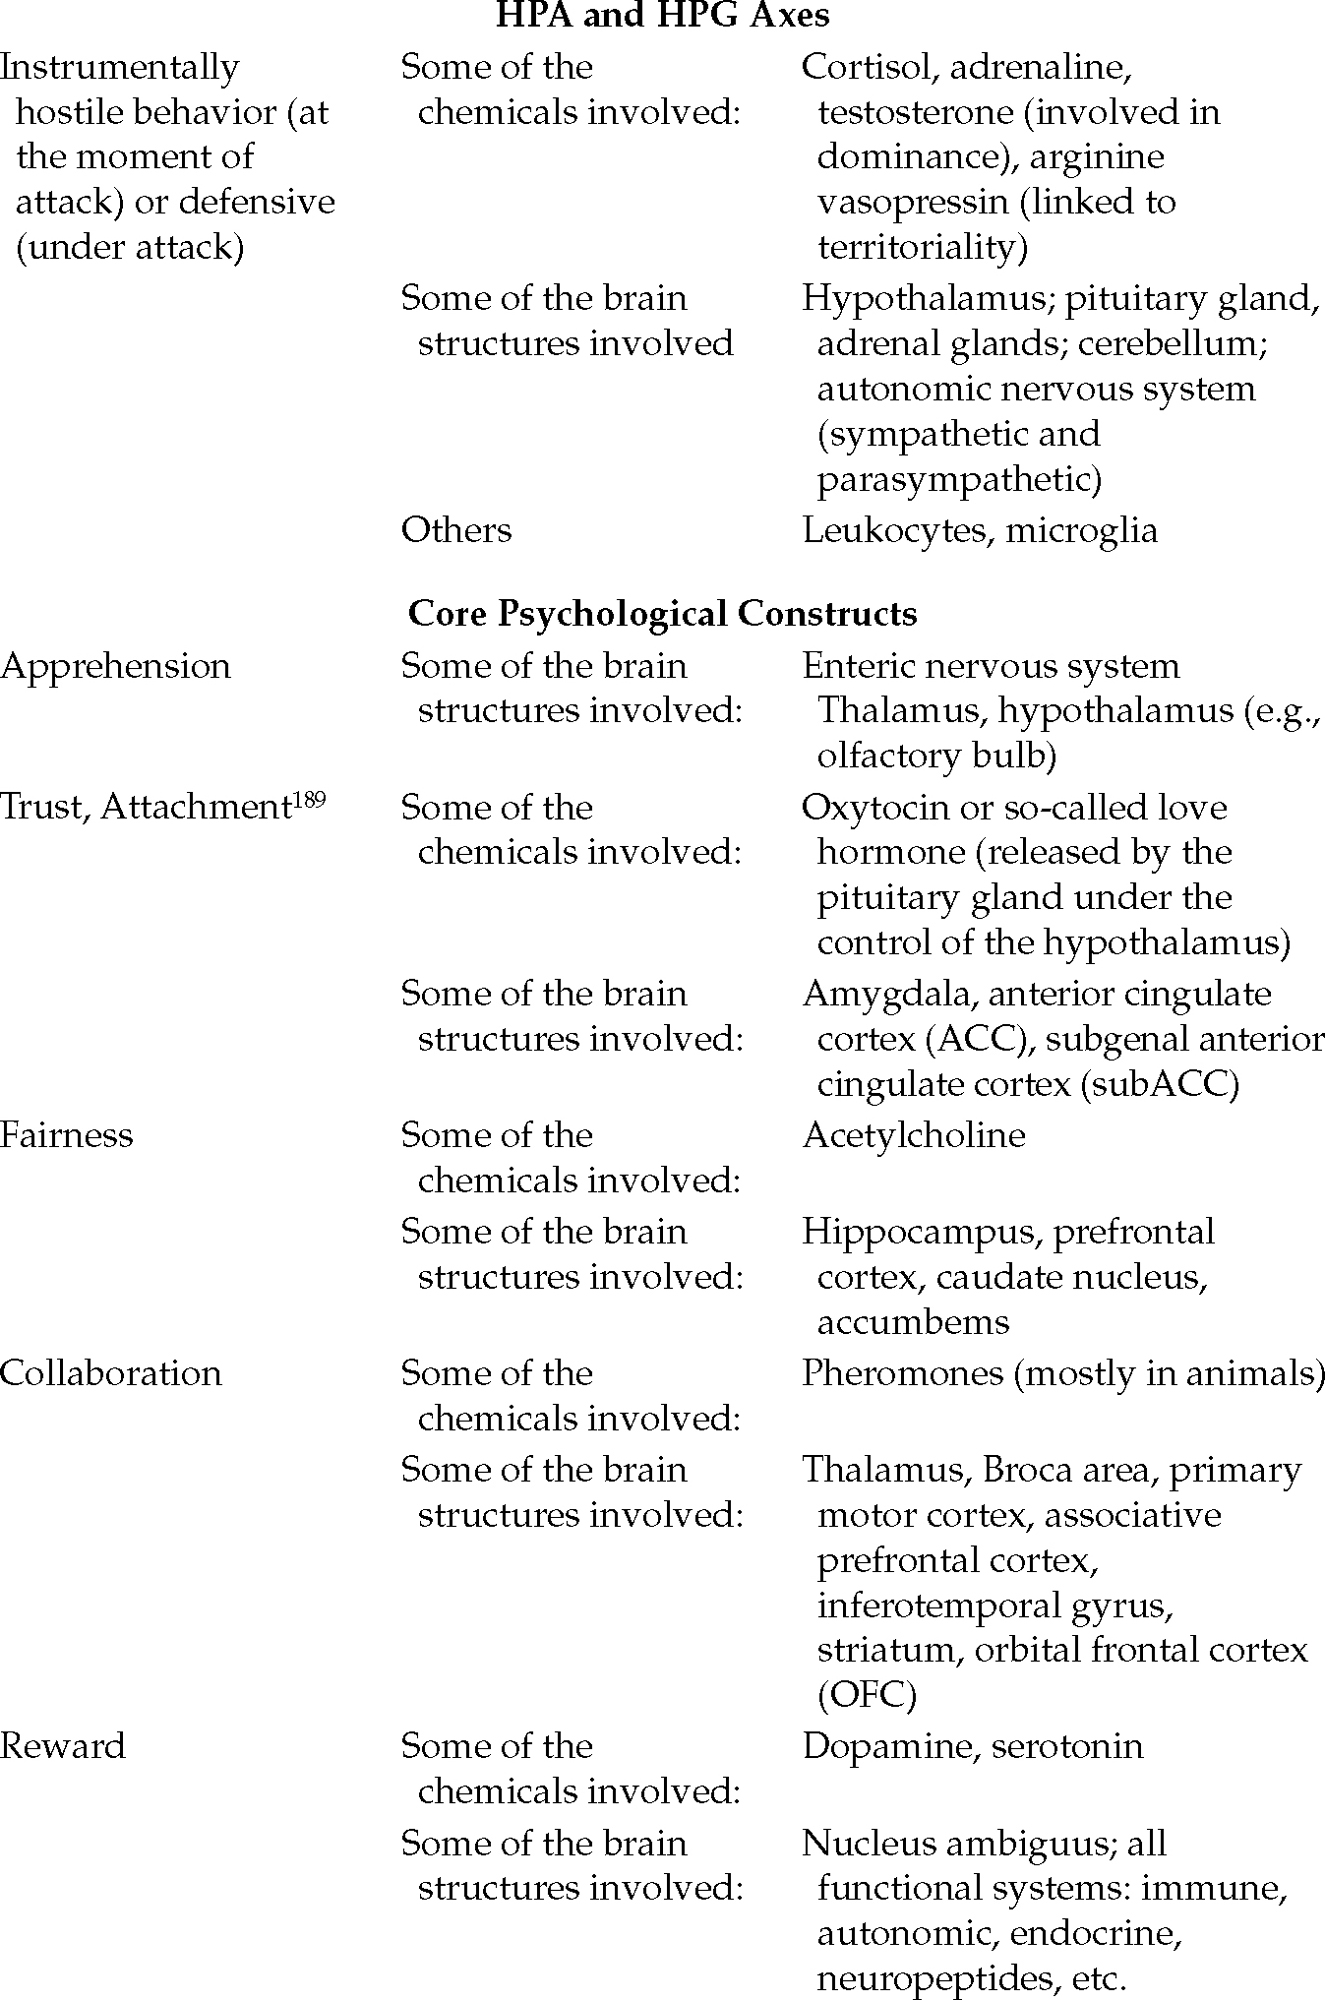

In the case of both defensive aggression (rage) and instrumental aggression (predation), levels of testosterone (T) and cortisol (CRT) play a crucial role. The T-to-CRT ratio is a marker of readiness to social aggression.174
Serotonin is linked to impulsivity in both animals and humans.175 Low levels of fast-acting serotonin encourage high impulsivity, and promote lower levels of fear and anxiety176 while provoking hyperresponsiveness by inhibiting prefrontal control. High levels of serotonin foster prosocial behavior, which begs for some prefrontal cortex activity177 when in a non-threatening context. The determining differentiator between defensive and instrumental aggression is therefore impulsivity. A high T/CRT ratio with low serotonin levels leads to defensive aggression. High levels of serotonin in a threatening context encourage instrumental aggression,178 which entails highly focused activities and strategies.179 About 10% of the serotonin, which is a neuromodulator, is found in the neighborhood of neurons (but not in the synapses) of the central nervous system (CNS), which regulates appetite, mood, and sleep. The balance of it (90%) is found in the enterochromaffin cells in the alimentary canal (gut) where it regulates intestinal movement. The enteric nervous system, which is a network of neurons attached to the intestinal walls, is connected to the brain by the vagus nerve. Thus, there is an important role played by the gut in experiencing apprehension. This is something we have all experienced through “gut feelings.”
Testosterone is a steroid hormone (produced through the hypothalamic–pituitary–gonad axis—HPG); it is linked to aggressive, antisocial behavior and sensation seeking.180 As put forth by some authors: “Testosterone inhibits the function of the HPA axis and associated autonomic systems, reducing sensitivity to punishment. In contrast, cortisol is thought to empower the sensitivity to fear through suppression of the hypothalamic–pituitary–gonad (HPG) axis.”181
Cortisol is a steroid hormone that is strongly associated with social withdrawal and a reduction in the activity of the immune system. It is initiated by the hypothalamus in response to stress (through the hypothalamic–pituitary–adrenal axis—HPA). A high T/CRT ratio suggests a high propensity for aggression (either defensive or instrumental) and a low tendency toward socialization.
A high T/CRT ratio with (in part) high serotonin levels leads to Instrumentally hostile aggression: this is characterized by highly focused activities and strategies.182 Therefore, what differentiates defensive from instrumental aggression is time, expressed as fast (impulsive) versus slow speeds.
I hypothesize that impulsivity is not only a function of serotonin levels, but also of the neuropeptide hormone oxytocin, which is produced by the posterior pituitary gland under the control of the hypothalamus.183 Oxytocin has been found to be involved in the nurturing exhibited by mothers toward their infants.184
A social individual with a very low level of dependency will likely display less impulsivity because their life is not deemed to be threatened, as they are independent. However, someone who depends on others will likely respond very rapidly and strongly to a threatening stimulus.
I hypothesize that the serotonin (5-HT) to oxytocin (OXT) ratio, less known than the steroid-based T/CRT ratio, can be regarded as a measure of impulsivity. Both hormones play a role in impulsivity: low levels of serotonin mean low levels of sociability and low levels of oxytocin are linked to a lower sense of attachment. Their ratio can serve as a marker for impulsivity. I propose the model shown in Table Appendix 6.2, which we have discussed previously.
| High (T/CRT) (steroids) | Low (T/CRT) (steroids) |
|
|---|---|---|---|
Low impulsivity | Predation | Freeze | High (5-HT/OXT)(hormones) |
High impulsivity | Rage (resistant-defensive) | Flight (escape192) | Low (5-HT/OXT) (hormones) |
This information will become handy when discussing my neurobiological research in Chapter 7.
Endnotes
- Bowlby (1973).
- Recall that contingency and short behaviors are two different positions.
- Examples: Al-Maghraby (2008), project name: “itSMF Egypt Chapter,” year of project: 2007; Brière et al. (2013), “Equality within the Moroccan public administration,” 2005; Consoli (2006), “Australian prisons,” 2000; Genus (1997), “Channel Tunnel” (Europe), 1994; Graham (1996), General; Hodgins et al. (1978), “Temagami,” 1901; Musali (1998), “Mt. Elgon region” (USA), 1997; Vam Marrewijk (2007), “Environ Magaproject”: 199
- The human brain is equipped to organize information along a temporary dimension, which involves memory (e.g., mediated for episodic events by the hippocampus), the present, and the future (e.g., the dorsolateral, ventrolateral, ventromedial anterior prefrontal, and anterior cingulate cortex systems)—see Lewis (2005).
- The hypothalamus controls the sense of food satiety, for example.
- Recall the Italian Floortrite example.
- Food foraging in animals is planned for immediate consumption as well as future consumption (e.g., by hiding food) depending on the level of threats exercised by nearby predators—see Hinds et al. (2010).
- The less one has useful information (Th), the more one perceives external stimuli as potential risks (see Wang et al., 2011).
- The case on Sea Crest Fisheries relates this to quality: the core constructs of Trust, Fairness, and Collaboration, when functional, lead to commitment to quality efforts.
- Recall the function of Fairness as being [z' – β0 Collα Trust(1−α)].
- See Dillon and Taylor (2015, p. 100); PMI, 2002; Napier et al. (2009); Skulmoski and Hartman (2010).
- Pinto (2014, p. 385).
- Clark and Wheelwright (1992); Hobday (2000).
- Thakurta and Suresh (2012).
- Barbin and de Oliveira (2006, p. 2325).
- See Thakurta and Suresh (2012).
- See Al-Maghraby (2008), project name: “itSMF Egypt Chapter,” year of project: 2007; Barbin and de Oliveira (2006), Brazil, General; Brière et al. (2013), “Equality within the Moroccan public administration”: 2005; Chen and Partington (2004), General: circa 2000; Consoli (2006), “Australian prisons”: 2000; Creasy and Anantatmula (2013), General; Genus (1997), “Channel Tunnel” (Europe): 1994; Graham (1996), General; Hodgins et al. (1978), “Temagami”: 1901; Musali (1998), “Mt. Elgon region” (USA): 1997; Ogunlana et al. (2002), Bangkok (Thailand), General; Pheng and Leong (2001), “Tee Tong Pte Ltd (TTPL)”: 1970; Senaratne and Udawatta (2013) Sri Lanka, General; Vam Marrewijk (2007), “Environ Magaproject”: 1996
- Consoli (2006 p. 77).
- Gray and McNaughton (2000, p. 43).
- Gray and McNaughton (2000, p. 44)
- PMI (2008).
- Eibl-Eibesfeldt (1971); Plutchik (1980).
- Davies and Brady (2000, p. 62).
- The recently published DSM-V could be reformatted by using my modeling system: the Instrumentally hostile position/Defensive position construct would fall into the category “schizophrenia spectrum and other psychotic disorders; paraphilic disorders”; the Trust construct (including confidence) (emotions) would belong to the “bipolar and related disorders; depressive disorders; anxiety disorders; obsessive-compulsive and related disorders; trauma- and stressor-related disorders”; the Dependence construct would relate to “substance-related and addictive disorders”; the Fairness/win-win construct (cognitive) would be integrated into the “neurodevelopmental disorders; somatic symptom and related disorders; neurocognitive disorders”; the Collaboration construct (social) would be associated with “disruptive, impulse-control, and conduct disorders”; the Commitment/Reward construct would relate to “feeding and eating disorders; sleep–wake disorders; sexual dysfunctions,” and finally; the Self construct (the project identity in a project context) would fall into the “gender dysphoria; dissociative disorders; and personality disorders.”
- DSM-IV (1996, p. 138).
- Dulewicz and Herbert (1999).
- Ogunlana et al. (2002, p. 392)
- Creasy and Anantatmula (2013).
- For example, Costa and McCrae (1992).
- Norman (1963); Goldberg (1990).
- Thomas and Kilmann (1975); Wood and Bell (2008).
- Tyler and Newcombe (2006, p. 37).
- Barrick et al. (2001).
- Tett et al. (2003); Waldman et al. (2004).
- For example, Bowlby (1973).
- Sometimes referred to as avoiding/escaping, secure, anxious/preoccupied, and hostile/resistant.
- Mikulincer et al. (2002).
- Folkman et al. (1986)
- Lösel and Schmucker (2004); Bakamitsos (2006); Mobbs et al. (2009).
- Mikulincer (1998); Johnson et al. (2009); MacLaren et al. (2010).
- These equations apply to predator–prey dynamics; in essence, the population of each one is dependent on the other and varies over time to ensure that overall both populations survive.
- I shall explain in more detail that there are actually two types of hostility: instrumental and defensive. Instrumental hostility is referred to as IP or “Instrumentally hostile position” and defensive hostility as DP (for “Defensive position”).
- See Mikulincer and Shaver (2007).
- Contingency position is ignored in this section. The brain relies on two general positions under perceived threat: hostile and defensive aggression.
- See Mulcahy (2013, p. 392).
- The hypothalamus acts as a biological clock “A principal function of the hypothalamus is to impose temporal organization on hormonal and behavioral processes by virtue of the timekeeping properties of the biological clock in the rostral hypothalamus” (Squire et al., 2003, p. 901).
- The hypothalamus is equipped with sensors that detect heat, hunger, libido, thirst, time of day, and so forth.
- Mobbs et al. (2009, pp. 12, 236); see also Squire et al. (2003); Purves et al. (2004).
- Woody and Szechtman (2011).
- MacLaren et al. (2010).
- We will see that instrumental hostility is, in fact, and from a certain perspective, a defense mechanism; the difference between it and the purely defensive mechanisms (freeze, flight, and resistant fight) is that it is spread over time and involves advanced cognitive capabilities.
- Adams (2006).
- Predation is closely linked to the action of neuropeptides that are released by the hypothalamus and that support “specific mammalian agendas (e.g., nurturance, predation, defence” (Lewis, 2005, p. 181), and that are connected to aversive behaviors (fear)
- Siegel and Sapru (2011).
- Bear et al. (1996).
- Eibl-Eibesfeldt and Sütterlin (1990).
- Gray and McNaughton (2000, p. 95).
- for 1901, see the Temagami project (Hodgins et al. 1978); for 1970, see the Tee Tong Pte Tld (TIPL) project (Pheng and Leong, 2001); for 1993, see the Pendjari National park (PNP) project in Benin (Idrissou et al., 2013); for 1994, see the Channel tunnel in Europe (Genus, 1997); for 1996, see the Environ Megaproject (Van Marrewijk, 2007); for 1997, see the project M. Elgon region in the USA (Musali, 1998); for 2000, see the Australian prisons projects (Consoli, 2006); for 2002, see the Ironic Infrastructure project in Australia (Rose and Manley, 2010); for nineteenth to twentieth century, see the new Acropolis Museum (Fouseki, 2006), and; for General, see the case of Sri Lanka (Senaratne and Udawatta, 2013).
- Gregg and Siegel (2001).
- At least in cats, defensive and offensive (instrumental) aggression cannot occur simultaneously: the medial amygdala suppresses predatory attack behaviors (originating from the lateral hypothalamus) (Han et al. 1996).
- Gray and McNaughton (2000, p. 7).
- We will see these brain parts again when discussing an fMRI study in the chapter on power.
- See Terburg et al. (2009); Gray and McNaughton (2000); and Siegel and Sapru (2011) in particular.
- Amsel (1992).
- Siegel and Sapru (2011, p. 215) write that: “the medial hypothalamus (…) provides a mechanism that modulates feeding, generates affective processes, such as rage behavior, in animals and people.” The central amygdala has connections with the lateral hypothalamus (seat of instrumental aggression in cats—see Siegel and Sapru, 2011) and the medial hypothalamus (for defensive aggression in cats) (Campbell, 2008). Bear et al. (1996, p. 452) mention that “displeasure centers, or negative-reinforcement sites are located in more medial portions of the hypothalamus and lateral parts of the midbrain tegmental area.” It is noted that stimulation at these locations may elicit fear or activate an urge to flee in a negative-reinforcement situation. The PAG is “activated by an immediate threat, by an immediate dominant conspecific, by pain” (Gray and McNaughton, 2000, p. 31). The PAG “may then be the most important node through which information passes during fight, flight, and freezing.” (Gray and McNaughton, 2000, p. 32). The central amygdala entertains key connections with the lateral hypothalamus (responsible for predation in cats—see Siegel and Sapru, 2011, and nociceptive modulation in rats—see Safari et al., 2009) and the medial hypothalamus (for defensive aggression in cats) (Campbell, 2008).
- Amaral (2002).
- Perceived threat can affect the brain and induce strong, automatic reactions.
- Blanchard and Blanchard (1989, p. 75).
- Rosebloom et al. (2007).
- Plutchik and Platman (1977, p. 420).
- Graham (1996, p. 68).
- Wood and Bell (2008, p. 130).
- Consoli (2006, p. 81).
- Senaratne and Udawatta (2013, p. 60).
- Senaratne and Udawatta (2013, p. 60).
- Ohlendorf (2001); Creasy and Anantatmula (2013).
- Dependence was measured with two questions. Of course, I recognize that this makes the evaluation of dependence rather weak.
- Bowles (2000).
- Pelletier (1993).
- Carney et al. (2010).
- With Trust measured here on a scale from 0 to 100.
- This remains largely hypothetical but serves my purpose of trying to explain human behavior in the context of projects.
- I have tried many times over but it has proved to be quite challenging.
- I measured intention only, not whether participants actually stayed in the group or not.
- SEM does not check for normality of population.
- Durbin–Watson = 1.701; F = 3,651.781, p = 0.000; normality of residuals.
- SEM analyses cannot be used to check the law of apprehension (perceived threat).
- My questionnaire has gone through extensive psychometric testing and reliability tests, and was even checked by a lawyer to ensure that it met its objective.
- Independent t-tests were used.
- This is certainly true in the animal kingdom (see Botham et al., 2006).
- PIP refers to an IP personality. IP refers to an IP behavioral response, not a personality.
- Note: in the model of Figure 6.9, “intention” is considered to be an expression of “commitment.” I did not measure commitment per se, but rather intention to stay in the group. Intention is a very subjective and diluted construct but it is commonly used in marketing research.
- Jones and George (1998).
- Idrissou et al. (2013)
- For example, Hodgins et al. (1978; in the Tamagami case), Rose and Manley (2010; Iconic infrastructure project in Australia), Ogunlana et al. (2002; Bangkok example), and Creasy and Anantatmula (2013; general case).
- Newcombe (2000; High-Tech Projects in Thailand).
- As mentioned, I posit that “stability” (as in stable persons) is not a personality trait but a state that expresses the fact that the individual has found a way to manage all four basic preset coping mechanisms.
- Varimax rotation with Kaiser normalization, 3 iterations.
- This is referred to as the law of perceived threat or law of Apprehension, as we have seen in Chapter 5.
- See Pels et al. (2000).
- For obvious proprietary reasons, I am not prepared to divulge this algorithm or to provide the complete data that would allow one to find it.
- Attachment can be linked to both trust and a sense of dependence: “Attachment theory has obvious relevance to social support processes (…) because the attachment behavioral system will be automatically activated in response to stressful or threatening events (Mikulincer et al., 2000; 2002).” The authors also point to the fact that attachment implies implicit and explicit expectations about others being emotionally responsive to their needs (Collins and Feeney, 2004, p. 364).
- Mikulincer and Shaver (2007, p. 279).
- See Magdol et al. (1998).
- Todorov and Engell (2008).
- DSM-IV (1996, p. 110).
- Collins and Miller (1994).
- Mayer et al. (1995).
- Ferrer et al. (2010, p. 422).
- Folkman et al. (1986).
- Gundlach and Cannon (2010).
- I did not find an effect for age. I had assumed that older people would perform better on the PCI given their experience. I did find an effect for gender, with women outperforming men; this, however, requires a more advanced study, the ultimate top performer group being too small of a group to generalize on the effect of gender.
- See Glass and Newman (2009).
- See Reidy et al. (2011)
- See Hoff et al. (2009).
- See Patrick et al. (1994).
- Hare (1991).
- Verbeke et al. (2011).
- Morgan and Lilienfeld (2000).
- Antisocial individuals display lower levels of serotonin compared with a normal population. When not in a hostile mood, IP personalities tend to have lower skin conductance and lower heart beats.
- Sporns (2011, p. 76).
- Yang and Raine (2009).
- Vartanian et al. (2011, p. 26).
- Mobbs et al. (2009).
- Lösel and Schmucker (2004).
- Muchembeld (2008) found that most violent acts are the fact of 17–24 year old males, a group that, incidentally, has a high level of testosterone.
- I used an independent t-test with Levene test for equality or inequality of variances; with p = 0.05.
- Varimax rotation, 3 iterations.
- See Mikulincer and Shaver (2007).
- This is discussed in more details in the next section on conflicts.
- Oakley, G. Interviewed March 2, 2016.
- Meredith and Mantel (2009, p. 11).
- Brett et al. (2006).
- Meredith and Mantel (2009, pp. 220–221).
- See Jap et al. (1999).
- Meredith and Mantel (2009).
- Meredith and Mantel (2009, p. 158).
- Seymour et al. (2007 p. 306).
- Soila-Wadman and Köping (2009, p. 39).
- See Gherardi (2006)
- See Lewicki et al. (1992); Gherardi (2006).
- Johnsson et al. (2004, p. 390).
- Habituation is somehow rendered in Tuckman’s model whereby teams are formed, then go through a turbulent episode (which involves hostility), followed by normalization, a performance, and a dissolution phase (Tuckman, 1965).
- A form of blindness well exemplified by Hitler’s decisions toward the end of WWII when he decided to attack the Eastern, Southern, and Western fronts all at once.
- See, for example, Zimbardo (2007).
- See, for example, Meredith and Mantel (2009, p. 220).
- Meredith and Mantel (2009).
- See, for example, Sizemon (2008).
- See, for example, Graham and Englund (2003).
- Significance levels were set at 95% (or (1−α) = 0.5). To compare means, independent t-tests were used after checking for the normality of populations (Kolmogorov–Smirnov and Shapiro–Wilk tests) and the normality of residuals (Levene test).
- CFI = 0.998 (before) (>0.9)/0.886 (after). RMSEA in the before is at 0.029 (<0.05) but found to be at 0.199 in the after experiment.
- CFI = 0.923 (before)/0.970 (after) (>0.9); it is thus acceptable. RMSEA = 0.210/0.144 (>0.05) indicating poor fit in both the before and after periods.
- “The future states of a dynamic system are a function of its present sate, as modified by its own activities” (Lewis, 2005, p. 173)
- Here, Trustt refers to Pretrust. In the theory of deterministic chaos, systems are indeed quite susceptible to initial conditions (May, 1995).
- Mackey and Glass (1977).
- Graham and Englund (2003).
- Photos graciously provided by Daoust Lestage Inc. architects—urban designers, and Stéphan Poulin.
- I kept the original names.
- Squire et al. (2003, p. 897).
- Gregg and Siegel (2001, p. 97).
- Squire et al. (2003, p. 897).
- McCullough et al. (2007).
- Bear et al. (1996, p. 446).
- Siegel and Sapru (2011, p. 215).
- It may be that the right lateral nucleus of the hypothalamus is a stronger center of Instrumentally hostile behaviors than its left counterpart. The right hemisphere of the brain plays an important role in a variety of functions such as agreeableness, fear processing (including cortisol control), inhibitory capabilities in regard to affective, behavioral, and cognitive processes, “maintenance of positive social relationships, collaboration and attention to social norms”, and social behavior. This would have to be probed further
- Alvarez et al. (2008); Amaral (2002).
- Gregg and Siegel (2001, p. 96).
- Woody and Szechtman (2011).
- Mobbs et al. (2009).
- Adams (2006).
- Gregg and Siegel (2001, p. 93).
- Reimann and Zimbardo (2011, p. 175).
- Siegel and Victoroff (2009).
- Terburg et al. (2009).
- Ueda et al. (1999).
- Woody and Szecthman (2011).
- Verbeke et al. (2011).
- Montoya et al. (2012).
- Meloy (1997).
- Stenstrom and Saad (2011).
- Reidy et al. (2011, p. 520).
- Meloy (1997).
- Siegel and Pradu (2011, p. 215).
- Purves et al. (2004, p. 486).
- The T-to-CRT ratio has been considered as a key marker for social aggression (Terburg et al., 2009). Testosterone (T) and cortisol (CRT) are associated with avoidance behavior and distrust; serotonin (5-HT) and oxytocin (OXT) are linked to approach behavior and with trust (Riedl and Javor, 2012). Table 6.1 contains hypotheses I have formulated years ago on the role of hormones, based on contemporary research data.
- Interestingly, the stable “class” exhibits a k value of 1.3.
- Shapiro (2010) uses two axes: one for autonomy, one for affiliation. Dominance and seduction are two main axes associated with animal behaviors (see Bowles, 2000, p. 870 in particular).
- A C$80 billion financial institution in Québec.
- As an example of the inevitability of attachment, newborns depend completely on others for body heat, food, fluids, and hygiene).
- See Goldberg et al. (2006).
- Testosterone (T) and cortisol (CRT) (along with arginine and vasopressin) are typically associated with avoidance behavior and distrust, while serotonin (5-HT) and oxytocin (OXT) (along with estrogen and dopamine) are typically associated with approach behavior and trust (Riedl and Javor, 2012, p. 73).
- Under the control of the medial hypothalamus (Di Scala et al., 1984).