
10
Tools for Debugging and Development
Developing game software is a complex, intricate, math-intensive and error-prone business. So it should be no surprise that virtually every professional game team builds a suite of tools for themselves, in order to make the game development process easier and less error-prone. In this chapter, we’ll take a look at the development and debugging tools most often found in professional-grade game engines.
10.1 Logging and Tracing
Remember when you wrote your first program in BASIC or Pascal? (OK, maybe you don’t. If you’re significantly younger than me—and there’s a pretty good chance of that—you probably wrote your first program in Java, or maybe Python or Lua.) In any case, you probably remember how you debugged your programs back then. You know, back when you thought a debugger was one of those glowing blue insect zapper things? You probably used print statements to dump out the internal state of your program. C/C++ programmers call this printf debugging (after the C standard library function, printf()).
It turns out that printf debugging is still a perfectly valid thing to do—even if you know that a debugger isn’t a device for frying hapless insects at night. Especially in real-time programming, it can be difficult to trace certain kinds of bugs using breakpoints and watch windows. Some bugs are timing-dependent: they only happen when the program is running at full speed. Other bugs are caused by a complex sequence of events too long and intricate to trace manually one-by-one. In these situations, the most powerful debugging tool is often a sequence of print statements.
Every game platform has some kind of console or teletype (TTY) output device. Here are some examples:
stdout or stderr via printf(), fprintf() or the C++ standard library’s iostream interface.printf() and iostream don’t work if your game is built as a windowed application under Win32, because there’s no console in which to display the output. However, if you’re running under the Visual Studio debugger, it provides a debug console to which you can print via the Win32 function OutputDebugString().So printing out information for debugging purposes is almost always as easy as adding calls to printf() throughout your code. However, most game engines go a bit farther than this. In the following sections, we’ll investigate the kinds of printing facilities most game engines provide.
10.1.1 Formatted Output with OutputDebugString()
The Windows SDK function OutputDebugString() is great for printing debugging information to Visual Studio’s Debug Output window. However, unlike printf(), OutputDebugString() does not support formatted output—it can only print raw strings in the form of arrays. For this reason, most Windows game engines wrap it in a custom function, like this:
#include <stdio.h> // for va_list et al
#ifndef WIN32_LEAN_AND_MEAN
#define WIN32_LEAN_AND_MEAN 1
#endif
#include <windows.h> // for OutputDebugString()
int VDebugPrintF(const char* format, va_list argList)
{
 const U32 MAX_CHARS = 1024;
 static char s_buffer[MAX_CHARS];
 int charsWritten
 = vsnprintf(s_buffer, MAX_CHARS, format, argList);
 // Now that we have a formatted string, call the
 // Win32 API.
 OutputDebugString(s_buffer);
 return charsWritten;
 }
 int DebugPrintF(const char* format, …)
 {
 va_list argList;
 va_start(argList, format);
 int charsWritten = VDebugPrintF(format, argList); va_end(argList);
 return charsWritten;
}
Notice that two functions are implemented: DebugPrintF() takes a variable-length argument list (specified via the ellipsis, …), while VDebugPrintF() takes a va_list argument. This is done so that programmers can build additional printing functions in terms of VDebugPrintF(). (It’s impossible to pass ellipses from one function to another, but it is possible to pass va_lists around.)
10.1.2 Verbosity
Once you’ve gone to the trouble of adding a bunch of print statements to your code in strategically chosen locations, it’s nice to be able to leave them there, in case they’re needed again later. To permit this, most engines provide some kind of mechanism for controlling the level of verbosity via the command line, or dynamically at runtime. When the verbosity level is at its minimum value (usually zero), only critical error messages are printed. When the verbosity is higher, more of the print statements embedded in the code start to contribute to the output.
The simplest way to implement this is to store the current verbosity level in a global integer variable, perhaps called g_verbosity. We then provide a VerboseDebugPrintF() function whose first argument is the verbosity level at or above which the message will be printed. This function could be implemented as follows:
int g_verbosity = 0;
void VerboseDebugPrintF(int verbosity,
const char* format, …)
{
 // Only print when the global verbosity level is
 // high enough.
 if (g_verbosity >= verbosity)
 {
 va_list argList;
 va_start(argList, format);
 VDebugPrintF(format, argList);
 va_end(argList);
}
}
10.1.3 Channels
It’s also extremely useful to be able to categorize your debug output into channels. One channel might contain messages from the animation system, while another might be used to print messages from the physics system, for example.
On some platforms, like the PlayStation 3, debug output can be directed to one of 14 distinct TTY windows. In addition, messages are mirrored to a special TTY window that contains the output from all of the other 14 windows. This makes it very easy for a developer to focus in on only the messages he or she wants to see. When working on an animation problem, one can simply flip to the animation TTY and ignore all the other output. When working on a general problem of unknown origin, the “all” TTY can be consulted for clues.
Other platforms like Windows provide only a single debug output console. However, even on these systems it can be helpful to divide your output into channels. The output from each channel might be assigned a different color. You might also implement filters, which can be turned on and off at runtime, and restrict output to only a specified channel or set of channels. In this model, if a developer is debugging an animation-related problem, for example, he or she can simply filter out all of the channels except the animation channel.
A channel-based debug output system can be implemented quite easily by adding an additional channel argument to our debug printing function. Channels might be numbered, or better, assigned symbolic values via a C/C++ enum declaration. Or channels might be named using a string or hashed string id. The printing function can simply consult the list of active channels and only print the message if the specified channel is among them.
If you don’t have more than 32 or 64 channels, it can be helpful to identify the channels via a 32- or 64-bit mask. This makes implementing a channel filter as easy as specifying a single integer. When a bit in the mask is 1, the corresponding channel is active; when the bit is 0, the channel is muted.
10.1.3.1 Using Redis to Manage TTY Channels
The developers at Naughty Dog use a web-based interface called Connector as their window into the various streams of debugging information that are emitted by the game engine at runtime. The game spits out its debug text into various named channels, each associated with a different engine system (animation, rendering, AI, sound, etc.) These data streams are collected by a lightweight Redis key-value store (see http://redis.io for more information on Redis). The Connector interface allows users to view and filter this Redis data easily from any web browser.
10.1.4 Mirroring Output to a File
It’s a good idea to mirror all debug output to one or more log files (e.g., one file per channel). This permits problems to be diagnosed after the fact. Ideally the log file(s) should contain all of the debug output, independent of the current verbosity level and active channels mask. This allows unexpected problems to be caught and tracked down by simply inspecting the most-recent log files.
You may want to consider flushing your log file(s) after every call to your debug output function to ensure that if the game crashes, the log file(s) won’t be missing the last buffer-full of output. The last data printed are usually the most useful for determining the cause of a crash, so we want to be sure that the log file always contains the most up-to-date output. Of course, flushing the output buffer can be expensive. So you should only flush buffers after every debug output call if either (a) you are not doing a lot of logging, or (b) you discover that it is truly necessary on your particular platform. If flushing is deemed to be necessary, you can always provide an engine configuration option to turn it on and off.
10.1.5 Crash Reports
Some game engines produce special text output and/or log files when the game crashes. In most operating systems, a top-level exception handler can be installed that will catch most crashes. In this function, you could print out all sorts of useful information. You could even consider emailing the crash report to the entire programming team. This can be incredibly enlightening for the programmers: When they see just how often the art and design teams are crashing, they may discover a renewed sense of urgency in their debugging tasks!
Here are just a few examples of the kinds of information you can include in a crash report:
10.2 Debug Drawing Facilities
Modern interactive games are driven almost entirely by math. We use math to position and orient objects in the game world, move them around, test for collisions, and cast rays to determine lines of sight, and of course we use matrix multiplication to transform objects from object space to world space and eventually into screen space for rendering. Almost all modern games are three-dimensional, but even in a two-dimensional game it can be very difficult to mentally visualize the results of all these mathematical calculations. For this reason, most good game engines provide an API for drawing colored lines, simple shapes and 3D text. We call this a debug drawing facility, because the lines, shapes and text that are drawn with it are intended for visualization during development and debugging and are removed prior to shipping the game.
A debug drawing API can save you huge amounts of time. For example, if you are trying to figure out why your projectiles are not hitting the enemy characters, which is easier? Deciphering a bunch of numbers in the debugger? Or drawing a line showing the trajectory of the projectile in three dimensions within your game? With a debug drawing API, logical and mathematical errors become immediately obvious. One might say that a picture is worth a thousand minutes of debugging.
Here are some examples of debug drawing in action within Naughty Dog’s engine. The following screenshots were all taken within our play-test level, one of many special levels we use for testing out new features and debugging problems in the game.


10.2.1 Debug Drawing API
A debug drawing API generally needs to satisfy the following requirements:
The debug drawing API in Naughty Dog’s engine looks something like this:
class DebugDrawManager
{
public:
// Adds a line segment to the debug drawing queue.
void AddLine(const Point& fromPosition,
 const Point& toPosition,
 Color color,
 float lineWidth = 1.0f,
 float duration = 0.0f,
 bool depthEnabled = true);
// Adds an axis-aligned cross (3 lines converging at
// a point) to the debug drawing queue.
void AddCross(const Point& position,
 Color color,
 float size,
 float duration = 0.0f,
 bool depthEnabled = true);
// Adds a wireframe sphere to the debug drawing queue.
void AddSphere(const Point& centerPosition,
 float radius,
 Color color,
 float duration = 0.0f,
 bool depthEnabled = true);
// Adds a circle to the debug drawing queue.
 void AddCircle(const Point& centerPosition,
 const Vector& planeNormal,
 float radius,
 Color color,
 float duration = 0.0f,
 bool depthEnabled = true);
// Adds a set of coordinate axes depicting the
// position and orientation of the given
// transformation to the debug drawing queue.
void AddAxes(const Transform& xfm,
 Color color,
 float size,
 float duration = 0.0f,
 bool depthEnabled = true);
// Adds a wireframe triangle to the debug drawing
// queue.
void AddTriangle(const Point& vertex0,
 const Point& vertex1,
 const Point& vertex2,
 Color color,
 float lineWidth = 1.0f,
 float duration = 0.0f,
 bool depthEnabled = true);
// Adds an axis-aligned bounding box to the debug
// queue.
void AddAABB(const Point& minCoords,
 const Point& maxCoords,
 Color color,
 float lineWidth = 1.0f,
 float duration = 0.0f,
 bool depthEnabled = true);
// Adds an oriented bounding box to the debug queue.
void AddOBB(const Mat44& centerTransform,
 const Vector& scaleXYZ,
 Color color,
 float lineWidth = 1.0f,
 float duration = 0.0f,
 bool depthEnabled = true);
// Adds a text string to the debug drawing queue.
void AddString(const Point& pos,
 const char* text,
 Color color,
 float duration = 0.0f,
 bool depthEnabled = true);
};
// This global debug drawing manager is configured for
// drawing in full 3D with a perspective projection.
extern DebugDrawManager g_debugDrawMgr;
// This global debug drawing manager draws its
// primitives in 2D screen space. The (x,y) coordinates
// of a point specify a 2D location on-screen, and the
// z coordinate contains a special code that indicates
// whether the (x,y) coordidates are measured in absolute
// pixels or in normalized coordinates that range from
// 0.0 to 1.0. (The latter mode allows drawing to be
// independent of the actual resolution of the screen.)
extern DebugDrawManager g_debugDrawMgr2D;
Here’s an example of this API being used within game code:
void Vehicle::Update()
{
 // Do some calculations…
 // Debug-draw my velocity vector.
 const Point& start = GetWorldSpacePosition();
 Point end = start + GetVelocity();
 g_debugDrawMgr.AddLine(start, end, kColorRed);
 // Do some other calculations…
 // Debug-draw my name and number of passengers.
 {
 char buffer[128];
 sprintf(buffer, “Vehicle %s: %d passengers”,
 GetName(), GetNumPassengers());
 const Point& pos = GetWorldSpacePosition();
 g_debugDrawMgr.AddString(pos,
 buffer, kColorWhite, 0.0f, false);
}
}
You’ll notice that the names of the drawing functions use the verb “add” rather than “draw.” This is because the debug primitives are typically not drawn immediately when the drawing function is called. Instead, they are added to a list of visual elements that will be drawn at a later time. Most highspeed 3D rendering engines require that all visual elements be maintained in a scene data structure so that they can be drawn efficiently, usually at the end of the game loop. We’ll learn a lot more about how rendering engines work in Chapter 11.
10.3 In-Game Menus
Every game engine has a large number of configuration options and features. In fact, each major subsystem, including rendering, animation, collision, physics, audio, networking, player mechanics, AI and so on, exposes its own specialized configuration options. It is highly useful to programmers, artists and game designers alike to be able to configure these options while the game is running, without having to change the source code, recompile and relink the game executable, and then rerun the game. This can greatly reduce the amount of time the game development team spends on debugging problems and setting up new levels or game mechanics.
One simple and convenient way to permit this kind of thing is to provide a system of in-game menus. Items on an in-game menu can do any number of things, including (but certainly not limited to):
An in-game menu should be easy and convenient to bring up, perhaps via a simple button press on the joypad. (Of course, you’ll want to choose a button combination that doesn’t occur during normal gameplay.) Bringing up the menus usually pauses the game. This allows the developer to play the game until the moment just before a problem occurs, then pause the game by bringing up the menus, adjust engine settings in order to visualize the problem more clearly, and then un-pause the game to inspect the problem in depth.
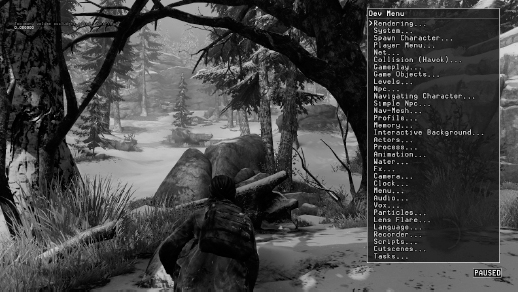

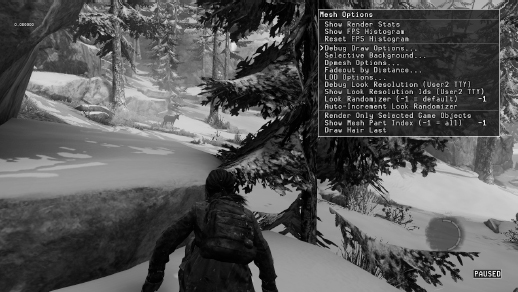
Let’s take a brief look at how the menu system works in the Naughty Dog engine. Figure 10.5 shows the top-level menu. It contains submenus for each major subsystem in the engine. In Figure 10.6, we’ve drilled down one level into the Rendering… submenu. Since the rendering engine is a highly complex system, its menu contains many submenus controlling various aspects of rendering. To control the way in which 3D meshes are rendered, we drill down further into the Mesh Options… submenu, shown in Figure 10.7. On this menu, we can turn off rendering of all static background meshes, leaving only the dynamic foreground meshes visible. This is shown in Figure 10.8. (Ah ha, there’s that pesky deer!)

10.4 In-Game Console
Some engines provide an in-game console, either in lieu of or in addition to an in-game menu system. An in-game console provides a command-line interface to the game engine’s features, much as a DOS command prompt provides users with access to various features of the Windows operating system, or a csh, tcsh, ksh or bash shell prompt provides users with access to the features of UNIX-like operating systems. Much like a menu system, the game engine console can provide commands allowing a developer to view and manipulate global engine settings, as well as running arbitrary commands.
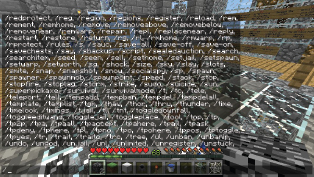
A console is somewhat less convenient than a menu system, especially for those who aren’t very fast typists. However, a console can be much more powerful than a menu. Some in-game consoles provide only a rudimentary set of hard-coded commands, making them about as flexible as a menu system. But others provide a rich interface to virtually every feature of the engine. A screenshot of the in-game console in Minecraft is shown in Figure 10.9.
Some game engines provide a powerful scripting language that can be used by programmers and game designers to extend the functionality of the engine, or even build entirely new games. If the in-game console “speaks” this same scripting language, then anything you can do in script can also be done interactively via the console. We’ll explore scripting languages in depth in Section 16.9.
10.5 Debug Cameras and Pausing the Game
An in-game menu or console system is best accompanied by two other crucial features: (a) the ability to detach the camera from the player character and fly it around the game world in order to scrutinize any aspect of the scene, and (b) the ability to pause, un-pause and single-step the game (see Section 8.5.5). When the game is paused, it is still important to be able to control the camera. To support this, we can simply keep the rendering engine and camera controls running, even when the game’s logical clock is paused.
Slow motion mode is another incredibly useful feature for scrutinizing animations, particle effects, physics and collision behaviors, AI behaviors, and the list goes on. This feature is easy to implement. Presuming we’ve taken care to update all gameplay elements using a clock that is distinct from the realtime clock, we can put the game into slo-mo by simply updating the gameplay clock at a rate that is slower than usual. This approach can also be used to implement a fast-motion mode, which can be useful for moving rapidly through time-consuming portions of gameplay in order to get to an area of interest (not to mention being a great source of laughs, especially when accompanied by a bad vocal rendition of Benny Hill music…).
10.6 Cheats
When developing or debugging a game, it’s important to allow the user to break the rules of the game in the name of expediency. Such features are aptly named cheats. For example, many engines allow you to “pick up” the player character and fly him or her around in the game world, with collisions disabled so he or she can pass through all obstacles. This can be incredibly helpful for testing out gameplay. Rather than taking the time to actually play the game in an attempt to get the player character into some desirable location, you can simply pick him up, fly him over to where you want him to be, and then drop him back into his regular gameplay mode.
Other useful cheats include, but are certainly not limited to:
Obviously this list could go on for pages. The sky’s the limit—you can add whatever cheats you need in order to develop or debug the game. You might even want to expose some of your favorite cheats to the players of the final shipping game. Players can usually activate cheats by entering unpublished cheat codes on the joypad or keyboard and/or by accomplishing certain objectives in the game.
10.7 Screenshots and Movie Capture
Another extremely useful facility is the ability to capture screenshots and write them to disk in a suitable image format such as Windows Bitmap files (.bmp), JPEG (.jpg) or Targa (.tga). The details of how to capture a screenshot vary from platform to platform, but they typically involve making a call to the graphics API that allows the contents of the frame buffer to be transferred from video RAM to main RAM, where it can be scanned and converted into the image file format of your choice. The image files are typically written to a predefined folder on disk and named using a date and time stamp to guarantee unique file names.
You may want to provide your users with various options controlling how screenshots are to be captured. Some common examples include:
Some engines also provide a full-fledged movie capture mode. Such a system captures a sequence of screenshots at the target frame rate of the game, which are processed either offline or at runtime to generate a movie file in a suitable format such as MPEG-2 (H.262) or MPEG-4 Part 10 (H.264). But even if your engine doesn’t support real-time video capture, external hardware like Roxio Game Capture HD Pro can always be used to capture the output from your game console or PC. And for PC and Mac games, a great many software video capture tools are available, including Fraps by Beepa, Camtasia by Camtasia Software, Dxtory by ExKode, Debut by NCH Software and Action! by Mirillis.
The PlayStation 4 has built-in support for sharing screenshots and video clips taken from within the game. During gameplay, the PS4 is continually capturing video of the most-recent 15 minutes of the user’s in-game experience. At any moment, the user can hit the Share button on the controller and opt to share a screenshot or the recorded video in various ways—by saving it to the PS4’s HDD or a thumb drive, or by uploading it to one of a number of online services. At Naughty Dog, we use these facilities to capture video and a screenshot of the game any time it crashes, thereby allowing us to see what situation led up to the crash.
PlayStation 4 users can also live-stream video of their playthroughs. For development purposes, it’s possible to use a PC to connect to a remote PS4 (perhaps sitting on another developer’s desk within or outside your studio), to see the game being played via streaming video, and even to control the remote game by plugging a PS4 controller into a USB slot on the PC. This facility can be incredibly useful for those “but it works on my machine” moments, because you can debug the problem directly on the other person’s PS4.

10.8 In-Game Profiling
Games are real-time systems, so achieving and maintaining a high frame rate (usually 30 FPS or 60 FPS) is important. Therefore, part of any game programmer’s job is ensuring that his or her code runs efficiently and within budget. As we saw when we discussed the 80/20 rule in Chapter 2, a large percentage of your code probably doesn’t need to be optimized. The only way to know which bits require optimization is to measure your game’s performance. We discussed various third-party profiling tools in Chapter 2. However, these tools have various limitations and may not be available at all on a console. For this reason, and/or for convenience, many game engines provide an in-game profiling tool of some sort.
Typically an in-game profiler permits the programmer to annotate blocks of code that should be timed and give them human-readable names. The profiler measures the execution time of each annotated block via the CPU’s hi-res timer and stores the results in memory. A heads-up display is provided, which shows up-to-date execution times for each code block (examples are shown in Figures 10.10 and 10.11). The display often provides the data in various forms, including raw numbers of cycles, execution times in microseconds, and percentages relative to the execution time of the entire frame.

10.8.1 Hierarchical Profiling
Computer programs written in an imperative language are inherently hierarchical—a function calls other functions, which in turn call still more functions. For example, let’s imagine that function a() calls functions b() and c(), and function b() in turn calls functions d(), e() and f(). The pseudocode for this is shown below.
void a()
{
 b();
 c();
}
void b()
{
 d();
 e();
 f();
}
void c() {…}
void d() {…}
void e() {…}
void f() {…}
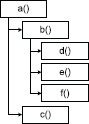
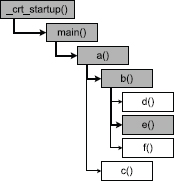
e().Assuming function a() is called directly from main(), this function call hierarchy is shown in Figure 10.12.
When debugging a program, the call stack shows only a snapshot of this tree. Specifically, it shows us the path from whichever function in the hierarchy is currently executing all the way to the root function in the tree. In C/C++, the root function is usually main() or WinMain(), although technically this function is called by a start-up function that is part of the standard C runtime library (CRT), so that function is the true root of the hierarchy. If we set a breakpoint in function e(), for example, the call stack would look something like this:
e()    ← The currently executing function.
b()
a()
main()
_crt_startup() ← Root of the call hierarchy.
This call stack is depicted in Figure 10.13 as a pathway from function e() to the root of the function call tree.
10.8.1.1 Measuring Execution Times Hierarchically
If we measure the execution time of a single function, the time we measure includes the execution time of any the child functions called and all of their grandchildren, great-grandchildren and so on as well. To properly interpret any profiling data we might collect, we must be sure to take the function call hierarchy into account.
Many commercial profilers can automatically instrument every single function in your program. This permits them to measure both the inclusive and exclusive execution times of every function that is called during a profiling session. As the name implies, inclusive times measure the execution time of the function including all of its children, while exclusive times measure only the time spent in the function itself. (The exclusive time of a function can be calculated by subtracting the inclusive times of all its immediate children from the inclusive time of the function in question.) In addition, some profilers record how many times each function is called. This is an important piece of information to have when optimizing a program, because it allows you to differentiate between functions that eat up a lot of time internally and functions that eat up time because they are called a very large number of times.
In contrast, in-game profiling tools are not so sophisticated and usually rely on manual instrumentation of the code. If our game engine’s main loop is structured simply enough, we may be able to obtain valid data at a coarse level without thinking much about the function call hierarchy. For example, a typical game loop might look roughly like this:
while (!quitGame)
{
 PollJoypad();
 UpdateGameObjects();
 UpdateAllAnimations();
 PostProcessJoints();
 DetectCollisions();
 RunPhysics();
 GenerateFinalAnimationPoses();
 UpdateCameras();
 RenderScene();
 UpdateAudio();
}
We could profile this game at a very coarse level by measuring the execution times of each major phase of the game loop:
while (!quitGame)
{
{
 PROFILE(SID(“Poll Joypad”));
 PollJoypad();
}
{
 PROFILE(SID(“Game Object Update”));
 UpdateGameObjects();
}
{
 PROFILE(SID(“Animation”));
 UpdateAllAnimations();
}
{
 PROFILE(SID(“Joint Post-Processing”));
 PostProcessJoints();
}
{
 PROFILE(SID(“Collision”));
 DetectCollisions();
}
{
 PROFILE(SID(“Physics”)); RunPhysics();
}
{
 PROFILE(SID(“Animation Finaling”));
 GenerateFinalAnimationPoses();
}
{
 PROFILE(SID(“Cameras”));
 UpdateCameras();
}
{
 PROFILE(SID(“Rendering”));
 RenderScene();
}
{
 PROFILE(SID(“Audio”));
 UpdateAudio();
}
}
The PROFILE() macro shown above would probably be implemented as a class whose constructor starts the timer and whose destructor stops the timer and records the execution time under the given name. Thus, it only times the code within its containing block, by nature of the way C++ automatically constructs and destroys objects as they go in and out of scope.
struct AutoProfile
{
 AutoProfile(const char* name)
{
 m_name = name;
 m_startTime = QueryPerformanceCounter();
}
∼AutoProfile()
{
 std::int64_t endTime = QueryPerformanceCounter();
 std::int64_t elapsedTime = endTime - m_startTime;
 g_profileManager.storeSample(m_name, elapsedTime);
}
const char* m_name;
std::int64_t m_startTime;
};
#define PROFILE(name) AutoProfile p(name)
The problem with this simplistic approach is that it breaks down when used within deeper levels of function call nesting. For example, if we embed additional PROFILE() annotations within the RenderScene() function, we need to understand the function call hierarchy in order to properly interpret those measurements.
One solution to this problem is to allow the programmer who is annotating the code to indicate the hierarchical interrelationships between profiling samples. For example, any PROFILE(…) samples taken within the RenderScene() function could be declared to be children of the PROFILE(SID(“Rendering”)) sample. These relationships are usually set up separately from the annotations themselves, by predeclaring all of the sample bins. For example, we might set up the in-game profiler during engine initialization as follows:
// This code declares various profile sample “bins”,
// listing the name of the bin and the name of its
// parent bin, if any.
ProfilerDeclareSampleBin(SID(“Rendering”), nullptr);
 ProfilerDeclareSampleBin(SID(“Visibility”), SID(“Rendering”));
 ProfilerDeclareSampleBin(SID(“Shaders”), SID(“Rendering”));
  ProfilerDeclareSampleBin(SID(“Materials”), SID(“Shaders”));
 ProfilerDeclareSampleBin(SID(“SubmitGeo”), SID(“Rendering”));
ProfilerDeclareSampleBin(SID(“Audio”), nullptr);
// …
This approach still has its problems. Specifically, it works well when every function in the call hierarchy has only one parent, but it breaks down when we try to profile a function that is called by more than one parent function. The reason for this should be pretty obvious. We’re statically declaring our sample bins as if every function can only appear once in the function call hierarchy, but actually the same function can reappear many times in the tree, each time with a different parent. The result can be misleading data, because a function’s time will be included in one of the parent bins, but really should be distributed across all of its parents’ bins. Most game engines don’t make an attempt to remedy this problem, since they are primarily interested in profiling coarse-grained functions that are only called from one specific location in the function call hierarchy. But this limitation is something to be aware of when profiling your code with a simple in-engine profile of the sort found in most game engines.
Of course, it is also possible to write a much more sophisticated profiling system that handles nested instances of AutoProfile properly. This is an example of the many trade-offs one makes when designing a game engine. Do we invest the engineering time to create a fully hierarchical profiler? Or, do we make do with something simpler and invest those programming resources elsewhere? Ultimately, it’s up to you.
We would also like to account for how many times a given function is called. In the example above, we know that each of the functions we profiled is called exactly once per frame. But other functions, deeper in the function call hierarchy, may be called more than once per frame. If we measure function x() to take 2 ms to execute, it’s important to know whether it takes 2 ms to execute on its own, or whether its execution time is 2 ms but it was called 1,000 times during the frame. Keeping track of the number of times a function is called per frame is quite simple—the profiling system can simply increment a counter each time a sample is received and reset the counters at the start of each frame.
10.8.2 Exporting to Excel
Some game engines permit the data captured by the in-game profiler to be dumped to a text file for subsequent analysis. I find that a comma-separated values (CSV) format is best, because such files can be loaded easily into a Microsoft Excel spreadsheet, where the data can be manipulated and analyzed in myriad ways. I wrote such an exporter for the Medal of Honor: Pacific Assault engine. The columns corresponded to the various annotated blocks, and each row represented the profiling sample taken during one frame of the game’s execution. The first column contained frame numbers and the second actual game time measured in seconds. This allowed the team to graph how the performance statistics varied over time and to determine how long each frame actually took to execute. By adding some simple formulae to the exported spreadsheet, we could calculate frame rates, execution time percentages and so on.
10.9 In-Game Memory Stats and Leak Detection
In addition to runtime performance (i.e., frame rate), most game engines are also constrained by the amount of memory available on the target hardware. PC games are least affected by such constraints, because modern PCs have sophisticated virtual memory managers. But even PC games are constrained by the memory limitations of their so-called “min spec” machine—the least-powerful machine on which the game is guaranteed to run, as promised by the publisher and stated on the game’s packaging.
For this reason, most game engines implement custom memory-tracking tools. These tools allow the developers to see how much memory is being used by each engine subsystem and whether or not any memory is leaking (i.e., memory is allocated but never freed). It’s important to have this information so that you can make informed decisions when trying to cut back the memory usage of your game so that it will fit onto the console or type of PC you are targeting.
Keeping track of how much memory a game actually uses can be a surprisingly tricky job. You’d think you could simply wrap malloc()/free() or new/delete in a pair of functions or macros that keep track of the amount of memory that is allocated and freed. However, it’s never that simple for a few reasons:
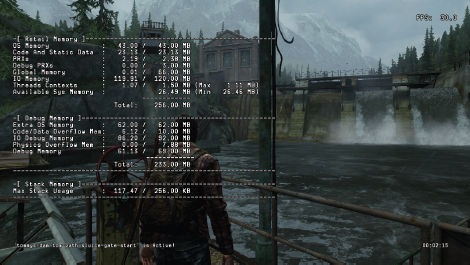
Most professional game teams expend a significant amount of effort on creating in-engine memory-tracking tools that provide accurate and detailed information. The resulting tools usually provide their output in a variety of forms. For example, the engine might produce a detailed dump of all memory allocations made by the game during a specific period of time. The data might include high water marks for each memory allocator or each game system, indicating the maximum amount of physical RAM required by each. Some engines also provide heads-up displays of memory usage while the game is running. This data might be tabular, as shown in Figure 10.14, or graphical as shown in Figure 10.15.
In addition, when low-memory or out-of-memory conditions arise, a good engine will provide this information in as helpful a way as possible. When PC games are developed, the game team usually works on high-powered PCs with more RAM than the min-spec machine being targeted. Likewise, console games are developed on special development kits that have more memory than a retail console. So in both cases, the game can continue to run even when it technically has run out of memory (i.e., would no longer fit on a retail console or min-spec PC). When this kind of out-of-memory condition arises, the game engine can display a message saying something like, “Out of memory—this level will not run on a retail system.”
There are lots of other ways in which a game engine’s memory tracking system can aid developers in pinpointing problems as early and as conveniently as possible. Here are just a few examples:
The key to providing good memory analysis tools is (a) to provide accurate information, (b) to present the data in a way that is convenient and that makes problems obvious and (c) to provide contextual information to aid the team in tracking down the root cause of problems when they occur.