
CHAPTER 6
Network Monitoring
Knowing When It Goes Wrong
Without Watching It
As an administrator, it is your responsibility to know when things are about to go wrong. You can, of course, go sit by your server all day and figure out if everything is going all right, but you probably have better things to do. Nagios offers services to monitor the network for you. In this chapter you'll learn how to install and use Nagios.
Starting with Nagios
Nagios is a network-wide monitoring tool. In this chapter you'll learn how to set it up on your servers. Once it is set up, you can watch the status of servers in your network via a web browser. Don't want to watch a web browser all time? That's fine, because you can configure Nagios to send relevant security alerts to some specified users on the network if something goes wrong. Nagios allows you to monitor local server events, such as running out of disk space, as network events.
Before you install Nagios, make sure that you have a web server configured (you can read more about configuring Apache Web Server in Chapter 11 of my book Beginning Ubuntu Server Administration, from Apress) and running. Nagios uses a web interface to show its information, so you can't do without that. Once you have confirmed it is up and running, install the nagios packages:
apt-get install nagios2 nagios-plugins nagios-images
This command installs about 40 MB of data on your server. Once that is done, you have to complete the installation by setting up authentication. Nagios uses the file /etc/nagios2/htpasswd.users, but this file is not created automatically. The following command creates it for you, puts a user with the name nagiosadmin in it, and prompts for a password:
htpasswd -c /etc/nagios2/htpasswd.users nagiosadmin
There are two configuration files related to user authentication. First, /etc/nagios2/apache2.conf contains all settings that allow Nagios to communicate with Apache. Listing 6-1 shows its contents.
Listing 6-1. /etc/nagios2/apache2.conf Sets Up Communication Between Nagios and Apache
root@mel:/etc/nagios2# cat apache2.conf

ScriptAlias /cgi-bin/nagios2 /usr/lib/cgi-bin/nagios2

ScriptAlias /nagios2/cgi-bin /usr/lib/cgi-bin/nagios2

Alias /nagios2/stylesheets /etc/nagios2/stylesheets

Alias /nagios2 /usr/share/nagios2/htdocs

<DirectoryMatch (/usr/share/nagios2/htdocs|/usr/lib/cgi-bin/nagios2)>

        Options FollowSymLinks

        DirectoryIndex index.html

        AllowOverride AuthConfig

        Order Allow,Deny

        Allow From All

        AuthName "Nagios Access"

        AuthType Basic

        AuthUserFile /etc/nagios2/htpasswd.users

        require valid-user

</DirectoryMatch>
As you can see, the apache2.conf file contains the authentication settings and some basic paths that Nagios has to use. The other relevant configuration file is /etc/nagios2/cgi.cfg, which contains the name of the admin user that is used for different purposes, as well as other settings that are related to the CGI scripts that Nagios uses. The interesting part of this script is that you can change admin names in it. By default, nagiosadmin is the only user who has administrative permissions to perform different tasks. If, for instance, you want to use another user account for hosts and services-related commands, change it in the cgi.cfg file. Listing 6-2 shows its contents.
Note For better readability, I have removed all comment lines. Consult the configuration file on disk to see the comment lines as well.
At this point, you have a very basic Nagios server up and running. Before you start to configure it, you need to find out if it works properly. From a workstation, start your browser and connect to the following URL:
http://your_nagios_server/nagios2
This should give you a login prompt at which you can enter the name and password of the admin user you have just created. After entering these, you should see the Nagios web interface, as shown in Figure 6-1. Don't bother clicking around in it, because you haven't set up anything yet. Therefore, you won't see much for the moment. Read the following sections to find out how to configure Nagios.
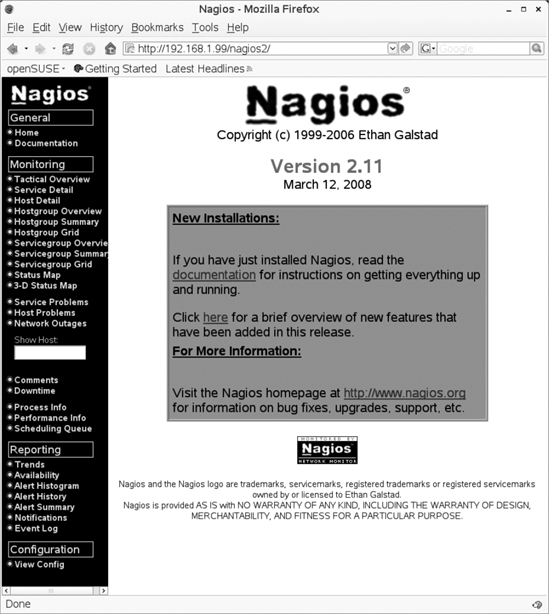
Figure 6-1. After installing Nagios, connect to it to see if it works.
Note The Nagios web interface gives access to some documentation that is installed on your server as well. You can use this documentation, but be aware that the paths on Ubuntu Server are different from the pathnames referred to in the documentation.
Configuring Nagios
Nagios uses lots of configuration files. The most difficult part of managing Nagios is to find the right configuration file for a specific purpose. To make it even more difficult, Nagios distinguishes between core configuration files and plug-in configuration files, add-on files that can be used as an extension to the default functionality of Nagios.
Location of the Configuration Files
When you first start working with Nagios, it looks like configuration files are located just about everywhere! To help you pinpoint the locations of these files, the following list identifies the most common directories in which Nagios stores information:
/etc/nagios2: This is the master configuration directory. It contains the most important configuration files, among which you will find thenagios.cfgconfiguration file./usr/lib/nagios/plugins: As mentioned, Nagios works with plug-ins. Every plug-in allows you to monitor an additional service. For example, Nagios by itself doesn't know how to monitor Oracle. If, however, the Oracle plug-in has been installed in this directory (which is the case after a default installation), the plug-in can manage Oracle./etc/nagios2/conf.d: This directory contains some of the most important Nagios configuration files. If the file you are looking for is not in here, also check/etc/nagios-plugins/config./etc/nagios-plugins/config: This directory contains the configuration files for the plug-ins that are installed on your server./var/lib/nagios2: Nagios writes its output to this directory. When Nagios has been up and running for some time, you'll find.outfiles in this directory. These files contain the information that is used by the Nagios web interface./var/log/nagios2: This is the directory where Nagios writes its log files. Use it if anything goes wrong with your Nagios environment.
Before diving deep into the different configuration files, you should also be aware of the /etc/nagios2/commands.cfg file. To do its work, Nagios uses its own command set. The commands.cfg file defines the most important commands. Listing 6-3 gives a partial example.
Listing 6-3. /etc/nagios2/commands.cfg Defines the Most Common Nagios Commands
root@mel:/etc/nagios2# cat commands.cfg

# 'process-host-perfdata' command definition

define command{

        command_name    process-host-perfdata

        command_line    /usr/bin/printf "%b" "$LASTHOSTCHECK$	$HOSTNAME$

	$HOSTSTATE$

$HOSTATTEMPT$	$HOSTSTATETYPE$

$HOSTEXECUTIONTIME$	$HOSTOUTPUT$	$HOSTPERFDATA$
" >>

 /var/lib/nagios2/host-perfdata.out

        }


# 'process-service-perfdata' command definition

define command{

        command_name    process-service-perfdata

        command_line    /usr/bin/printf "%b" "$LASTSERVICECHECK$	$HOSTNAME$

	$SERVICEDESC$

$SERVICESTATE$	$SERVICEATTEMPT$

$SERVICESTATETYPE$	$SERVICEEXECUTIONTIME$	$SERVICELATENCY$

	$SERVICEOUTPUT$	$SERVICEPERFDATA$
" >> /var/lib/nagios2/service-perfdata.out

        }
Nagios commands are well structured. If you feel you are missing any functionality in the default Nagios command set, you can create your own Nagios commands as well. The commands.cfg file contains some hints on how to do that.
The Master Configuration File: nagios.cfg
The master configuration file that Nagios uses is /etc/nagios2/nagios.cfg. This file determines where Nagios should read and write specific information. By using cfg_file statements, it also tells Nagios what additional configuration files to read. For example, these statements can refer to configuration files for specific modules that you want to use. By default, all of these configuration files are disabled, which means that Nagios basically monitors nothing. Of course, it makes sense to enable them, but only after you have modified the configuration file according to your needs. Listing 6-4 shows the part of nagios.cfg that indicates what configuration files to use. Be aware, though, that these are only example files, and in some cases refer to files that don't even exist at the location that is indicated.
Listing 6-4. From nagios.cfg, Additional Configuration Files Are Included
# Command definitions

cfg_file=/etc/nagios2/commands.cfg


# These other examples are taken from upstream's sample configuration

# files.


# You can split other types of object definitions across several

# config files if you wish (as done here), or keep them all in a

# single config file.


#cfg_file=/etc/nagios2/contactgroups.cfg

#cfg_file=/etc/nagios2/contacts.cfg

#cfg_file=/etc/nagios2/dependencies.cfg

#cfg_file=/etc/nagios2/escalations.cfg

#cfg_file=/etc/nagios2/hostgroups.cfg

#cfg_file=/etc/nagios2/hosts.cfg

#cfg_file=/etc/nagios2/services.cfg

#cfg_file=/etc/nagios2/timeperiods.cfg


# Extended host/service info definitions are now stored along with

# other object definitions:

#cfg_file=/etc/nagios2/hostextinfo.cfg

#cfg_file=/etc/nagios2/serviceextinfo.cfg


# You can also tell Nagios to process all config files (with a .cfg

# extension) in a particular directory by using the cfg_dir

# directive as shown below:


#cfg_dir=/etc/nagios2/servers

#cfg_dir=/etc/nagios2/printers

#cfg_dir=/etc/nagios2/switches

#cfg_dir=/etc/nagios2/routers
As a Nagios administrator, it is also useful if you know about the other important lines in the nagios.cfg file. The following list provides an overview of the most important definitions it contains:
log_file=/var/log/nagios2/nagios.log: This parameter tells Nagios where to log its information.cfg_dir=/etc/nagios2/conf.d: This line tells Nagios to include all configuration files in the specified directory.cfg_file=/etc/nagios2/commands.cfg: This line tells Nagios to load the configuration filecommands.cfgas well. Likewise, othercfg_filelines are used to refer to additional configuration files that Nagios should include.status_file=/var/cache/nagios2/status.dat: This file contains current status information about all hosts and services that are monitored. The CGI scripts from the Nagios web server interpret this file and display its contents in a graphical way.check_external_command=0: This default line makes sure that no external commands can be executed. If you want to manage Nagios using a web server (which should always be the case), you need to enable this option by giving it the value 1.log_rotation_method=d: This line specifies in what way the Nagios log file should be rotated. By default, this will happen daily. Valid values for this parameter follow:
n: Don't rotate the logh: Rotate hourlyd: Rotate dailyw: Rotate weeklym: Rotate monthly
log_archive_path=/var/log/nagios2/archives: If log rotation is enabled, this parameter describes where the archive of log files should be written to.
Creating Essential Nagios Configuration Files
Nagios needs some minimal configuration files, and they should reside in one of the directories defined in the nagios.cfg file using the cfg_dir directive. The default location to put them would be /etc/nagios2/conf.d. Make sure that you create at least the following configuration files:
contacts.cfg: This file defines which people should get a message in case of trouble.contactgroups.cfg: All contacts specified incontacts.cfgshould be a member of at least one contact group. Use this file to define the contact group.templates.cfg: This file defines templates that can be used by other configuration files.hosts.cfg: Use this file to define the hosts that Nagios will monitor.hostgroups.cfg: In large networks, it is useful to subdivide hosts into host groups, such as servers, switches, routers, and so on.services.cfg: The file defines specific services that you want to monitor for each host.timeperiods.cfg: This file defines time periods used in all configuration files.
Now it is time to start the real work, which unfortunately involves a lot of typing. In the rest of this chapter, we will work on a small example network in which four Linux servers are used. Three of these are on the internal network, and one of them is on the Internet. Nagios can monitor other operating systems as well, but let's try to set up Linux-based host monitoring first. The following servers are monitored:
192.168.1.99: DHCP, NFS, web, Nagios, SSH192.168.1.100: Samba, SSH192.168.1.101: Web, FTP, SSH80.69.93.216: Web, SSH
Creating a Contacts File
Start with the creation of the contacts.cfg file. As specified in /etc/nagios2/nagios.cfg, this file should reside in /etc/nagios2, so make sure to create it there. Listing 6-5 gives an example of what this file may look like.
Listing 6-5. Example contacts.cfg File
# contact definition for linda

define contact{

     contact_name                         linda

     alias                                linda thomsen

     service_notification_period          workhours

     host_notification_period             workhours

     service_notification_options         c,r

     host_notification_options            d,r


     service_notification_commands        notify-by-email

     host_notification_commands           host-notify-by_email

     email                                linda@localhost

}
The interesting part of this configuration file is that there are quite a few cross-references. That is, the contacts.cfg file depends on what you do in other configuration files. For instance, the lines service_notification_period and host_notification_period are periods that you will define later in the timeperiods.cfg file.
In the example contacts.cfg file in Listing 6-6, you also see that some service_notification_options and host_notification_options parameters are used. The following service_notification_options parameters can be used:
n: Do not notify at allw: Notify on WARNING statesu: Notify on UNKNOWN statesc: Notify on CRITICAL statesr: Notify when the service recovers and returns to OK state
Likewise, the following host_notification_options parameters can be used:
n: Do not notify at alld: Notify on DOWN host statesu: Notify if host is unreachabler: Notify when host recovers
Defining a Contacts Group
After defining the contacts file, you may want to create a contact group as well. This makes it easier in large implementations to address all contacts at once. Listing 6-6 shows what a contact group may look like.
Listing 6-6. Example of a Contact Group
# Definition of an admins contact group

define contactgroup{

      contactgroup_name          admins

      alias                      administrators

      members                    root,linda

}
Defining Hosts and Host Groups
After defining whom to contact if things go wrong, you have to define hosts and, if so required, hostnames. The hosts you define will inherit some of their settings from the host template. On Ubuntu 8.04, you'll find this template in the file /etc/nagios2/conf.d/generic-hosts_nagios2.cfg. Normally you don't need to edit the settings in this file. You just need to refer to it when defining your hosts. This hosts configuration file may look similar to the example shown in Listing 6-7.
Listing 6-7. Example hosts.cfg File
# definition of Ubuntu Server

define host{

        host_name                mel

        alias                    Ubuntu Server

        address                  192.168.1.99

        use                      generic-host

        check_command            check-host-alive

        max_check_attempts       10

        notification_interval    120

        notification_period      24x7

        notification_options     d,u,r

}


#Definition of generic Samba server

define host{

        host_name                syl

        alias                    Samba Server

        address                  192.168.1.100

        use                      generic-host


        check_command            check-host-alive

        max_check_attempts       10

        notification_interval    120

        notification_period      24x7

        notification_options     d,u,r

}


#Definition of internal web server

define host{

        host_name                lin

        alias                    Web Server

        address                  192.168.1.101

        use                      generic-host

        check_command            check-host-alive

        max_check_attempts       10

        notification_interval    120

        notification_period      24x7

        notification_options     d,u,r

}


define host{

        host_name                lor

        alias                    external web server

        address                  80.69.93.216

        use                      generic-host

        check_command            check-host-alive

        max_check_attempts       10

        notification_interval    120

        notification_period      24x7

        notification_options     d,u,r

}
In the example hosts.cfg file in Listing 6-7, you can see that some new parameters are used. Of these, the nonobvious parameters are as follows:
check_command: Refers to the command that Nagios uses to check if the host is up. In all cases, it should refer to thecheck-hosts-alivecommand.max_check_attempts: Defines how many checks Nagios should run as a maximum. If a host still doesn't reply after reaching this threshold, Nagios will consider it unavailable.notification_interval: Defines, in minutes, how often you should receive a notification if the problem still exists. Use the value 0 if you want just one notification to be sent after the problem is discovered.notification_period: Defines during which time period notifications should be sent to the contacts. It is a good idea to use 24x7 here, to make sure that notifications will be sent at all times.notification_options: Defines in what situations notifications should be sent out. The following options are available:d: Notify if host is downu: Notify if host is unreachabler: Send notification when host recoversn: Do not send notifications
After defining hosts, you must specify the host groups that your hosts belong to. There are many approaches to creating host groups, and a host may be a member of more than one host group. Ultimately, your business needs will dictate which host groups to use. In the example in Listing 6-8, you can see that three different approaches are used to define host groups. First, there is a host group that contains all hosts, and then there are functional host groups, and last there are host groups based on locations that are used.
Listing 6-8. Host Groups Make Managing Hosts Easier
# All hosts

define hostgroup {

        hostgroup_name    all

        alias             all hosts

        members           *

}


define hostgroup {

        hostgroup_name    internal

        alias             internal hosts

        members           mel, syl, lin

}


define hostgroup {

        hostgroup_name    webservers

        alias             web servers

        members           mel, lin, lor

}


define hostgroup {

        hostgroup_name    fileservers

        alias             file servers

        members           mel, syl

}
Defining Services to Monitor
Now that your hosts and host groups are defined, it's time to work on the services. In the services.cfg file, you define what particular services you want to monitor. Normally, making sure that all relevant services are defined is a lot of work. In Nagios, you can monitor network services as well as local services. For instance, there is a service to check available local disk space, or you can check based on any network protocol as well.
Before you start to work on the services.cfg file, you should understand what it does. In the services file, different services are checked. To do this, Nagios needs plug-ins. You'll find a list of all available plug-ins in the /usr/lib/nagios/plugins directory. I recommend that you have a look at this directory and get an idea of the possibilities that are offered. You can run every plug-in from this directory as an independent executable, which gives you an idea of the plug-in possibilities. Some plug-ins just run and that's all, whereas other plug-ins can have lots of options that enable you to determine what exactly the plug-in should do. Listing 6-9 gives you an example of the help output from the check_disk plug-in. Many plug-ins have complex options like this one, so make sure that you are aware of the options that exist for the plug-ins you want to use before you configure the services.cfg file.
Listing 6-9. Nagios Plug-ins Often Have Lots of Options to Define What You Want Them to Do
root@mel:/usr/lib/nagios/plugins# ./check_disk --help

check_disk v1848 (nagios-plugins 1.4.11)

Copyright (c) 1999 Ethan Galstad <[email protected]>

Copyright (c) 1999-2006 Nagios Plugin Development Team

        <[email protected]>

This plugin checks the amount of used disk space on a mounted file system

and generates an alert if free space is less than one of the threshold values


Usage: check_disk -w limit -c limit [-W limit] [-K limit] {-p path | -x device}

[-C] [-E] [-e] [-g group ] [-k] [-l] [-M] [-m] [-R path ] [-r path ]

[-t timeout] [-u unit] [-v] [-X type]


Options:

 -h, --help

    Print detailed help screen

 -V, --version

    Print version information

 -w, --warning=INTEGER

    Exit with WARNING status if less than INTEGER units of disk are free

 -w, --warning=PERCENT%

    Exit with WARNING status if less than PERCENT of disk space is free

 -c, --critical=INTEGER

    Exit with CRITICAL status if less than INTEGER units of disk are free

 -c, --critical=PERCENT%

    Exit with CRITCAL status if less than PERCENT of disk space is free

 -W, --iwarning=PERCENT%

    Exit with WARNING status if less than PERCENT of inode space is free

 -K, --icritical=PERCENT%

    Exit with CRITICAL status if less than PERCENT of inode space is free

 -p, --path=PATH, --partition=PARTITION

    Path or partition (may be repeated)

 -x, --exclude_device=PATH <STRING>

    Ignore device (only works if -p unspecified)

 -C, --clear

    Clear thresholds

 -E, --exact-match

    For paths or partitions specified with -p, only check for exact paths

 -e, --errors-only

    Display only devices/mountpoints with errors

 -g, --group=NAME

    Group pathes. Thresholds apply to (free-)space of all partitions together

 -k, --kilobytes

    Same as '--units kB'

 -l, --local

    Only check local filesystems


 -L, --stat-remote-fs

    Only check local filesystems against thresholds. Yet call stat on

 remote filesystems

    to test if they are accessible (e.g. to detect Stale NFS Handles)

 -M, --mountpoint

    Display the mountpoint instead of the partition

 -m, --megabytes

    Same as '--units MB'

 -A, --all

    Explicitly select all pathes. This is equivalent to -R '.*'

 -R, --eregi-path=PATH, --eregi-partition=PARTITION

    Case insensitive regular expression for path/partition (may be repeated)

 -r, --ereg-path=PATH, --ereg-partition=PARTITION

    Regular expression for path or partition (may be repeated)

 -I, --ignore-eregi-path=PATH, --ignore-eregi-partition=PARTITION

    Regular expression to ignore selected path/partition (case insensitive)

 (may be repeated)

 -i, --ignore-ereg-path=PATH, --ignore-ereg-partition=PARTITION

    Regular expression to ignore selected path or partition (may be repeated)

 -t, --timeout=INTEGER

    Seconds before connection times out (default: 10)

 -u, --units=STRING

    Choose bytes, kB, MB, GB, TB (default: MB)

 -v, --verbose

    Show details for command-line debugging (Nagios may truncate output)

 -X, --exclude-type=TYPE

    Ignore all filesystems of indicated type (may be repeated)


Examples:

 check_disk -w 10% -c 5% -p /tmp -p /var -C -w 100000 -c 50000 -p /

    Checks /tmp and /var at 10% and 5%, and / at 100MB and 50MB

 check_disk -w 100M -c 50M -C -w 1000M -c 500M -g sidDATA -r '^/oracle/SID/data.*$'

    Checks all filesystems not matching -r at 100M and 50M. The fs matching

 the -r regex are grouped which means the freespace thresholds are

 applied to all disks together

 check_disk -w 100M -c 50M -C -w 1000M -c 500M -p /foo -C -w 5% -c 3% -p /bar

    Checks /foo for 1000M/500M and /bar for 5/3%. All remaining volumes use 100M/50M


Send email to [email protected] if you have questions

regarding use of this software. To submit patches or suggest improvements,
send email to [email protected]
After you have familiarized yourself with the possibilities the plug-ins have to offer, you can start creating the services file. Listing 6-10 shows a very simple example of a services file. In this file, Nagios will monitor whether hosts are available. Next, for web servers, it will monitor whether the web service is still up and running. In this file, Nagios will monitor the availability of hosts, web services, and disk space for host lor.
Like the hosts.cfg file, the services.cfg file also uses a template containing some generic settings. These default settings are read from /etc/nagios2/conf.d/generic-service_nagios2.cfg. If you want to overwrite settings from the template file, you can include them in the services.cfg file. In Listing 6-10, you can see that that is done for the check on local disk usage for host lor. Consider this not as a complete configuration file, but rather as a starting point to build your own configuration.
Listing 6-10. services.cfg Defines What Exactly You Want to Monitor
## Check host groups


# Check if all services reply to ping test

define service{

        hostgroup_name          all

        use                     generic-service

        service_description     PING

        check_command           check_ping!100.0,25%!500.0,75%

        notification_interval   0

}


# Check web services availability

define service{

        hostgroup_name          webservers

        use                     generic-service

        service_description     HTTP

        check_command           check_http

        notification_interval   0

}


# Check available disk space

define service{

        host_name                lor

        use                      generic-service

        service_description      Check local disk usage

        is_volatile              0

        check_period             24x7


        max_check_attempts       3

        normal_check_interva     5

        retry_check_interval     1

        contact_groups           admins

        notification_interval    120

        notification_period      24x7

        notification_options     c,r

        check_command            check_disk!20%!10%!/

}
Working with Nagios Commands
Let's first look at the two check commands that are used in this example file:
check_ping!100.0,25%!500.0,75%

check_disk!20%!10%!/
It may surprise you that the commands are not used exactly as shown in the help output that you see when executing the command with the --help option. If you look closer, you will see that it does work the same way—it is just written in a different way. Look at the check_disk command, for example. This command, as used in the services.cfg script, uses three parameters, separated by exclamation marks. If you look at the help output of /usr/lib/nagios/plugins/check_disk --help, you see the result shown in Listing 6-11.
Listing 6-11. Partial Output of check_disk Usage Information
root@mel:/usr/lib/nagios/plugins# ./check_disk --help | less

check_disk v1848 (nagios-plugins 1.4.11)

Copyright (c) 1999 Ethan Galstad <[email protected]>

Copyright (c) 1999-2006 Nagios Plugin Development Team

        <[email protected]>


This plugin checks the amount of used disk space on a mounted file system

and generates an alert if free space is less than one of the threshold values


Usage: check_disk -w limit -c limit [-W limit] [-K limit] {-p path | -x device}

[-C] [-E] [-e] [-g group ] [-k] [-l] [-M] [-m] [-R path ] [-r path ]

[-t timeout] [-u unit] [-v] [-X type]

Options:

 -h, --help

    Print detailed help screen

 -V, --version

    Print version information

 -w, --warning=INTEGER

    Exit with WARNING status if less than INTEGER units of disk are free

 -w, --warning=PERCENT%

    Exit with WARNING status if less than PERCENT of disk space is free

 -c, --critical=INTEGER
As you can see, this command has three options that are required: -w limit, -c limit, and -p path or -x device. -w generates a warning if less than the specified percentage of disk space is free, -c generates a critical event if less than the specified percentage of disk space is free, and -p or -x refers to either the path or the device name that Nagios has to monitor for available disk space. As used in the services.cfg file, these are exactly the three parameters that are used. The same applies to the ping test that is performed from the same script.
Defining Time Periods
The last relevant part of a Nagios configuration is the definition of time periods. In most cases you probably want to see an alert no matter when the event occurs, but in some cases you may choose to forward alerts to specific persons when an event occurs during a given period of the day. Listing 6-5, earlier in the chapter, specified that user linda will get alerts only during work hours. The definition of these time periods comes from the file /etc/nagios2/conf.d/timeperiods_nagios2.cfg. This file contains some useful default definitions of time periods, but can also be modified as required. Listing 6-12 gives an example of its contents.
Listing 6-12. Using timeperiods_nagios2.cfg to Define During What Times of Day Nagios Has to Act
root@mel:/etc/nagios2/conf.d# cat timeperiods_nagios2.cfg

############################################################################

# timeperiods.cfg

############################################################################


# This defines a timeperiod where all times are valid for checks,

# notifications, etc.  The classic "24x7" support nightmare. :-)

define timeperiod{

        timeperiod_name 24x7

        alias           24 Hours A Day, 7 Days A Week

        sunday          00:00-24:00

        monday          00:00-24:00

        tuesday         00:00-24:00

        wednesday       00:00-24:00

        thursday        00:00-24:00

        friday          00:00-24:00

        saturday        00:00-24:00

        }


# Here is a slightly friendlier period during work hours

define timeperiod{

        timeperiod_name workhours

        alias           Standard Work Hours

        monday          09:00-17:00

        tuesday         09:00-17:00

        wednesday       09:00-17:00

        thursday        09:00-17:00

        friday          09:00-17:00

        }


# The complement of workhours

define timeperiod{

        timeperiod_name nonworkhours

        alias           Non-Work Hours

        sunday          00:00-24:00

        monday          00:00-09:00,17:00-24:00

        tuesday         00:00-09:00,17:00-24:00

        wednesday       00:00-09:00,17:00-24:00

        thursday        00:00-09:00,17:00-24:00

        friday          00:00-09:00,17:00-24:00

        saturday        00:00-24:00

        }


# This one is a favorite: never :)

define timeperiod{

        timeperiod_name never

        alias           Never

        }


# end of file
Restarting Nagios with Your Configuration
Your configuration files should now be in place, which means it is time to restart Nagios. To do this, use the command /etc/init.d/nagios2 restart. If you have applied changes to your Apache configuration as well, don't forget to restart the Apache web server also, using /etc/init.d/apache2 restart. When you restart Nagios, watch the console of your server. After all, you did apply lots of changes to the different configuration files, and making one tiny little typing error will cause the restart of Nagios to fail. If there is some serious error that prevents Nagios from restarting, you will see it on the console of your server, as shown in the example in Listing 6-13.
Listing 6-13. If Nagios Fails to Restart, It Will Tell You Why
root@mel:/etc/init.d# ./nagios restart

 * Restarting nagios2 monitoring daemon nagios2

Nagios 2.11

Copyright (c) 1999-2007 Ethan Galstad (http://www.nagios.org)

Last Modified: 03-12-2008

License: GPL


Reading configuration data...


Error: Unexpected start of object definition in file

 '/etc/nagios2/conf.d/services.cfg' on line 12.  Make sure you close

 preceding objects before starting a new one.


***> One or more problems was encountered while processing the config files...


     Check your configuration file(s) to ensure that they contain valid

     directives and data defintions.  If you are upgrading from a previous

     version of Nagios, you should be aware that some variables/definitions

     may have been removed or modified in this version.  Make sure to read

     the HTML documentation regarding the config files, as well as the

     'Whats New' section to find out what has changed.


 * errors in config!
If an error occurs, fix it and restart Nagios. This part of the configuration requires some patience. You have created lots of configuration files, all by hand, so it's likely that now you have to eliminate lots of errors, also by hand.
Caution When using /etc/init.d/nagios2 restart, the service may falsely report that it is up and running. Don't trust this result. When debugging your Nagios server for configuration errors, first stop it by using /etc/init.d/nagios2 stop and then restart it by using /etc/init.d/nagios2 start.
Installing NRPE
To monitor some services, you just need Nagios on your server and nothing else. To monitor other parameters on a managed host, you need a local agent on that host as well. The name of the service is NRPE and it exists for different server platforms. Setting up NRPE consists of two parts. The first part happens on the server that you want to monitor, and the second part happens on the Nagios server.
Configuring NRPE on the Monitored Server
Because you may have Linux distributions other than Ubuntu Server in your network, and because these servers may not know apt-get, this section covers a more generic way to install the NRPE service on Linux servers. In this method, the nrpe.tar.gz file is installed. Of course, you can install NRPE on Ubuntu Server as well. To do this, use apt-get install nagios-nrpe-plugin.
Caution If you want to install NRPE on Ubuntu, don't install and extract the .tar.gz file that is offered from the Nagios download site as described in the following procedure. Use the nagios-nrpe-plugin package instead. Install it with the command apt-get install nagios-nrpe-plugin. If your distribution is not Ubuntu but has a method of installing NRPE from its software repositories, you should always do it that way. Only if that doesn't work can you apply steps 1-4 from the following procedure.
- On the server you want to manage, create a
nagiosuser and anagiosgroup and configure/usr/local/nagiosas the home directory that the user should use:
groupadd nagios

useradd -g nagios -md /usr/local/nagios nagios
- Go to www.nagios.org/download. From there, click the Go button for Get Addons. Next, select the latest version of NRPE and click Go to continue. In the File Download dialog box that asks you whether you want to save the
nrpearchive to disk, click Save. Store it somewhere on disk; the/tmpdirectory is a reasonable choice. - Assuming that you have just downloaded the
nrpepackage to the/tmpdirectory, usecd /tmpto go to that directory, and then use the commandtar zxvf nrpe<version>.tar.gzto extract it. This creates a subdirectory with the namenrpe-<version>. - Use
cdto go into the subdirectory that was just created, and then compile thenrpeplug-in using the following commands. If this fails, make sure that you have a C compiler installed on your server.
./configure

make all
- Copy the
nrpefile from thesrcsubdirectory to the directory where Nagios would expect its plug-in files to be located. If on your server nothing related to Nagios has been installed so far, use the location/usr/local/nagios. If something related to Nagios has already been installed, check whether/var/lib/nagiosalready exists on your server. If it does, copy thenrpefile there. - In the directory to which you just copied the
nrpemodule, use your editor to create thenrpeconfiguration file. The name of this file must benrpe.cfg, so if you just copied the module to/var/lib/nagios, make sure that you create the file/var/lib/nagios/nrpe.cfg. Give the file the following contents, while making sure that theallowed_hostsline contains the IP address of your Nagios server:
server_port=5666

nrpe_user=nagios

nrpe_group=nagios

allowed_hosts=192.168.1.99
This basically finishes the NRPE installation. To execute Nagios commands on the host that you are monitoring, you would also need Nagios plug-ins. If nothing was installed yet on your server, download the plug-ins from www.nagios.org (or from your distribution's software repositories) and put them in the default path /usr/local/nagios/libexec. If on your server some Nagios components were installed already, check the local server configuration to find the location of the plug-in files. Always check if /usr/lib/nagios/plugins exists before putting plug-ins in /usr/local/nagios/libexec. Many distributions use this location in /usr/lib/nagios to store plug-ins.
Once the plug-ins are installed, you can add to the nrpe.cfg configuration file the checks that you want Nagios to perform on this host. For instance, add the following line to check if available disk space on the monitored machine falls below the warning threshold of 20% and the critical threshold of 10%:
command[check_disk]=/usr/lib/nagios/plugins/check_disk -w 20 -c 10
Tip Before you include the plug-in command in the nrpe.cfg file, make sure it really works. You can verify this by running it from the command line, just as you would include it in the configuration file.
Did it all work? If so, then I recommend that you add the following lines to your nrpe.cfg file as a default. This is information that you would normally be interested in when monitoring a remote host.
command[check_users]=/usr/lib/nagios/plugins/check_users -w 5 -c 10

command[check_load]=/usr/lib/nagios/plugins/check_load -w 15,10,5 -c 30,25,20

command[check_zombie_procs]=/usr/lib/nagios/plugins/check_procs -w 5 -c 10 -s Z

command[check_total_procs]=/usr/lib/nagios/plugins/check_procs -w 150 0c 200
After you create the NRPE configuration, make sure that the NRPE process is started. Use the options your distribution's runlevels offer to make sure that it will be started automatically when your server reboots.
Configuring the Nagios Server to Use NRPE
The Nagios server should already contain the NRPE plug-in. On Ubuntu Server, it is installed in the directory /usr/lib/nagios/plugins by default. You should now check that you can really use it to contact the managed server. If the managed server has IP address 192.168.1.51, the following command will do the test:
/usr/lib/nagios/plugins/check_nrpe -H 192.168.1.51
The command should output the version of the NRPE process on the remote server. If that worked, next add the check_nrpe command to the /etc/nagios2/commands.cfg file. This file should contain a section that defines check_nrpe that looks like the following:
define command{

      command_name     check_nrpe

      command_line        /usr/lib/nagios/plugins/check_nrpe -H

 $HOSTADDRESS$ -c $ARG1$

}
Now that you have defined the command, it's time to add a section to the services.cfg file. In this section you will use the generic check_nrpe command, with the particular command you want to execute on the remote host as its argument. For instance, to execute the check_disk command on all remote hosts, define the following section in /etc/nagios2/services.cfg:
define service{

     use                    generic-service

     hostgroup_name         all

     service_description    checkspace

     check_command          check_nrpe!check_disk

}
You have now finished the configuration of the NRPE plug-in that makes it possible to monitor remote hosts as well. So far, we've talked about Linux hosts only. If you like Nagios, however, you can extend it to other hosts as well. There are NRPE versions available for all major operating systems, including Windows and NetWare. Check the Web for more information on how to configure these.
Managing Nagios
Not that your Nagios server is up and running, you are ready to manage and monitor it using the web interface. In this section, you'll get a quick tour of the web interface. The first window that you should check out is the Tactical Monitoring Overview, shown in Figure 6-2. Especially when managing many nodes with Nagios, this view gives the fastest insight into what is happening on your network. The right part of the window shows you a performance summary, and the bottom part of the window shows you which hosts and services are up and how many problems have been discovered.
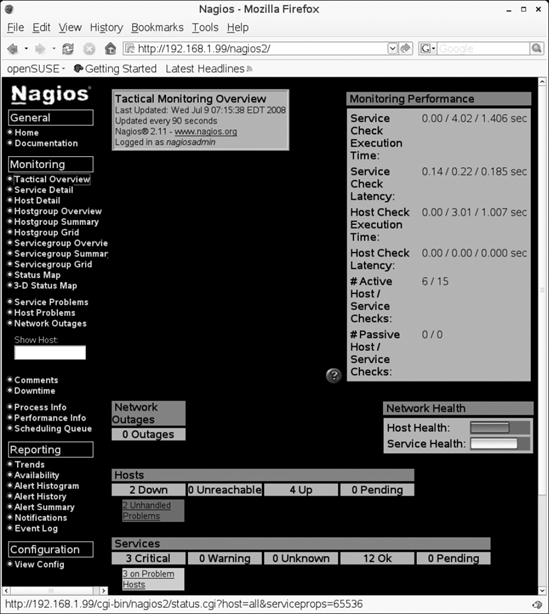
Figure 6-2. The Tactical Monitor Overview window shows you in one view what critical events have happened on your network recently.
If you observe that something may be wrong, you'll want to get more details about what is happening. The Monitoring section of Nagios offers different ways of displaying this information. In fact, all options look at the same information, but filter it differently. A very useful window is the Service Detail window, shown in Figure 6-3. From here, you can monitor in detail all the different parameters that are monitored. You can see what is happening both for services that have reached a status of CRITICAL and for services that are still OK. For instance, the disk space module will show you not only that it is OK, but also how much available disk space it has found on monitored nodes. There is just one disadvantage to the Service Detail window: if you monitor many hosts, a lot of information is presented, so it isn't easy to locate the information you need.
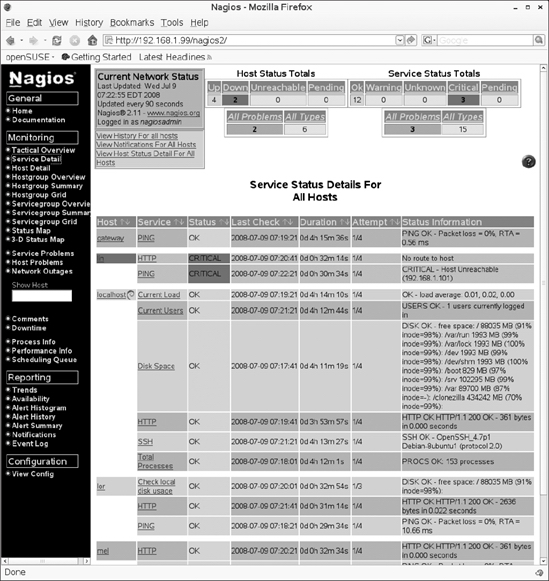
Figure 6-3. The Service Detail window provides detailed information on service performance parameters.
Especially if your Nagios environment is set up to monitor lots of hosts, you are going to like the Host Detail window. This window gives an overview of all hosts that Nagios is monitoring, and indicates per host whether or not there are problems. If problems are found, you can easily analyze what exactly is going wrong by clicking the hyperlink next to the host. This brings you to a status screen that shows in-depth information about the host. From this interface, an example of which is shown in Figure 6-4, you can also see all management options available for the host. From the Host Commands list, it is easy to switch options on or off. Also useful in this list is the Locate Host on Map option, which gives you a graphical representation of the host in the Nagios monitoring network.

Figure 6-4. The individual host view allows you to see exactly what is happening on a host.
The last options from the Monitoring section that I want to cover here are Service Problems, Host Problems, and Network Outages. Each of these gives you an overview of current problems, sorted by category. This interface helps you in solving critical issues. You can see status information, which attempts to describe what exactly is happening, and, more important, an overview of the duration of a problem. This helps you in solving the longest-existing problem first.
Below the Monitoring section of the Nagios web interface is the Reporting section. The information available here helps you in analyzing historical data. It may not be too shocking that a service has been unavailable for a couple of minutes. As an administrator, you probably want to know how often that has happened; structural problems deserve more attention than occasional problems.
To generate a report from the Reporting section, select Trends. You'll see a simple wizard, the first step of which asks you to indicate if you want to generate a trend report for a service or for a host. Select Service and next click Continue to Step 2. You now see a list of all services that are monitored on the different hosts in your network. For example, if you want to monitor disk space usage on local host, select Localhost;Disk space. Next, continue to step 3 and modify the report options as required. By default, you'll see a report over a period of the last 7 days, but if you want to show a report for the last year, that is equally possible. Next click Create Report and you will see the report displayed in the browser window.
Summary
In this chapter you have learned how to set up a Nagios server for network monitoring. You have learned how Nagios helps you to monitor critical parameters, including both parameters on the individual host that you are monitoring and network parameters. You have also learned how to enable NRPE, which allows you to monitor parameters on a remote host, even a Windows host. When configured the right way, Nagios will notify you when things go wrong. This is useful, but will not automatically restart a service after things go wrong. Heartbeat high availability is needed to do that, as described in the next chapter.