
![]()
Performance Pages and ASH Analytics
by Kellyn Pot'vin
Monitoring performance through the Top Activity feature has been one of the most utilized aspects of the Enterprise Manager since its introduction in Oracle 9i. Increased integration of optimization features as part of the existing and new performance pages in the EM12c console was one of the major accomplishments in the new release to answer the demand of more-complex database and cloud environments.
These accomplishments also include more-efficient data reporting in Top Activity, and new opportunities to utilize Active Session History (ASH) data with performance graphs in the form of ASH Analytics and Real-Time Automatic Database Diagnostic Monitor (ADDM). New advisor and reporting options from within the Top Activity and ASH Analytics interfaces exist, whereas in the past you would have been forced to leave the current performance page or open a secondary browser window or look to other tools to address issues.
Once logged into the EM12c database target interface, you can click Performance and choose various options to view activity in the database. This chapter covers the main performance categories that provide benefits in the following areas:
- Host performance home
- Performance home
- Top Activity
- ASH Analytics
- SQL Monitor
- SQL tuning options
- Advisors home
- Real-Time ADDM
- ADDM comparison reporting
You must be aware of licensing requirements with Automatic Workload Repository (AWR), ASH, and ADDM. Ensure that you are licensed for Oracle’s Diagnostic and Tuning Management packs before utilizing these performance reporting features.
Licensing information can be accessed through the EM12c console by clicking Setup ![]() Management Packs. You can view information for the individual page, for the environment as a whole, or for specific management packs/features. Figure 9-1 shows this menu hierarchy.
Management Packs. You can view information for the individual page, for the environment as a whole, or for specific management packs/features. Figure 9-1 shows this menu hierarchy.

Figure 9-1. The management pack and licensing information for any EM12c page or feature is readily available from the Setup menu in the console
![]() Tip Administrators can gain access to any management packs used for any EM12c feature within a console page by clicking Setup
Tip Administrators can gain access to any management packs used for any EM12c feature within a console page by clicking Setup ![]() Management Packs
Management Packs ![]() Packs for This Page.
Packs for This Page.
With licensing out of the way, you can focus on performance data and the many options available through the EM12c console. The most common interface utilized for performance data is at a target level, often involving a single instance or cluster database.
A host target’s performance information can be accessed from the EM console page by choosing Targets ![]() Hosts and then selecting the desired host. You can inspect basic performance metrics such as CPU utilization, memory utilization, filesystem usage, and network utilization, as shown in Figure 9-2.
Hosts and then selecting the desired host. You can inspect basic performance metrics such as CPU utilization, memory utilization, filesystem usage, and network utilization, as shown in Figure 9-2.

Figure 9-2. Host performance information—note the spike in network utilization after 1:44 PM in the bottom-right graph
In the left pane, you can view full summary information regarding the host status, incidents, configuration, and job activity.
Any fluctuations in CPU usage and memory are displayed, along with filesystem usage and network utilization. For each of the four areas (CPU, Memory, Filesystem, and Network), you can also view the data in a table format, as shown in Figure 9-3. To access this format, you click the Table View link at the bottom right of any graph. The tabular representation can be inspected for out-of-the-ordinary values that may not show as clearly in a graphic interface, or the data can be copied and pasted to a CSV or Microsoft Excel file.

Figure 9-3. Tabular display of performance metric charts in the host performance page
Each of these panes can be adjusted to display in any order you choose. Simply right-click the View Actions menu at the top right of each window to organize the performance summary view to your preference.
Performance Home
The database performance home offers a compact view of runnable processes, by CPU, including any baselines that are included for an individual database target. The performance home can be accessed in various ways, depending on the home page chosen by the administrator/user, but is always available once logged into EM12c by clicking Targets ![]() Databases and choosing a database. The Performance tab is the second from the left in the EM console database controls for the database home page (see Figure 9-4) and includes options for viewing, diagnosing, and inspecting database performance.
Databases and choosing a database. The Performance tab is the second from the left in the EM console database controls for the database home page (see Figure 9-4) and includes options for viewing, diagnosing, and inspecting database performance.

Figure 9-4. CPU usage across a database server in an Oracle 11g environment, currently set to 15-second refresh intervals, but demonstrating how to change to extended update intervals
The performance home, unlike the Top Activity performance page, is a summary of the database performance and is not specific to database performance, but overall performance of the database environment, including host and system info.
![]() Tip Historical data from this section will be based on CPU data only. If you want more-specific data on database usage, you must go to Top Activity. For less-aggregated data, refer to ASH Analytics, which is discussed later in this chapter.
Tip Historical data from this section will be based on CPU data only. If you want more-specific data on database usage, you must go to Top Activity. For less-aggregated data, refer to ASH Analytics, which is discussed later in this chapter.
The performance home grid data can be viewed and refreshed in 15-second intervals, 1-minute intervals, or manually, or you can choose a historical view. Baselines can be included or excluded in the graph, along with load averages. Options to run JVM Diagnostics, ADDM, or ASH reports are available from this section.
The main area is broken down into high-level database wait information. This view displays information about not just CPU usage, but CPU usage outside the database and the system load average.
By clicking the Settings button, shown in the upper right of Figure 9-4, you can change the chart default settings from CPU based to display I/O chart information or baseline values (see Figure 9-5).

Figure 9-5. Changing the default performance home chart settings
In Figure 9-6, the administrator has switched from high-level summary performance information to detailed performance information (not to be confused with ASH). This view can either display the foreground sessions only or include background sessions. At times, having the ability to display only foreground or background wait information is very valuable.

Figure 9-6. The Average Active Sessions pane of the performance home page in EM12c, demonstrating an average load involving both CPU and some I/O waits
![]() Tip When diagnosing performance issues, inspecting just the foreground sessions and then inspecting both foreground and background sessions can help distinguish problems such as poor ETL batch load design or an issue with cursors not being closed correctly.
Tip When diagnosing performance issues, inspecting just the foreground sessions and then inspecting both foreground and background sessions can help distinguish problems such as poor ETL batch load design or an issue with cursors not being closed correctly.
From the Average Active Sessions pane, you can quickly assess the performance statistics of the database. By clicking one of the links at the bottom of the main page, you can access the Top Activity page to perform a more detailed investigation.
Links can include the following:
- Top Segments
- Cluster Cache Coherency (in RAC)
- Interconnects (in RAC)
- Parallel Execution
- Database Locks
- SQL Monitoring
- Top Consumers
- Top Activity
- Duplicate SQL
- Instance Activity (in RAC)
Throughput
The Throughput tab shows throughput per second or per transaction. It has additional monitoring links to Top Consumers, Duplicate SQL, Instance Locks, Instance Activity, and SQL Response Time. These tabs relink back to Top Activity, locking pages, and information pages outside the Top Activity area.
I/O
The I/O tab has graphs for I/O latency in milliseconds and I/O in megabytes per second by I/O Function, Type, or Consumer Group (see Figure 9-7). There is a button to take you through a graphical interface to quickly perform I/O calibration (DBMS_RESOURCE_MANAGER.CALIBRATE_IO), needed if the database is going to utilize Auto DOP (degree of parallelism).

Figure 9-7. I/O in megabytes during a data pump operation from the performance home page
Parallel Execution
The Parallel Execution tab, shown in Figure 9-8, shows pertinent information regarding active serial/parallel sessions. In addition, a second graph shows the coordinator and slave sessions for each parallel execution, and a third graph shows DDL, DML, and queries parallelized in the database environment.

Figure 9-8. An example of parallel execution shown from the performance home, detailing parallel usage from many levels
If services are in use for the database environment, they will be available in the Services tab, shown in Figure 9-9. The data displays in a standard grid performance graph, identifying each service and its resource usage by color and by name.

Figure 9-9. Example of services and resource usage
Upon viewing the magnified legend, it is simple to see that the App1_Prod_Orcl service is utilizing the most resources in the environment. The remaining services are quite similar in resource usage and in no way match the sizeable impact of the application service.
This information can then be used to help isolate performance issues by service, helping to narrow down optimization exercises.
![]() Note The Instances tab will show only if accessing a Real Application Cluster (RAC) environment. Without this feature, there is no reason for the tab and it won’t show in the performance home page. All RAC environments that were available at the time of this writing involved Release 2 Exadata, and no actual instance information was shown in the interface. This may be a bug in the current Exadata release, or this tab may function in only non-Exadata environments.
Note The Instances tab will show only if accessing a Real Application Cluster (RAC) environment. Without this feature, there is no reason for the tab and it won’t show in the performance home page. All RAC environments that were available at the time of this writing involved Release 2 Exadata, and no actual instance information was shown in the interface. This may be a bug in the current Exadata release, or this tab may function in only non-Exadata environments.
The Top Activity page has been the cornerstone of the Enterprise Manager environment from its initial release. Administrators could review the data displayed and have a graphical representation of the wait events in the database—a simple view of database usage. From easily understood color descriptions for waits groups, an administrator could often identify performance issues and pinpoint areas of concern without advanced knowledge of performance optimization.
With the release of EM12c, the Top Activity page has been enhanced to offer more-definitive performance data, simple interface options that tie in the Top Activity interface to the performance reports (such as ASH, AWR, and advisor opportunities), and detailed session history.
The Top Activity page is the second choice in the Performance drop-down menu at the top left of the performance page view (available once the administrator has logged in to a database target). The interface has remained greatly unchanged since its initial appearance in Enterprise Manager 10g, so even those new to EM12c find the interface easy to navigate.
The upper pane of the Top Activity page, shown in Figure 9-10, provides a quick view of wait activity and active sessions in the database environment. The legend to the right indicates what each color represents on the screen, and a timeline is shown across the bottom.

Figure 9-10. Top Activity graph for EM12c, demonstrating higher than normal I/O waits
The legend on the right consists of links for the wait events, shown for each color. Clicking any of these opens the Active Sessions page for that wait event, as shown in Figure 9-11. You can then lock in on a given wait event to gather more details.

Figure 9-11. Wait events highlighted for CPU + CPU Wait
By hovering over the wait event, the resource usage in the graph for that specific wait are highlighted. Upon clicking the CPU + CPU Wait option, for example, you are connected to the page displaying the detail information on all sessions experiencing waits for CPU + CPU Wait, as shown in Figure 9-12.

Figure 9-12. Displaying only wait information for SQL ID and sessions that are experiencing waits for CPU and Waiting for CPU
The grayed area in the Top Activity graph, shown earlier in Figure 9-10, is then detailed in the lower sections of the Top Activity page, defaulting to Top SQL and Top Sessions (see Figure 9-13). Note that each of the wait areas to the left of each SQL ID in the left panel and each Session ID in the right panel are color coded in green, to show that they are CPU wait events.

Figure 9-13. Top SQL and Top Sessions, demonstrating an I/O issue in a database environment
The Top SQL section is broken down by percentage of activity, SQL ID (unique identifier for the SQL statement), and the type of SQL performed. Note that in the example shown in Figure 9-13, an apparent high I/O resource statement is being executed by two sessions. As the percentage is displayed against the rest of the database sessions, the overall impact of the wait events is clearly shown.
At this point, you have the option to schedule a SQL Tuning Advisor or create a SQL tuning set from the drop-down below the Top SQL banner. Clicking any the SQL IDs opens the SQL Details page, which provides detailed information regarding the individual SQL statements.
SQL Details Page
The I/O issue demonstrated in SQL ID cwu5p1yyp1p40 referenced back in Figure 9-12 is actually the SQL statement behind a tablespace data pump job. Clicking this SQL ID in the Top SQL section opens a second details page that provides detailed information regarding performance, statistics, explain plan, tuning history, and SQL monitoring (see Figure 9-14). The bottom pane of the page is controlled by a series of tabs that display different details regarding the statement. You can inspect each tab and research the data displayed to provide value to the issue at hand. At the top right, you can use buttons to refresh, create a SQL worksheet, perform JVM Diagnostics, or create a SQL Details active report.

Figure 9-14. Top Activity, Top SQL details, with the example of a data pump statement, identified by SQL ID
The entry point for the SQL Details page is the SQL Activity tab. This view, offering the last hour’s activity of the SQL ID under investigation, along with the statement information and wait history, is displayed clearly in a standard graph view (refer ahead to Figure 9-16). The SQL shown in the example is for a data pump job on the SYSTEM tablespace.
For procedural calls, it is extremely helpful to be able to tie the background SQL process back to its parent. To locate this from a SQL ID shown in the EM console, the following query can help:
select o.owner, o.object_name, o.object_type, s.program_line#
from v$sql s, dba_objects o
where sql_id = '<SQL_ID>'
and s.program_id=o.object_id;
The procedure or package, along with the line that the SQL call sourced from, will then be returned, thus quickly letting you know the source. This can be run from a SQL *Plus session. If you prefer to run it from the EM12c console, this can be accomplished by clicking Performance ![]() SQL
SQL ![]() Run SQL.
Run SQL.
The interface offers a simple option to execute a SQL statement or load a SQL script. Input the login to be used to execute the script (see Figure 9-15).

Figure 9-15. The Run SQL interface inEM12c, which allows SQL to be executed directly from the console
![]() Tip If you run SQL from the EM12c console on a regular basis, it is best to ensure that the Host and Database Preferred credentials are set up to reduce issues with failed executions.
Tip If you run SQL from the EM12c console on a regular basis, it is best to ensure that the Host and Database Preferred credentials are set up to reduce issues with failed executions.
Once executed, the following information is returned:
OWNER        OBJECT_NAME            OBJECT_TYPE          PROGRAM_LINE#
----------------------------------------------------------------------------
USER1        GET_NEW_FUNC           FUNCTION             9
The preceding information shows the object name, the object type, and the line number. This data can be used to quickly identify where the problem is in the code. The SQL Details Activity tab, shown in Figure 9-16, offers a SQL-specific view of Top Activity data, eliminating all other SQL waits and SQL executions, other than the one SQL ID in question. The grayed area can be moved anywhere within the timeline shown to highlight waits within the SQL activity. As this is SQL activity vs. session activity, the sessions executing the SQL in the Details page are shown at the bottom, along with percentage of activity, the session ID (SID) if the session is part of a parallel process, the QC SID (including all parallel sessions for the user executing the SQL), the program the SQL is part of, and whether there is a plan hash value that the SQL is identified with.

Figure 9-16. Activity tab of the SQL Details page
You can execute an HTML version of an AWR or ASH report from this pane to further investigate the activity and database performance by clicking a SQL ID and entering the interface for the SQL Details page.
The first tab in the SQL Details page, Statistics, contains SQL statistics data. This view, shown in Figure 9-17, gives active session information, breaking down the activity by waits, time, elapsed time (database time vs. CPU time), execution statistics, and cursor statistics.

Figure 9-17. Statistics activity in the SQL Details page
The Plan tab provides the actual explain plan for the SQL ID detailed, either in graphical or tabular format. The tabular version, shown in Figure 9-18, offers a drop-down menu if more than one hash plan value is available for the SQL statement. Basic plan information is shown, such as the parsing schema, optimizer mode, source of the statement, and capture time.
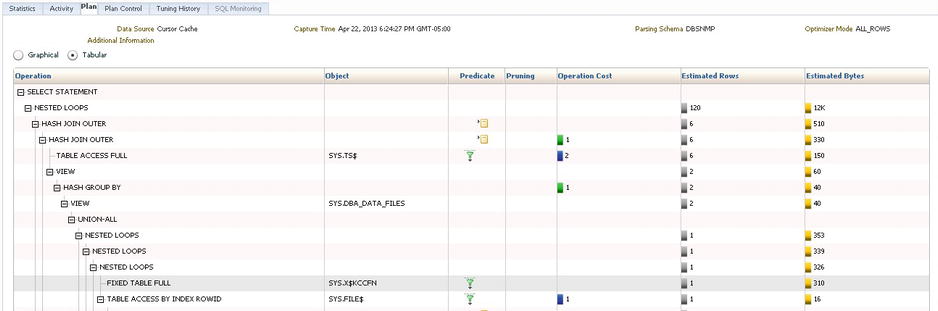
Figure 9-18. Tabular representation of an explain plan for a statement from the SQL Details page
Also provided in the EM12c console version of the tabular plan are the type of waits by legend color in the Optimization Cost section. You can also see the rows, along with a graph line to quickly access the number of rows expected to be returned, and the bytes, again displayed with a visual indicator of the number of bytes expected. You can click any of the indicators in the Predicate column (highlighted in Figure 9-18) to view predicates and filters and more-detailed information on the step in question.
The graphical version of the Plan tab in SQL Details provides a visual display of the explain plan (see Figure 9-19). This is a step-by-step path of the statement, displaying joins, loops, and group objects through the SQL execution.

Figure 9-19. Graphical explain plan for a statement, demonstrating a merge join highlighted in the console pane
Projections, definitive column joins, and even bloom filters are shown when highlighting sections of the explain plan’s graphical format. The buttons at the upper right in Figure 9-19 enable you to change the display to a vertical map from horizontal, perform a rewrite, or print out the explain plan graphic. The zoom bar on the left, under the Graphical and Tabular radio buttons, enables you to zoom in and out as needed.
SQL Plan Control
The Plan Control tab is available for advanced features such as SQL profiles, SQL patches, and SQL plan baselines. This pane is helpful in quickly determining whether a baseline is locking the plan into a potential suboptimal explain plan version, and whether a SQL profile or SQL patch is in place controlling the choice the optimizer makes for the SQL detailed in the pane. As with all tabs in the SQL Details page, you can easily execute a SQL worksheet or schedule a SQL Tuning Advisor from the bottom right of the panel.
![]() Note Because the SQL Tuning Advisor is so readily available and automated with nightly runs, SQL profiles are becoming database standards. This combination of hints, outlines, and stats, connected to a statement through its SQL ID, provides the DBA with a quick solution to nagging problems when complex issues exist in a process. As a SQL profile is connected only through the SQL ID, any change to the SQL statement stops the SQL profile from functioning.
Note Because the SQL Tuning Advisor is so readily available and automated with nightly runs, SQL profiles are becoming database standards. This combination of hints, outlines, and stats, connected to a statement through its SQL ID, provides the DBA with a quick solution to nagging problems when complex issues exist in a process. As a SQL profile is connected only through the SQL ID, any change to the SQL statement stops the SQL profile from functioning.
SQL Tuning History
The Tuning History tab supports the Plan Control section of the SQL Details page, offering historical information regarding previous advisor tasks against the SQL detailed or any ADDM findings during the historic period in question. If a SQL Tuning task has been executed against the SQL ID, it will show in the history, and a link is available to view details on the findings, even if the plan was not implemented.
The SQL Monitoring tab gives a micro-view of what is offered in the full SQL Monitor (covered in full detail later in this chapter). This grants a clear view of what SQL is being executed for the session, along with completed SQL in previous executions for the session involved, how long each execution elapsed, I/O requests, and start/finish times (see Figure 9-20).

Figure 9-20. SQL Monitoring view of a data pump process
Each of these tabs offers valuable information when inspecting a SQL statement for optimization opportunities, baseline information, explain plan stability, and resource usage. By utilizing this small section of the Top Activity page, the administrator can provide great insight quickly into any SQL statement captured.
Top Sessions encompasses the bottom-right pane of the Top Activity page by default. Although this section can be changed to display top information regarding services, modules, actions, clients, files, objects, or PL/SQL (see Figure 9-21), session information is the main data that is found most useful by administrators.

Figure 9-21. Top Sessions of the Top Activity page, along with the drop-down list of other Top options
In this pane, you can not only highlight wait events that are color coded to match the legend in the Top Activity graph, but also access links to each of the SIDs and usernames. The program executing the session is also displayed prominently to the right, helping to quickly distinguish the session.
As this page is distinguished by session information, clicking any SID opens the Session Details page.
Session Details Page
The Session Details page, unlike the SQL Details page, breaks down data at the session level. The tabs for this page are General, Activity, Statistics, Open Cursors, Blocking Tree, Wait Event History, Parallel SQL, and SQL Monitoring. Just as with the SQL Details page, the Session Details page defaults to the Activity tab, shown in Figure 9-22.

Figure 9-22. Session Details page, showing an active query execution by SID
The Activity tab shows the wait activity of the session, by color, along with the type of wait in a legend to the right side of the graph. From the right-hand corner of the page, you can enable tracing or kill the session, along with changing the refresh interval of the graph. At the bottom of the page is information regarding the 5-minute interval, highlighted in gray within the graph timeline, along with the SQL ID, which links to the SQL Details page for the statement executing during the timeline highlighted, along with the plan hash value and module information. If more than one statement is executed during the 5-minute window, all SQL IDs will be displayed in the detailed section for the interval.
The General tab, shown in Figure 9-23, displays all information regarding the session from the Top Activity page. The Session Details page, as with the SQL Details page, can be reached numerous ways from within the EM12c console, providing quick access from performance pages to the console to provide data about specific sessions.

Figure 9-23. General information in the Session Details page
The Session Details page, shown in Figure 9-24, displays the server-level information, including the OS process ID (PID), the client information, the application, any blocking that has occurred, and waits. Another section includes parallel execution information.
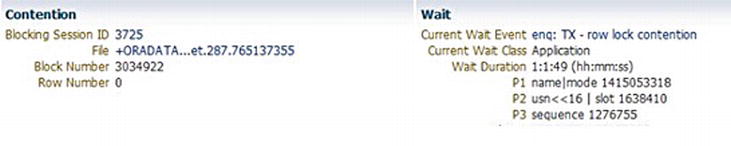
Figure 9-24. Blocking session for a Session Details General page
The Statistics tab displays all statistical information regarding the session, physical and logical waits, detailed CPU usage information, gets, and buffer information. Table 9-1 shows detailed Statistics tab information.
Table 9-1. Detailed Information on the Statistics Tab from the Session Details Page
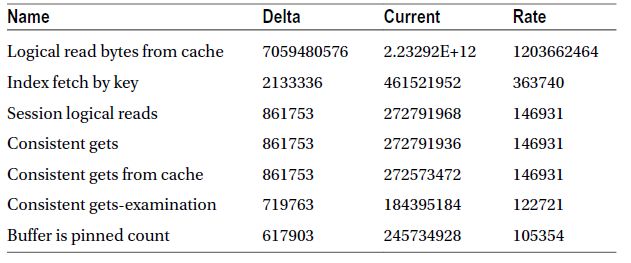
The Statistics tab contains no drill-downs or links, but it does offer the opportunity to enable tracing to collect deeper session-level data or to kill the session.
The Open Cursors tab, shown in Figure 9-25, is extremely helpful in identifying cursor- or mutex-level performance issues in a session. The pane quickly displays the cursor and count, led by the SQL ID, which will again link to the SQL Details page to identify any issues in the cursor SQL.

Figure 9-25. Open cursors for ongoing processes from the Session Details page
The session ID and username are displayed prominently in the upper-left corner. The options to either trace or kill the session are, again, available at the upper-right and lower-right corners.
The Blocking tab displays information about any blocking sessions that may be active in the environment. Because of the complexity of blocking information, this tab can take an extended time to display, but the data found in the pane is quite valuable.
The Wait Event History tab, shown in Figure 9-26, displays the wait event information, with the most recent wait event at the top. Displayed are the wait class, the actual wait event, and the P1, P2, and P3 text, all linking to detailed data about the wait information (data resulting from dba_hist_active_sess_history). The option to trace or kill the session is again offered at the top and bottom of the right-hand side.

Figure 9-26. Wait information from the Session Details page’s Wait Event History tab
The Parallel SQL tab shows data regarding any parallel execution information the session is involved in—including whether the session belongs to the coordinator or a slave, and if a slave, the producer or consumer of the parallel process.
The SQL Monitoring tab is available only for Oracle Database versions 11g Release 1 for the command-line data, and 11g Release 2 for the HTML version of the reports. This tab appears grayed out in environments that do not have this feature set up or available.
The Top Activity area of the performance pages in the EM12c console has a user-friendly interface for the seasoned administrator with previous Enterprise Manager experience and new, detailed information to assist with session and SQL performance issues.
ASH Analytics
Analyzing performance across multiple dimensions is a capability that administrators have searched for in the Enterprise Manager Top Activity graphs without success. ASH Analytics was introduced to offer Active Session History data in a visual format that previously wasn’t offered. The feature offers recursive drill-downs, stacked chart or tree map views, and the ability to incorporate the current report data into a collaborative view with other ASH reporting.
![]() Note ASH Analytics is not installed by default. The ASH_VIEWER package must be installed to use the ASH Analytics view. The database must be an 11g version or higher. An installation will be successful on many 10g instances, but no data will be displayed on the screen, as the required Active Session History will not be available to fulfill the graphs.
Note ASH Analytics is not installed by default. The ASH_VIEWER package must be installed to use the ASH Analytics view. The database must be an 11g version or higher. An installation will be successful on many 10g instances, but no data will be displayed on the screen, as the required Active Session History will not be available to fulfill the graphs.
The main ASH Analytics screen shows data displayed by Average Active Sessions (AAS), viewed by graph or load map. Numerous drill-down opportunities exist in the main performance view, allowing for distinct research areas to be investigated.
The upper display of the ASH Analytics main page, shown in Figure 9-27, can be changed to display data by hour, day, week, or month. Alternatively, you can customize the display to show more-pertinent data to the monitoring task.

Figure 9-27. ASH Analytics main performance graph
![]() Note If choosing the Max display type for ASH Analytics, the data will be displayed differently than how other wait event types commonly would be displayed. Ensure that you understand how choosing Max will impact the data dispersion in the graph and load map so that an inaccurate diagnosis does not occur.
Note If choosing the Max display type for ASH Analytics, the data will be displayed differently than how other wait event types commonly would be displayed. Ensure that you understand how choosing Max will impact the data dispersion in the graph and load map so that an inaccurate diagnosis does not occur.
Being able to save ASH Analytics data locally to a file or to e-mail an HTML report are valuable options if you need to retain the data or provide information to key members of the team. From the main view, you can also expand the window to full screen and change the refresh interval. Arrows at the left and right of the timeline enable you to easily maneuver to earlier timelines or future ones if refreshes have been stopped.
The gray highlighted section in the window, as shown in Figure 9-27, quickly draws the administrator’s eye down, further detailing a 5-minute sample of ASH data to the graph, including wait events and defaulting with Wait Class events.
The lower Activity pane of the ASH Analytics page, shown in Figure 9-28, displays data in a format similar to Top Activity, but the data is based on the V$ACTIVE_SESSION_HISTORY view and has more performance data available for access from the links shown.

Figure 9-28. The Activity pane for ASH Analytics
The SQL ID section at the lower left links to the SQL Details page. The User Session section on the right links to the Session Details page. The drop-down Wait Class options are extensive, as seen in Figure 9-29.
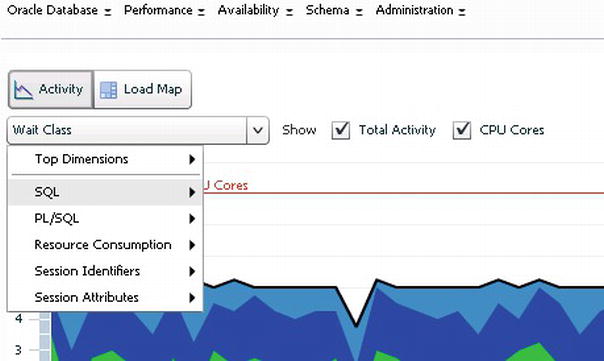
Figure 9-29. The drop-down menu options for the ASH Analytics Wait Class
SQL can be broken down in many ways within the ASH Analytics Activity view. The options are shown in Table 9-2. Depending on the needs of the administrator, the order of the presentation can be changed.
Table 9-2. The Wait Class Options and Suboptions
| Option | Suboptions |
|---|---|
| SQL | SQL ID Top Level SQL ID SQL Force Matching Signature SQL Plan Hash Value SQL Plan Operation SQL Plan Operation Line SQL Opcode Top Level SQL Opcode |
| PL/SQL | PL/SQL Top Level PL/SQL |
| Resource Consumption | Wait Class Wait Event Object Blocking Session |
| Session Identifiers | Instance Service User Session Parallel Process User ID Program Session Type |
| Session Attributes | Consumer Group Module Action |
Each of these options gives a unique view of waits and/or resource usage in the environment. You can choose the combination that best suits the situation at hand and then view the data to investigate the issue.
You can choose the Top Level SQL ID, subsequently creating a very different view of the database performance, and showing the percentage impact from the statement having that ID. See Figure 9-30.

Figure 9-30. Top-level SQL ID activity in ASH Analytics
The percentage of impact of SQL ID cwu5p1yyp1p40 in Figure 9-30 is clearly demonstrated in the graph, which shows that two user sessions were executing the statement throughout the timeline. This can be assumed by the associated colors from the graph that identify the SQL ID and the user session, but also can be verified by clicking each of the links to the user sessions, which will then show the SQL ID okwk7211pw296 identified with each.
The example in Figure 9-31 still displays the overall total activity as a black line in the graph. The system response time per call, which encompasses usage by two CPUs, also shows a small “blip” of activity when ASH data samples are rolled up into the AWR.

Figure 9-31. ASH Analytics, graphing by action, showing system response time, DB wait time and ASH roll-up
The load map, shown in Figure 9-32, is the second choice for viewing data from ASH Analytics. The Activity graph is the view most administrators are familiar with from years of Enterprise Manager experience. The load map is a new way to display all data found in ASH Analytics, but often more clear for nonadministrator groups.

Figure 9-32. An ASH Analytics advanced load map displaying wait class and SQL ID
![]() Tip The load map view is often lost on the administrator, who is familiar with and has training to understand data displayed from Top Activity. The load map displays performance data in a way that has more visual impact.
Tip The load map view is often lost on the administrator, who is familiar with and has training to understand data displayed from Top Activity. The load map displays performance data in a way that has more visual impact.
The load map in Figure 9-32 shows SQL ID csu5p1yyp1p40 as almost 50 percent of the resource usage in the environment. For a nonadministrator, this representation provides a clearer picture of the SQL affecting performance than a graph display of the same data, which might very well be misleading.
The same load map can then be changed to display the SQL IDs, but this time sorted by user session. Figure 9-33 shows the same load as in Figure 9-32, but the percentages are broken out by user session first, and then by SQL ID within each session.

Figure 9-33. An ASH Analytics advanced load map, displayed by user session and SQL ID
Dimensions for the same load map can be adjusted, and sample size can be changed (see Figure 9-34).

Figure 9-34. An ASH Analytics load map with diminished dimensions and sample size
The example in Figure 9-34 displays only the user session information. If you use an advanced load map setting and limiting the samples to three, you can display even smaller subsets of sample information.
By then increasing to three dimensions, building each of these dimensions by wait class, SQL ID, and client, you can create a load map that shows the SQL ID as the header in each section, along with client information and then the wait class indicator (see Figure 9-35).

Figure 9-35. ASH Analytics, displaying an advanced, three-dimension load map
ASH Analytics is the future of Top Activity. With the advancements in ASH expected in future releases of Oracle, ASH Analytics will continue to provide more-enhanced performance data for the Oracle database environment.
SQL Monitoring
SQL Monitor, introduced in Oracle 11g, has been hailed as one of the best new features. The graphical display of SQL Monitor within Enterprise Manager offers a secondary view to session data in the database (see Figure 9-36).
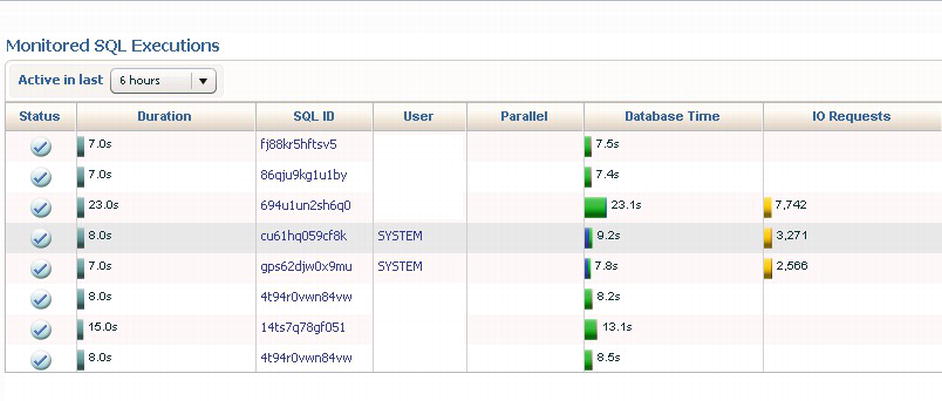
Figure 9-36. SQL executing in the SQL Monitor
Data, ordered by active sessions displayed at the top, is followed by an active duration window, SQL ID, user info, database time, I/O wait info, start time, end time, and SQL text in the main monitoring view, as shown in Figure 9-37. The page also offers links for SQL ID and user sessions to the Monitored Executions page.

Figure 9-37. The top section of the SQL Monitor, the Monitored SQL Execution Details page
![]() Tip If there is one view that an administrator should consider giving view-only access to for monitoring activity in a database environment, the SQL Monitor is it. This view is exceptionally easy to use and offers incredibly valuable information regarding activity and performance. The SQL Monitor view offers quick access to alert the developer or analyst when something may be amiss that would be less likely to escalate to an incident in the EM12c, but may still require an administrator’s assistance. In the development lifecycle, this can offer members of the database team another way to visually monitor what is occurring during both development and testing phases.
Tip If there is one view that an administrator should consider giving view-only access to for monitoring activity in a database environment, the SQL Monitor is it. This view is exceptionally easy to use and offers incredibly valuable information regarding activity and performance. The SQL Monitor view offers quick access to alert the developer or analyst when something may be amiss that would be less likely to escalate to an incident in the EM12c, but may still require an administrator’s assistance. In the development lifecycle, this can offer members of the database team another way to visually monitor what is occurring during both development and testing phases.
Whereas Top Activity and ASH Analytics share detail pages for SQL ID and user sessions, SQL Monitor shares session details only with user sessions and CPU usage. For SQL ID, the SQL Monitor has its own performance page data based on the execution of DBMS_SQLTUNE.REPORT_SQL_MONITOR by the EM12c console to populate the main SQL Monitoring page.
Figure 9-38 is a graphical representation of this report as report_level=>'ALL' is executed by the EM12c console. This same report can be executed using the package from the command line as well, but the EM12c SQL Monitor interface conveniently populates and displays the data in a user-friendly format for the administrator.

Figure 9-38. The lower pane of the Monitored SQL Executions Details report by the SQL Monitor for SQL_IDs involved in the snapshot
The view can be adjusted to show SQL-specific metrics, as shown in Figure 9-39, by simply clicking the Metrics button in the upper-left corner. The data can be incredibly detailed and valuable when investigating an impacting SQL statement.

Figure 9-39. Metric usage from the same report time as the SQL Monitor report in Figure 9-37, indicating CPU and I/O read and write requests in bytes
Whereas Figure 9-39 shows CPU and I/O read and write requests from the report, Figure 9-40 shows the results of I/O throughput and PGA usage. This data shows the CPU usage and waits for CPU by the statement. By taking this data and intersecting the high/low points, you can build a clear picture of how the read and write requests are affected by CPU usage and CPU waits.

Figure 9-40. SQL Monitor demonstrating I/O throughput by reads and writes in bytes
By inspecting the I/O throughput and then comparing it to the PGA, you can also pinpoint when sorting and hashing may occur within the PGA and when it may “swap” to temp, (causing higher I/O due to temp tablespace reads/writes).
The final section, shown in Figure 9-41, displays specific temp usage. For DSS and OLAP environments, knowing temp usage can be very helpful. The SQL Monitor displays this in the SQL Monitor detail report.

Figure 9-41. Temp usage from the SQL Monitor report, displayed in a graph
Using these specific SQL Monitor graphs offers high-level images detailing valuable usage areas outside of just monitoring database activity from the SQL perspective. Whereas an administrator might query over a period of time any of these areas or a combination of them, SQL Monitor is always available and clearly graphs out the recent usage for each.
The SQL submenu within the database target home page has numerous options, including these:
- SQL Performance Analyzer
- SQL Access Advisor
- SQL Tuning Advisor
- SQL Tuning Sets
- SQL Plan Control
- Optimizer Statistics
SQL Performance Analyzer
The SQL Performance Analyzer, although easily accessible through the Performance drop-down, is part of the Advisor Central provision of EM12c features. The Analyzer provides a simple wizard to test and analyze how changes to a database environment will affect a SQL tuning set.
This enables you to test the following in a session-level environment, without affecting users:
- Changes in version compatibility
- Parameter changes
- Optimizer statistics
- Exadata simulation
- Guided workflow
SQL Performance Analyzer tasks can be created by clicking any of the links and working through the wizards. The tasks are then scheduled as an EM Job in the EM12c environment. You may check the status by manually refreshing the interface view or by leaving the View Data option at its default, which uses a 15-second interval.
SQL Access Advisor
The SQL Access Advisor provides a graphical interface for evaluating existing objects in the database for efficiency or recommending new objects that may increase performance through physical optimization options. Figure 9-42 shows the initial advisor options available from the interface.

Figure 9-42. The SQL Access Advisor performance options for database targets
The SQL Access Advisor (accessible from the Performance drop-down, but part of the Advisor Central features) has two options. The first inspects current objects and makes recommendations based on what is already present in the system. The second option inspects historical SQL for recommendations on indexes and materialized views that could assist in performance gains. As with any advisor, you must review and verify the SQL Access Advisor recommendations before implementing them.
SQL Tuning Sets
A SQL tuning set is a collection of SQL statements, which can be bound by executing schema, application module/action, or a set of bind variables, cursor fetches, execution count, command type, or optimizer cost.
SQL tuning sets can be migrated to other databases, allowing the administrator to perform tuning tests on other environments. Production performance issues can be migrated to a secondary stage environment to duplicate the issues experienced and resolution scenarios tested.
![]() Note Understanding the SQL is essential for an administrator who wants to understand usage and optimization in their database environment. The SQL Tuning Advisor and the SQL Access Advisor utilize SQL tuning sets to give the best advice on optimizing the Oracle environment.
Note Understanding the SQL is essential for an administrator who wants to understand usage and optimization in their database environment. The SQL Tuning Advisor and the SQL Access Advisor utilize SQL tuning sets to give the best advice on optimizing the Oracle environment.
Another option for controlling performance is to create and store SQL plans. SQL plans are one of the features utilized by SQL profiles and can be viewed in the SQL Plans section by clicking Performance ![]() SQL
SQL ![]() SQL Plan Control from the Database performance home page (see Figure 9-43).
SQL Plan Control from the Database performance home page (see Figure 9-43).
The benefit of having one view for all plan control is that if a statement has changed and there is a question about whether plan control is in place, the DBA can easily access and verify from the panel instead o having to search for the SQL ID.

Figure 9-43. SQL plans created as part of SQL profiles
Statistics are the core of Oracle’s Cost-Based Optimizer (CBO.) As an administrator deepens their knowledge of performance and optimization, their knowledge of statistics must increase as well. EM12c offers a number of graphical user interfaces to lessen demands on command-line requirements, but the knowledge of how statistics help the CBO make optimization choices is a key to any Oracle database specialist’s skill set.
Graphic options to gather, restore, lock, and manage statistics are a powerful tool in the hands of an administrator. The Performance drop-down menu of the database target in EM12c enables you to set default options for optimizer statistics, along with addressing performance issues with the CBO (see Figure 9-44).

Figure 9-44. Managing optimizer statistics in the EM12c Performance console
Each of the links accesses a different area for managing database statistics. This includes operational tasks. From a lower section, you can access object-level and global-level statistics, along with scheduling and automating.
Cloud Control SQL History
The Cloud Control SQL History, unlike history from other SQL, includes SQL executed by EM12c for managing and monitoring the database environment. The view provides not just SQL_TEXT, but the start time, the duration and the URL (see Figure 9-45). The URL is extremely valuable, as it is descriptive enough to inform you which EM12c feature was responsible for the SQL executed.
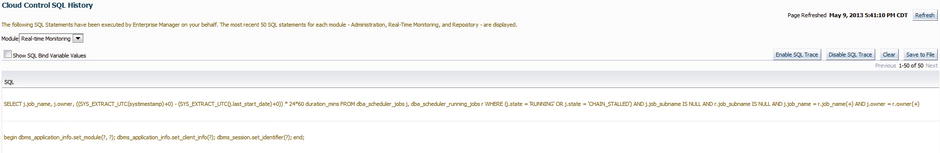
Figure 9-45. Information regarding a SQL statement from the cloud control that was issued by the SQL Monitor in EM12c
You can also issue an EM12c operation-specific trace if concerned about performance or investigating an issue. You can enable or disable the trace by simply clicking a button at the top-right side of the Cloud Control SQL History interface.
![]() Note Cloud Control SQL History is a pop-up, unlike most other features within the EM12c environment. For this feature to function correctly, you must enable pop-ups in Enterprise Manager.
Note Cloud Control SQL History is a pop-up, unlike most other features within the EM12c environment. For this feature to function correctly, you must enable pop-ups in Enterprise Manager.
The Advisor home, shown in Figure 9-46, is the one-stop location in the EM12c console for viewing, scheduling, and managing Oracle’s advisors. However, you should be aware that many of the features are also available from the Performance drop-down menu in the Database Management interface.

Figure 9-46. Advisor Central, displaying the tab options and main advisors available
Advisor Central has a two-tab setup, defaulting to the Advisors page. This page offers options to run ADDM reports and to check on undo management performance, segment advisors, SQL Advisors, and others.
The second tab, Checkers, offers a wide variety of options for integrity checks of the database (see Figure 9-47).

Figure 9-47. Advisor Central’s database integrity checker options
The Performance section of each database target in the EM12c console offers incredible insight into the database, along with optimizing options for its long-term health.
Emergency Monitoring enables you to monitor basic processing and database information of an unresponsive database. The proprietary mechanism is available through EM12c and the Enterprise Manager Command Line Interface (EMCLI) and allows the administrator to diagnose performance issues, conduct hang analysis, and kill blocking sessions.
Emergency Monitoring requires SYSDBA access and DB Host access for the Oracle user to successfully implement.
A troubling scenario for an administrator is a hung database. The conundrum of deciding whether to quickly bounce the database—thereby removing the obstacle causing the hang situation but often losing all valuable data to diagnose the cause—has resulted in Oracle offering Real-Time ADDM.
Real-Time ADDM offers real-time analysis of a slow or hung database system and diagnoses deadlocks, performance impacts, and resource contention (see Table 9-3). The Real-Time ADDM feature uses DB Time as the basis for all performance measurements. It also identifies any configuration changes that have occurred, weighing both sets of metrics to report and compare.
Table 9-3. Inaccessible Monitoring Issues That Can Be Solved with Real-Time ADDM

As Real-Time ADDM makes only a lightweight connection, also referred to as a direct connection to the SGA without requiring any additional locking or resources by bypassing the SQL layer and connecting through the agent, it is able to complete connections that would otherwise be impossible with traditional connection types.
Real-Time ADDM can analyze data returned numerous ways to the database, including the SQL layer and JDBC connection.
When performance changes in the matter of a day or an hour, Real-Time ADDM can be used to analyze what changes were made, and to verify new batch jobs, workloads, or configuration changes.
Real-Time ADDM is available from the Performance drop-down menu from any EM12c database target. Figure 9-48 shows the login dialog box for the ADDM console.

Figure 9-48. Logging in to the Real-Time ADDM console requires SYSDBA credentials
The analysis can be performed on a single instance, RAC environment, or even an engineered system, such as Exadata.
The Top Activity view, shown in Figure 9-49, displays about 1 hour of data, along with approximately 10 minutes of previous ASH data, so you can inspect for issues that are the cause of a database hang.

Figure 9-49. Top Activity view through Real-Time ADDM
The top section appears very similar to Top Activity, but is actually sourced from ASH data.
To start the Real-Time ADDM analysis, you click the Start button, shown in Figure 9-50.

Figure 9-50. Real-Time ADDM analysis interface for EM12c
If the database is in a hung state, the status will be shown, notifying of the database’s inability to accept connections. Real-Time ADDM will proceed with verifying credentials, providing connection options to be used, and performing hang analysis.
The report generated is displayed in six tab views, including the Progress tab, General Findings, Hardware Resources (detailing any hardware issues that are discovered), Activity (providing analysis of database sessions), Hang Data (providing information specific to the cause of the database hang), and Statistics (providing details on the analysis report).
The option to save or e-mail the results in HTML format is available at the upper-right corner of the Real-Time ADDM interface.
ADDM Comparison Report
Often the administrator is faced with performance differences in two time periods, when none should occur. The ability to perform a cause-to-effect analysis for two ADDM reports is available as part of the ADDM comparison report.
The ADDM comparison report is available by choosing Performance ![]() AWR
AWR ![]() Compare Period ADDM for any database target. After clicking the link, you will be asked to submit information about the begin time and end time for the timeline in question (see Figure 9-51). In the lower section, you then choose a base period for comparison from drop-down options that include the preceding time period, the previous day, or the previous week.
Compare Period ADDM for any database target. After clicking the link, you will be asked to submit information about the begin time and end time for the timeline in question (see Figure 9-51). In the lower section, you then choose a base period for comparison from drop-down options that include the preceding time period, the previous day, or the previous week.

Figure 9-51. Choosing options for a comparison ADDM report
![]() Note The ADDM comparison report requires the installation of PL/SQL packages to be used by the EM12c agent user on the target to perform the comparison report and is not installed by default. This installation is performed as an EM Job and can be implemented immediately or scheduled to execute at a later date and time.
Note The ADDM comparison report requires the installation of PL/SQL packages to be used by the EM12c agent user on the target to perform the comparison report and is not installed by default. This installation is performed as an EM Job and can be implemented immediately or scheduled to execute at a later date and time.
In the example in Figure 9-52, the options are shown for choices in comparisons of an ADDM report. The latest offset, a baseline or a custom begin and end time can be chosen.

Figure 9-52. ADDM comparison report activity
Below Detail for Selected 30 Minute Interval, you can locate the time of the section detailed in the bottom panes of the Top Activity graph. Using this information, you then can click Compare Period ADDM to identify any specific activity that was out of ordinary for the timeline of concern (see Figure 9-53).

Figure 9-53. Locating ADDM comparison reports in the EM12c database target interface
Choosing a timeline that matches the scenario from Figure 9-52 to grant us the clearest view of the problem is essential.
As the Top Activity starts at 11:30 PM and is for a 30-minute period, the appropriate choice for an accurate comparison is to also match this in the ADDM Begin Time and set the End Time to 30 minutes later, resulting in an end-time “starting minute” of 11:59 PM.
As the night of the activity is on a Saturday, and the goal is to know what has changed from the hour previously, we will compare it to the preceding period.
Figure 9-54 shows the resulting settings for the Comparison ADDM Report fields.

Figure 9-54. Comparison timelines and baselines
Clicking Run executes the ADDM comparison report. The report first indicates the commonality of the two timelines (see Figure 9-55).

Figure 9-55. An ADDM comparison report, comparing the previous hour with an hour of higher usage
Note that the duration of the comparison is for the entire 1-hour snapshot, even though time was entered for a half hour. If snapshot intervals are set to occur more often than the default (1 hour), the ADDM comparison will show results for the minimum number of snapshots required to cover the beginning and end time chosen.
Inspecting the left-hand values in the graph, you must note that the average sessions shown is not a one-to-one representation between the graphs, but independent of each session to best demonstrate the data for each period used in the comparison. Each period graph also contains its own legend for wait event types, to the right of each graph.
The bottom of each graph clearly shows the average active sessions, along with buttons at the top right to save or e-mail the graphs in HTML format.
The Details pane in the bottom section of the ADDM comparison report is divided into three sections: Configuration, Finding, and Resource.
The Configuration section of the ADDM comparison report presents information regarding physical configurations, parameter settings, and session parameters that may have impacted the difference in the periods compared (see Figure 9-56).

Figure 9-56. The Configuration section of the ADDM comparison report, set to show All configuration values
You can show just differences (by default) or show all configuration values. If a review of all configuration values is warranted, this does offer a quick review of the parameter settings and session values.
Finding
The Finding section presents each Performance Difference type, percentage of impact, and then the percentage of impact it created for each base period (see Figure 9-57). Since these values can be positive for one period and negative for another, you should note the totals for the change impact and ensure that the change impact is clearly understood for the comparison period in case the problem was one that had escalated over multiple time periods. If escalation did occur, the change impact percentage could be misleading, and the overall impact to the environment over a larger period of time should be taken into consideration.

Figure 9-57. Findings for the ADDM comparison report, showing both improvement and degradation in performance between the two periods of the comparison
For each Performance Difference, detailed information is displayed below the Details pane. As performance regression was discovered for Top Segments by User I/O, the following findings resulted:
- Individual database segments responsible for significant User I/O and Cluster waits were found.
- Impact changed from 0.04 active sessions to 0.1 active sessions, by –5%.
The Resource detail reports on differences in CPU, memory, I/O, and interconnect (if RAC is involved). This data can be represented in either a graphical form, shown in Figure 9-58, or in a tabular report, shown in Figure 9-59.

Figure 9-58. Tabular representation of detail data on memory differences between two ADDM timelines in a comparison report

Figure 9-59. Graphical representation of detail data on I/O difference between two ADDM timelines in a comparison report
With this detailed data, you can quickly assess that there was a 75 percent jump in memory usage and a significant difference in data-file single-block read latency between the two timelines used in the comparison.
As with other reports in the EM12c interface, there is an option to save or e-mail an HTML report for later review or to retain for historical reference.
Summary
As the need for automating and optimizing the database and its environment increases, the importance of the Enterprise Manager 12c performance console will increase in demand as well. Top Activity will slowly migrate to ASH Analytics, with its robust, transparent, and effective reporting. The opportunities to gather data from a simple and efficient graphical interface and provide effective optimization recommendations and monitoring provide the clear direction for enterprise-level database control.