
![]()
Performance Monitoring and Optimizing
An installed Linux server comes with default performance settings. That means that it will perform well for an average workload. Unfortunately, many servers are going beyond average, which means that optimization can be applied. In this chapter, you’ll read how to monitor and optimize performance. The first part of this chapter is about performance monitoring. In the second part, you’ll learn how to optimize performance.
The following topics are covered in this chapter:
- Performance Monitoring
- Optimizing Performance
- Optimizing Linux Performance Using Cgroups
Performance Monitoring
Before you can actually optimize anything, you have to know what’s going on. In this first section of the chapter, you’ll learn how to analyze performance. We’ll start with one of the most common but also one of the most informative tools: top.
Interpreting What’s Going On: top
Before starting to look at details, you should have a general overview of the current state of your server. The top utility is an excellent tool to help you with that. Let’s start by having a look at a server that is used as a virtualization server, hosting multiple virtual machines (see Listing 15-1).
Listing 15-1. Using top on a Busy Server
top - 10:47: 49 up 1 day, 16:56, 3 users, load average: 0.08, 0.06, 0.10
Tasks:  409 total, 1 running, 408 sleeping, 0 stopped, 0 zombie
%Cpu(s): 1.6 us, 0.4 sy, 0.0 ni, 98.0 id, 0.0 wa, 0.0 hi, 0.0 si, 0.0 st
KiB Mem: 16196548 total, 13197772 used, 2998776 free, 4692 buffers
KiB Swap: 4194300 total, 0 used, 4194300 free. 4679428 cached Mem

PID   USER      PR  NI  VIRT     RES    SHR  S  %CPU %MEM   TIME+   COMMAND
1489  root      20   0 1074368  23568  11836 S   3.3  0.1  51:18.32 libvirtd
12730 root      20   0 6018668 2.058g  56760 S   2.7 13.3  52:07.62 virt-manager
19586 qemu      20   0 1320328 532616   8028 S   2.0  3.3  23:08.54 qemu-kvm
13719 qemu      20   0 1211512 508476   8028 S   1.7  3.1  23:42.33 qemu-kvm
18450 qemu      20   0 1336528 526252   8016 S   1.7  3.2  23:39.71 qemu-kvm
18513 qemu      20   0 1274928 463408   8036 S   1.7  2.9  23:28.97 qemu-kvm
18540 qemu      20   0 1274932 467276   8020 S   1.7  2.9  23:32.23 qemu-kvm
19542 qemu      20   0 1320840 514224   8032 S   1.7  3.2  23:03.55 qemu-kvm
19631 qemu      20   0 1315620 501828   8012 S   1.7  3.1  23:10.92 qemu-kvm
24773 qemu      20   0 1342848 547784   8016 S   1.7  3.4  23:38.80 qemu-kvm
 3572 root      20   0  950484 148812  42644 S   1.3  0.9  39:24.33 firefox
16388 qemu      20   0 1275076 465400   7996 S   1.3  2.9  22:51.46 qemu-kvm
18919 qemu      20   0 1318728 510000   8020 S   1.3  3.1  23:46.81 qemu-kvm
28791 root      20   0  123792   1876   1152 R   0.3  0.0   0:00.03 top
    1 root      20   0   53500   7644   3788 S   0.0  0.0   0:07.07 systemd
    2 root      20   0       0      0      0 S   0.0  0.0   0:00.13 kthreadd
    3 root      20   0       0      0      0 S   0.0  0.0   0:03.27 ksoftirqd/0
    5 root       0 -20       0      0      0 S   0.0  0.0   0:00.00 kworker/0:0H
    7 root      rt   0       0      0      0 S   0.0  0.0   0:00.19 migration/0
    8 root      20   0       0      0      0 S   0.0  0.0   0:00.00 rcu_bh
    9 root      20   0       0      0      0 S   0.0  0.0   0:00.00 rcuob/0
   10 root      20   0       0      0      0 S   0.0  0.0   0:00.00 rcuob/1
   11 root      20   0       0      0      0 S   0.0  0.0   0:00.00 rcuob/2
CPU Monitoring with top
When analyzing performance, you start at the first line of the top output. The load average parameters at the end of the line are of special interest. There are three of them, indicating the load average for the last minute, the last five minutes, and the last fifteen minutes. The load average gives the average amount of processes that were in the run queue. Stated otherwise, the load average gives that which is actually being handled, or waiting to be handled. As ultimately a CPU core can handle one process at any moment only, a load average of 1.00 on a 1-CPU would be the ideal load, indicating that the CPU is completely busy.
Looking at load average in this way is a little bit too simple, though. Some processes don’t demand that much from the CPU; other processes do. So, in some cases, performance can be good on a 1-CPU system that gives a load average of 8.00, while on other occasions, performance might be suffering, if load average is only at 1.00. Load average is a good start, but it’s not good enough just by itself.
Consider, for example, a task that is running completely on the CPU. You can force such a task by entering the following code line:
while true; do true; done
This task will completely claim one CPU core, thus causing a workload of 1.00. Because, however, this is a task that doesn’t do any input/output (I/O), the task does not have waiting times, and therefore, for a task like this, 1.00 is considered a heavy workload, because if another task is started, processes will have to be queued owing to of a lack of available resources.
Let’s now consider a task that is I/O intensive, such as a task in which your complete hard drive is copied to the null device (dd if=/dev/sda of=/dev/null). This task will also easily cause a workload that is 1.00 or higher, but because there is a lot of waiting for I/O involved in a task like that, it’s not as bad as the while true task. That is because while waiting for I/O, the CPU can do something else. So don’t be too quick in drawing conclusions from the load line.
When seeing that your server’s CPUs are very busy, you should further analyze. First, you should relate the load average to the amount of CPUs in your server. By default, top provides a summary for all CPUs in your server. Press the 1 on the keyboard, to show a line for each CPU core in your server. Because most modern servers are multi-core, you should apply this option, as it gives you information about the multiprocessing environment as well. In Listing 15-2, you can see an example in which usage statistics are provided on a four-core server:
Listing 15-2. Monitoring Performance on a Four-Core Server
top - 11:06:29 up 1 day, 17:15, 3 users, load average: 6.80, 4.20, 1.95
Tasks : 424 total, 3 running, 421 sleeping, 0 stopped, 0 zombie
%Cpu0 : 84.9 us, 11.7 sy, 0.0 ni, 2.0 id, 0.7 wa, 0.0 hi, 0.7 si, 0.0 st
%Cpu1 : 86.6 us,  9.4 sy, 0.0 ni, 3.0 id, 0.3 wa, 0.0 hi, 0.7 si, 0.0 st
%Cpu2 : 86.6 us,  9.7 sy, 0.0 ni, 2.7 id, 0.7 wa, 0.0 hi, 0.3 si, 0.0 st
%Cpu3 : 88.0 us,  9.0 sy, 0.0 ni, 2.7 id, 0.3 wa, 0.0 hi, 0.0 si, 0.0 st
KiB Mem: 16196548 total, 16021536 used, 175012 free, 3956 buffers
KiB Swap: 4194300 total, 10072 used, 4184228 free. 3700732 cached Mem

PID   USER      PR  NI  VIRT    RES      SHR S  %CPU %MEM   TIME+   COMMAND
29694 qemu      20   0 1424580 658276   8068 S  72.6  4.1   3:30.70 qemu-kvm
29934 qemu      20   0 1221208 614936   8064 S  69.7  3.8   1:08.35 qemu-kvm
29863 qemu      20   0 1386616 637948   8052 S  56.7  3.9   1:54.51 qemu-kvm
29627 qemu      20   0 1417552 643716   8064 S  56.1  4.0   4:37.15 qemu-kvm
29785 qemu      20   0 1425656 657500   8064 S  54.7  4.1   2:39.03 qemu-kvm
12730 root      20   0 7276512 2.566g  70496 R  26.5 16.6  54:20.94 virt-manager
 3225 root      20   0 1950632 215728  35300 S  25.2  1.3  14:52.82 gnome-shell
 1489 root      20   0 1074368  23600  11836 S   6.6  0.1  52:09.98 libvirtd
 1144 root      20   0  226540  51348  35704 S   6.3  0.3   4:19.12 Xorg
18540 qemu      20   0 1274932 467276   8020 R   6.0  2.9  23:47.89 qemu-kvm
18450 qemu      20   0 1336528 526252   8016 S   2.3  3.2  23:55.18 qemu-kvm
18919 qemu      20   0 1318728 510000   8020 S   1.0  3.1  24:02.42 qemu-kvm
19631 qemu      20   0 1315620 501828   8012 S   1.0  3.1  23:26.65 qemu-kvm
24773 qemu      20   0 1334652 538816   8016 S   1.0  3.3  23:54.71 qemu-kvm
 3572 root      20   0  950484 172500  42636 S   0.7  1.1  39:36.99 firefox
28791 root      20   0  123792   1876   1152 R   0.7  0.0   0:03.25 top
  339 root       0 -20       0      0      0 S   0.3  0.0   0:04.00 kworker/1:1H
  428 root      20   0       0      0      0 S   0.3  0.0   0:39.65 xfsaild/dm-1
  921 root      20   0   19112   1164    948 S   0.3  0.0   0:09.19 irqbalance
26424 root      20   0       0      0      0 S   0.3  0.0   0:00.13 kworker/u8:2
When considering exactly what your server is doing, the CPU lines are an important indicator. In there, you can monitor CPU performance, divided in different performance categories. In the following list, you can see these options summarized:
- us: This refers to a workload in user space. Typically, this relates to processes that are started by end users and don’t run with root priorities. If you see a high load in here, that means that your server is heavily used by applications.
- sy: This refers to the work that is done in system space. These are important tasks in which the kernel of your operating system is involved as well. Load average in here should, in general, not be too high. You can see it elevated when particular jobs are executed, for example, a large compiling job. If the load here is high, it can indicate elevated hardware activity.
- ni: This indicator relates to the amount of jobs started with an adjusted nice value.
- id: Here you can see how busy the idle loop is. This special loop indicates the amount of time that your CPU is doing nothing. Therefore, a high percentage in the idle loop means a CPU that is not too busy.
- wa: This is an important indicator. The wa parameter refers to the amount of time that your CPU is waiting for I/O. If the value that you see here is often above 30 percent, that could indicate a problem on the I/O-channel, which involves storage and network. See the sections “Monitoring Storage Performance” and “Understanding Network Performance” later in this chapter to find out what may be happening.
- hi: The hi parameter relates to the time the CPU spends handling hardware interrupts. You will see some utilization here when a device is particularly busy (optical drives do stress this parameter from time to time), but normally you won’t ever see it above a few percent.
- si: This parameter relates to software interrupts. Typically, these are lower priority interrupts that are created by the kernel. You will probably never see a high utilization in this field.
- st: The st parameter relates to an environment in which virtualization is used. In some virtual environments, a virtual machine can take (“steal,” hence “st”) CPU time from the host operating system. If this occurs, you will see some utilization in the st field. If the utilization here starts getting really high, you should consider off-loading virtual machines from your server.
Memory Monitoring with top
The second set of information to get from top concerns the lines about memory and swap usage. The memory lines contain five parameters (of which the last is in the swap line). These are
- total: This is the total amount of physical memory installed in your server.
- used: The amount of memory that is currently in use by something. This includes memory in buffers and cache.
- free: The amount of memory that is not currently in use. On a typical server that is operational for more than a couple of hours, you will always see that this value is rather low (see, for example, Listing 15-2, in which it has dropped down to next to nothing).
- buffers: This parameter relates to the write cache that your server uses. It also contains file system tables and other unstructured data that the server has to have in memory. All data that a server has to write to disk is written to the write cache first. From there, the disk controller takes care of this data when it has time to write it. The advantage of using write cache is that from the perspective of the end user, the data is written, so the application the user is using does not have to wait anymore. This buffer cache, however, is memory that is used for nonessential purposes, and when an application requires more memory and can’t allocate that from the pool of free memory, the write cache can be written to disk (flushed), so that memory that was used by the write cache is available for other purposes. Essentially, write cache is a good thing that makes your server performing faster.
- cached: When a user requests a file from the server, the file normally has to be read from the hard disk. Because a hard disk is typically about 1,000 times slower than RAM, this process causes major delays. For that reason, every time, after fetching a file from the server hard drive, the file is stored in cache. This is a read cache and has one purpose only: to speed up reads. When memory that is currently allocated to the read cache is needed for other purposes, the read cache can be freed immediately, so that more memory can be added to the pool of available (“free”) memory. Your server will typically see a high amount of cached memory. Especially if your server is used for reads mostly, this is considered good, as it will speed up your server. In case your server is used for reads mostly, and this parameter falls below 30 percent of total available memory, you will most likely get a slowed-down performance. Add more RAM if this happens. Be aware that there are exceptions, though. Servers running large databases typically don’t have a very high read cache, as the data are stored in memory that is claimed by the database, and they are not managed by the Linux kernel.
Understanding swap
When considering memory usage, you should also consider the amount of swap that is being allocated. Swap is RAM that is emulated on disk. That may sound like a bad idea that really slows down server performance, but it doesn’t have to be.
To understand swap usage, you should understand the different kinds of memory that are in use on a Linux server. Linux distinguishes between active and inactive memory, and between file and anon memory. You can get these parameters from the /proc/meminfo file (see Listing 15-3).
Listing 15-3. Getting Detailed Memory Information from /proc/meminfo
[root@lab ~]# cat /proc/meminfo
MemTotal:       16196548 kB
MemFree:         1730808 kB
MemAvailable:    5248720 kB
Buffers:            3956 kB
Cached:          4045672 kB
SwapCached:            0 kB
Active:         10900288 kB
Inactive:        3019436 kB
Active(anon):    9725132 kB
Inactive(anon):   627268 kB
Active(file):    1175156 kB
Inactive(file):  2392168 kB
Unevictable:       25100 kB
Mlocked:           25100 kB
SwapTotal:       4194300 kB
SwapFree:        4194300 kB
Anon (anonymous) memory refers to memory that is allocated by programs. File memory refers to memory that is used as cache or buffers. On any Linux system, these two kinds of memory can be flagged as active or inactive. Inactive file memory typically exists on a server that doesn’t need the RAM for anything else. If memory pressure arises, the kernel can clear this memory immediately to make more RAM available. Inactive anon memory is memory that has to be allocated. However, as it hasn’t been used actively, it can be moved to a slower kind of memory. That exactly is what swap is used for.
If in swap there’s only inactive anon memory, swap helps optimizing the memory performance of a system. By moving out these inactive memory pages, more memory becomes available for caching, which is good for the overall performance of a server. Hence, if a Linux server shows some activity in swap, that is not a bad sign at all.
EXERCISE 15-1. MONITORING BUFFER AND CACHE MEMORY
In this exercise, you’ll monitor how buffer and cache memory are used. To start with a clean image, you’ll first restart your server, so that no old data is in buffers or cache. Next, you’ll run some commands that will cause the buffer and cache memory to be filled. At the end, you’ll clear the total amount of buffer and cache memory by using /proc/sys/vm/drop_caches.
- Reboot your server.
- After rebooting, open two root console windows. In one window, start top, so that you’ll have a real-time overview of what’s happening. Note the current memory allocation. Buffers and cache should be low, and your server should have a relatively large amount of free memory available.
- Run the following script to read data, which will fill your server cache.
cd /etc
for I in *
do
    cat $I
done - You should now see an increase in cache (probably not much, as the contents of the /etc directory typically isn’t that high).
- Run the following command to fill the buffer cache: ls -Rl / > /dev/null &.
- You’ll notice that the buffer cache has filled a bit as well.
- Optionally, you can run some more commands that will fill buffers as well as cache, such as dd if=/dev/sda of=/dev/null & (which has a much greater impact than the previous commands).
- Once finished, type free -m, to observe the current usage of buffers and cache.
- Tell the kernel to drop all buffers and cache that it doesn’t really need at this moment, by using echo 2 > /proc/sys/vm/drop_caches.
Process Monitoring with top
The lower part of top is reserved for information about the most active processes. In this part, you’ll see a few parameters related to these processes. By default, the following parameters are shown:
- PID: The Process ID of the process
- USER: The user who started the process
- PR: The priority of the process. The priority of any process is determined automatically, and the process with the highest priority is eligible to be serviced first from the queue of runnable processes. Some processes run with a real-time priority, which is indicated as RT. Processes with this priority can claim CPU cycles in real time, which means that they will always have highest priority.
- NI: The nice value with which the process was started
- VIRT: The amount of memory that was claimed by the process when it first started
- RES: Stands for resident memory. This relates to the amount of memory that a process is really using. You will see that in some cases, this is considerably lower than the parameter mentioned in the VIRT column. This is because many process like to over-allocate. This means they claim more memory than they really need, just in case they’ll need it at some point.
- SHR: The amount of memory this process uses that is shared with another process
- S: The status of a process
- %CPU: Relates to the percentage of CPU time this process is using. You will normally see the process with the highest CPU utilization mentioned on top of this list.
- %MEM: The percentage of memory that this process has claimed
- TIME+: The total amount of time that this process has been using CPU cycles
- COMMAND: The name of the command that relates to this process
Understanding Linux Memory Allocation
When analyzing Linux memory usage, you should know how Linux uses virtual and resident memory. Virtual memory on Linux is to be taken literally: it is a nonexisting amount of memory that the Linux kernel can be referred to. When looking at the contents of the /proc/meminfo file, you can see that the amount of virtual memory is set to approximately 35TB of RAM:
VmallocTotal:   34359738367 kB
VmallocUsed:         486380 kB
VmallocChunk:   34359160008 kB
Virtual memory is used by the Linux kernel to allow programs to make a memory reservation. After making this reservation, no other application can reserve the same memory. Making the reservation is a matter of setting pointers and nothing else. It doesn’t mean that the memory reservation is also actually going to be used. When a program has to use the memory it has reserved, it is going to issue a malloc system call, which means that the memory is actually going to be allocated. At that moment, we’re talking about resident memory.
That Linux uses virtual memory when reserving memory may cause trouble later on. A program that has reserved memory—even if it is virtual memory—would expect that it can also use that memory. But that is not the case, as virtual memory, in general, is much more than the amount of physical RAM + Swap that is available. This is known as memory over-commit or over-allocation, and in some cases, memory over-allocation can cause trouble. If a process has reserved virtual memory that cannot be mapped to physical memory, you may encounter an OOM (out of memory) situation. If that happens, processes will get killed. In the “Optimizing Performance” section, later in this chapter, you’ll learn about some parameters that tell you how to prevent such situations.
Analyzing CPU Performance
The top utility offers a good starting point for performance tuning. However, if you really need to dig deep into a performance problem, top does not offer sufficient information, and more advanced tools will be required. In this section, you’ll learn what you can do to find out more about CPU performance-related problems.
Most people tend to start analyzing a performance problem at the CPU, since they think CPU performance is the most important on a server. In most situations, this is not true. Assuming that you have a recent CPU, and not an old 486-based CPU, you will not often see a performance problem that really is related to the CPU. In most cases, a problem that appears to be CPU-related is likely caused by something else. For example, your CPU may just be waiting for data to be written to disk. Before getting into details, let’s have a look at a brief exercise that teaches how CPU performance can be monitored.
EXERCISE 15-2. ANALYZING CPU PERFORMANCE
In this exercise, you’ll run two different commands that will both analyze CPU performance. You’ll notice a difference in the behavior of both commands.
- Log in as root and open two terminal windows. In one of these windows, start top.
- In the second window, run the command dd if=/dev/urandom of=/dev/null. You will see the usage percentage in the us column going up, as well as the usage in the sy column. Press 1 if you have a multi-core system. You’ll notice that one CPU core is completely occupied by this task.
- Stop the dd job and write a small script in the home directory of user root that has the following content:
 [root@hnl ~]# cat wait
#!/bin/bash

COUNTER=0

while true
do
        dd if=/dev/urandom of=/root/file.$COUNTER bs=1M count=1
        COUNTER=$(( COUNTER + 1 ))
                [ COUNTER = 1000 ] && exit
done - Run the script. You’ll notice that first, the sy parameter in top goes up, and after a while, the wa parameter goes up as well. This is because the I/O channel gets too busy, and the CPU has to wait for data to be committed to I/O. Based on the hardware you’re using, you might not see immediate results. If that is the case, start the script a second time.
- Make sure that both the script and the dd command have stopped, and close the root shells.
Understanding CPU Performance
To monitor what is happening on your CPU, you should know how the Linux kernel works with the CPU. A key component is the run queue. Before being served by the CPU, every process enters the run queue. There’s a run queue for every CPU core in the system. Once a process is in the run queue, it can be runnable or blocked. A runnable process is a process that is competing for CPU time; a blocked process is just waiting.
The Linux scheduler decides which runnable process to run next, based on the current priority of the process. A blocked process doesn’t compete for CPU time. The load average line in top gives a summary of the workload that results from all runnable and blocked processes combined. If you want to know how many of the processes are currently in either runnable or blocked state, use vmstat. The columns r and b show the amount of runnable and blocked processes. In Listing 15-4, you can see what this looks like on a system in which vmstat has polled the system five times, with a two-second interval.
Listing 15-4. Use vmstat to See How Many Processes Are in Runnable or Blocked State
[root@lab ~]# vmstat 2 5
procs  -----------memory----------- --swap-- ----io---- --system-- ------cpu-----
 r  b  swpd   free    buff cache     si   so  bi    bo   in   cs   us sy id wa st
 0  0     0 1412260   3956 3571532   0    0   39    62   0    71   3  1  97 0   0
 0  0     0 1412252   3956 3571564   0    0   0     0    1217 3478 2  1  97 0   0
 0  0     0 1412376   3956 3571564   0    0   0     0    1183 3448 2  1  97 0   0
 0  0     0 1412220   3956 3571564   0    0   0     0    1189 3388 2  1  97 0   0
 0  0     0 1412252   3956 3571564   0    0   0     0    1217 3425 2  1  97 0   0
Context Switches and Interrupts
A modern Linux system is always a multitasking system. This is true for every processor architecture that can be used, because the Linux kernel constantly switches between different process. In order to perform this switch, the CPU needs to save all the context information for the old process and retrieve the context information for the new process. The performance price of these context switches, therefore, is heavy.
In an ideal world, you have to make sure that the number of context switches is limited as much as possible. You may do this by using a multi-core CPU architecture or a server with multiple CPUs, or a combination of both, but if you do, you have to make sure that processes are locked to a dedicated CPU core, to prevent context switches.
Processes that are serviced by the kernel scheduler, however, are not the only cause of context switching. Another important reason for a context switch to occur is hardware interrupts. This is a piece of hardware demanding processor time. To see what it has been doing, you can look at the contents of the /proc/interrupts file (see Listing 15-5).
Listing 15-5. The /proc/interrupts File Shows You Exactly How Many of Each Interrupt Has Been Handled
[root@lab proc]# cat interrupts
          CPU0       CPU1       CPU2       CPU3
 0:         54          0          0          0  IR-IO-APIC-edge      timer
 8:          0          0          0          1  IR-IO-APIC-edge      rtc0
 9:          0          0          0          0  IR-IO-APIC-fasteoi   acpi
23:          0          0         36          1  IR-IO-APIC-fasteoi   ehci_hcd:usb1
56:          0          0          0          0  DMAR_MSI-edge        dmar0
57:          0          0          0          0  DMAR_MSI-edge        dmar1
58:      68468     113385      59982      38591  IR-PCI-MSI-edge      xhci_hcd
59:         17    9185792         29          6  IR-PCI-MSI-edge      eno1
60:     660908     640712     274180     280446  IR-PCI-MSI-edge      ahci
61:     379094     149796     827403     152584  IR-PCI-MSI-edge      i915
 62:         13          0          0          0   IR-PCI-MSI-edge      mei_me
 63:        263          1          6          1   IR-PCI-MSI-edge      snd_hda_intel
 64:       1770        506        106        516   IR-PCI-MSI-edge      snd_hda_intel
NMI:        967        983        762        745   Non-maskable interrupts
LOC:   32241233   32493830   20152850   20140483   Local timer interrupts
SPU:          0          0          0          0   Spurious interrupts
PMI:        967        983        762        745   Performance monitoring interrupts
IWI:     122505     122449     110316     112272   IRQ work interrupts
RTR:          0          0          0          0   APIC ICR read retries
RES:    2486212    2351025    1841935    1821599   Rescheduling interrupts
CAL:     483791     496810     318516     290537   Function call interrupts
TLB:     231573     234010     173163     171368   TLB shootdowns
TRM:          0          0          0          0   Thermal event interrupts
THR:          0          0          0          0   Threshold APIC interrupts
MCE:          0          0          0          0   Machine check exceptions
MCP:        512        512        512        512   Machine check polls
As mentioned, in a multi-core environment, context switches can cause a performance overhead. You can see if these occur often by using the top utility. It can provide information about the CPU that was last used by any process, but you have to switch this on. To do that, from the top utility, first press the f command and type j. (on some distributions, you’ll have to scroll instead, to select the appropriate option). This will switch the option last used CPU (SMP) on for an SMP environment. In Listing 15-6, you can see the interface from which you can do this. Note that to make this setting permanent, you can use the W command from top. This causes all modifications to the top program to be written to the ~/.toprc file, so that they can be loaded again at restart of top.
Listing 15-6. After Pressing the F Key, You Can Switch Different Options On or Off in top
Fields Management for window 1:Def, whose current sort field is %CPU
   Navigate with Up/Dn, Right selects for move then <Enter> or Left commits,
   'd' or <Space> toggles display, 's' sets sort. Use 'q' or <Esc> to end!

* PID     = Process Id             TIME    = CPU Time
* USER    = Effective User Name    SWAP    = Swapped Size (KiB)
* PR      = Priority               CODE    = Code Size (KiB)
* NI      = Nice Value             DATA    = Data+Stack (KiB)
* VIRT    = Virtual Image (KiB)    nMaj    = Major Page Faults
* RES     = Resident Size (KiB)    nMin    = Minor Page Faults
* SHR     = Shared Memory (KiB)    nDRT    = Dirty Pages Count
* S       = Process Status         WCHAN   = Sleeping in Function
* %CPU    = CPU Usage              Flags   = Task Flags <sched.h>
* %MEM    = Memory Usage (RES)     CGROUPS = Control Groups
* TIME+   = CPU Time, hundredths   SUPGIDS = Supp Groups IDs
* COMMAND = Command Name/Line      SUPGRPS = Supp Groups Names
  PPID    = Parent Process pid     TGID    = Thread Group Id
  UID     = Effective User Id      ENVIRON = Environment vars
  RUID    = Real User Id           vMj     = Major Faults delta
  RUSER   = Real User Name         vMn     = Minor Faults delta
  SUID    = Saved User Id          USED    = Res+Swap Size (KiB)
  SUSER   = Saved User Name        nsIPC   = IPC namespace Inode
  GID     = Group Id               nsMNT   = MNT namespace Inode
  GROUP   = Group Name             nsNET   = NET namespace Inode
  PGRP    = Process Group Id       nsPID   = PID namespace Inode
  TTY     = Controlling Tty        nsUSER  = USER namespace Inode
  TPGID   = Tty Process Grp Id     nsUTS   = UTS namespace Inode
  SID     = Session Id
  nTH     = Number of Threads
  P       = Last Used Cpu (SMP)
After switching the last used CPU option on, you will see the column P in top that displays the number of the CPU that was last used by a process.
Using vmstat
To monitor CPU utilization, top offers a very good starting point. If that doesn’t offer you enough, you may prefer the vmstat utility. With vmstat, you can get a nice, detailed view of what is happening on your server. Of special interest is the CPU section, which contains the five most important parameters on CPU usage:
- cs: The amount of context switches
- us: The percentage of time the CPU has spent in user space
- sy: The percentage of time the CPU has spent in system space
- id: The percentage of CPU utilization in the idle loop
- wa: The percentage of utilization the CPU was waiting for I/O
When working with vmstat, you should know that there are two ways to use it. Probably the most useful way to run it is in the so-called sample mode. In this mode, a sample is taken every n seconds. Specify the amount of seconds for the sample as an option when starting vmstat. Running performance monitoring utilities in this way is always good, because it will show your progress over a given amount of time. You may find it useful, as well, to run vmstat for a given amount of time only.
Another useful way to run vmstat is with the option -s. In this mode, vmstat shows you the statistics since the system has booted. As you can see in Listing 15-7, apart from the CPU-related options, vmstat shows information about processors, memory, swap, io, and system as well. These options are covered later in this chapter.
Listing 15-7. Using vmstat -s
[root@lab ~]# vmstat -s
     16196548 K total memory
     14783440 K used memory
     11201308 K active memory
      3031324 K inactive memory
      1413108 K free memory
         3956 K buffer memory
      3571580 K swap cache
      4194300 K total swap
            0 K used swap
      4194300 K free swap
      1562406 non-nice user cpu ticks
         1411 nice user cpu ticks
       294539 system cpu ticks
     57856573 idle cpu ticks
        22608 IO-wait cpu ticks
           12 IRQ cpu ticks
         5622 softirq cpu ticks
            0 stolen cpu ticks
     23019937 pages paged in
     37008693 pages paged out
          842 pages swapped in
         3393 pages swapped out
    129706133 interrupts
    344528651 CPU context switches
   1408204254 boot time
       132661 forks
Analyzing Memory Usage
Memory is probably the most important component of your server, from a performance perspective. The CPU can only work smoothly if processes are ready in memory and can be offered from there. If this is not the case, the server has to get its data from the I/O channel, which is about 1,000 times slower to access than memory. From the processor’s point of view, even system RAM is relatively slow. Therefore, modern server processors have large amounts of cache, which is even faster than memory.
You have read how to interpret basic memory statistics, as provided by top earlier in this chapter; therefore, I will not cover them again. In this section, you can read about some more advanced memory-related information.
Page Size
A basic concept in memory handling is the memory page size. On an x86_64 system, typically 4KB pages are used. This means that everything that happens, happens in chunks of 4KB. Nothing wrong with that, if you have a server handling large amounts of small files. If, however, your server handles huge files, it is highly inefficient if only these small 4KB pages are used. For that purpose, your server can use huge pages with a default size of 2MB per page. Later in this chapter, you’ll learn how to configure huge pages.
A server can run out of memory. In that event, it uses swapping. Swap memory is emulated RAM on the server’s hard drive. Because in swap the hard disk is involved, you should avoid it, if possible. Access times to a hard drive are about 1,000 times slower than access times to RAM. To monitor current swap use, you can use free -m, which will show you the amount of swap that is currently being used. See Listing 15-8 for an example.
Listing 15-8. free -m Provides Information About Swap Usage
[root@lab ~]# free  -m
                     total       used       free     shared    buffers     cached
Mem:                 15816      14438       1378        475          3       3487
-/+buffers/cache:               10946       4870
Swap:                4095           0       4095
As you can see in the preceding listing, on the server where this sample comes from, nothing is wrong; there is no swap usage at all, and that is good.
If, on the other hand, you see that your server is swapping, the next thing you must know is how actively it is swapping. To provide information about this, the vmstat utility provides useful information. This utility provides swap information in the si (swap in) and so (swap out) columns.
If swap space is used, you should also have a look at the /proc/meminfo file, to relate the use of swap to the amount of inactive anon memory pages. If the amount of swap that is used is larger than the amount of anon memory pages that you observe in /proc/meminfo, it means that active memory is being swapped. That is bad news for performance, and if that happens, you must install more RAM. If the amount of swap that is in use is smaller than the amount of inactive anon memory pages in /proc/meminfo, there’s no problem, and you’re good. If, however, you have more memory in swap than the amount of inactive anonymous pages, you’re probably in trouble, because active memory is being swapped. That means that there’s too much I/O traffic, which will slow down your system.
Kernel Memory
When analyzing memory usage, you should also take into account the memory that is used by the kernel itself. This is called slab memory. You can see in the /proc/meminfo file the amount of slab currently in use. Normally, the amount of kernel memory that is in use is relatively small. To get more information about it, you can use the slabtop utility.
This utility provides information about the different parts (referred to as objects) of the kernel and what exactly they are doing. For normal performance analysis purposes, the SIZE and NAME columns are the most interesting ones. The other columns are of interest mainly to programmers and kernel developers and, therefore, are not described in this chapter. In Listing 15-9, you can see an example of information provided by slabtop.
Listing 15-9. The slabtop Utility Provides Information About Kernel Memory Usage
Active / Total Objects (% used)    : 1859018 / 2294038 (81.0%)
Active / Total Slabs (% used)      : 56547 / 56547 (100.0%)
Active / Total Caches (% used)     : 75 / 109 (68.8%)
Active / Total Size (% used)       : 275964.30K / 327113.79K (84.4%)
Minimum / Average / Maximum Object : 0.01K / 0.14K / 15.69K

OBJS    ACTIVE  USE     OBJ    SIZE     SLABS          OBJ/SLAB CACHE SIZE NAME
1202526 786196  65%    0.10K  30834       39           123336K buffer_head
166912  166697  99%    0.03K   1304      128           5216K kmalloc-32
134232  134106  99%    0.19K   6392       21           25568K dentry
122196  121732  99%    0.08K   2396       51           9584K selinux_inode_security
115940  115940 100%    0.02K    682      170           2728K fsnotify_event_holder
 99456   98536  99%    0.06K   1554       64           6216K kmalloc-64
 79360   79360 100%    0.01K    155      512           620K kmalloc-8
 70296   70296 100%    0.64K   2929       24           46864K proc_inode_cache
 64512   63218  97%    0.02K    252      256           1008K kmalloc-16
 38248   26376  68%    0.57K   1366       28           21856K radix_tree_node
 29232   29232 100%    1.00K   1827       16           29232K xfs_inode
 28332   28332 100%    0.11K    787       36           3148K sysfs_dir_cache
 28242   27919  98%    0.21K   1569       18           6276K vm_area_struct
 18117   17926  98%    0.58K    671       27           10736K inode_cache
 14992   14150  94%    0.25K    937       16           3748K kmalloc-256
 10752   10752 100%    0.06K    168       64           672K anon_vma
  9376    8206  87%    0.12K    293       32           1172K kmalloc-128
  8058    8058 100%    0.04K     79      102           316K Acpi-Namespace
  7308    7027  96%    0.09K    174       42           696K kmalloc-96
  4788    4788 100%    0.38K    228       21           1824K blkdev_requests
  4704    4704 100%    0.07K     84       56           336K Acpi-ParseExt
The most interesting information a system administrator would receive from slabtop is the amount of memory a particular slab (part of the kernel) is using. If, for instance, you’ve recently performed some tasks on the file system, you may find that the inode_cache is relatively high. If that is just for a short period of time, it’s no problem. The Linux kernel wakes up routines when they are needed, while they can be closed fast when they’re no longer needed. If, however, you see that one part of the routine that is started continuously uses high amounts of memory, that might be an indication that you have some optimization to do.
EXERCISE 15-3. ANALYZING KERNEL MEMORY
In this exercise, you’ll cause a little bit of stress on your server, and you’re going to use slabtop to find out which parts of the kernel are getting busy. As the Linux kernel is sophisticated and uses its resources as efficiently as possible, you won’t see huge changes, but some subtle changes can be detected anyway.
- Open two terminal windows in which you are root.
- On one terminal window, type slabtop and have a look at what the different slabs are currently doing.
- In the other terminal window, use ls -lR /. You should see the dentry cache increasing. This is the part of memory where the kernel caches directory entries.
- Once the ls -lR command has finished, type dd if=/dev/sda of=/dev/null, to create some read activity. You’ll see the buffer_head parameter increasing. These are the file system buffers that are used to cache information the dd command uses.
Using ps for Analyzing Memory
When tuning memory utilization, there is one more utility that you should never forget, and that is ps. The advantage of ps, is that it gives memory usage information on all processes on your server and it is easy to grep on its result to find information about particular processes. To monitor memory usage, the ps aux command is very useful. It provides memory information in the VSZ and the RSS columns. The VSZ (Virtual Size) parameter provides information about the virtual memory that is used. This relates to the total amount of memory that is claimed by a process. The RSS (Resident Size) parameter refers to the amount of memory that is really in use. Listing 15-10 gives an example of some lines of ps aux output.
Listing 15-10. ps aux Gives Memory Usage Information for Particular Processes
USER       PID %CPU %MEM    VSZ   RSS TTY      STAT START   TIME COMMAND
root         1  0.0  0.0  53500  7664 ?         Ss   Aug16   0:07 /usr/lib/systemd/systemd--switched-root --system --deserialize 23
root         2  0.0  0.0      0     0 ?     Z    S    Aug16   0:00 [kthreadd]
...
qemu     31274  2.0  2.5 1286920 407748 ?       Sl    11:16   4:56 /usr/libexec/qemu-kvm -name vm
root     31276  0.0  0.0       0      0 ?        S    11:16   0:00 [vhost-31274]
root     31280  0.0  0.0       0      0 ?        S    11:16   0:00 [kvm-pit/31274]
qemu     31301  2.0  2.5 1287656 412868 ?       Sl    11:16   4:58 /usr/libexec/qemu-kvm -name vm
root     31303  0.0  0.0       0      0 ?        S    11:16   0:00 [vhost-31301]
root     31307  0.0  0.0       0      0 ?        S    11:16   0:00 [kvm-pit/31301]
root     31314  0.0  0.0       0      0 ?        S    11:16   0:00 [kworker/u8:2]
qemu     31322  2.1  2.5 1284036 413216 ?       Sl    11:16   5:01 /usr/libexec/qemu-kvm -name vm
root     31324  0.0  0.0       0      0 ?        S    11:16   0:00 [vhost-31322]
root     31328  0.0  0.0       0      0 ?        S    11:16   0:00 [kvm-pit/31322]
qemu     31347  2.1  2.5 1284528 408636 ?       Sl    11:16   5:01 /usr/libexec/qemu-kvm -name vm
root     31350  0.0  0.0       0      0 ?        S    11:16   0:00 [vhost-31347]
root     31354  0.0  0.0       0      0 ?        S    11:16   0:00 [kvm-pit/31347]
When looking at the output of ps aux, you may notice that there are two different kinds of processes. The name of some are between square brackets; the names of others are not. If the name of a process is between square brackets, the process is part of the kernel. All other processes are “normal” processes.
If you need more information about a process and what exactly it is doing, there are two ways to get that information. First, you can check the /proc directory for the particular process, for example, /proc/5658 gives information for the process with PID 5658. In this directory, you’ll find the maps file that gives some more insight into how memory is mapped for this process. As you can see in Listing 15-11, this information is rather detailed. It includes the exact memory addresses this process is using and even tells you about subroutines and libraries that are related to this process.
Listing 15-11. The /proc/PID/maps File Gives Detailed Information on Memory Utilization of Particular Processes
00400000-004dd000 r-xp 00000000 fd:01 134326347                          /usr/bin/bash
006dc000-006dd000 r--p 000dc000 fd:01 134326347                          /usr/bin/bash
006dd000-006e6000 rw-p 000dd000 fd:01 134326347                          /usr/bin/bash
006e6000-006ec000 rw-p 00000000 00:00 0
014d0000-015d6000 rw-p 00000000 00:00 0                                  [heap]
7fcae4779000-7fcaeaca0000 r--p 00000000 fd:01 201334187                  /usr/lib/locale/locale-archive
7fcaeaca0000-7fcaeacab000 r-xp 00000000 fd:01 201334158                  /usr/lib64/libnss_files-2.17.so
7fcaeacab000-7fcaeaeaa000 ---p 0000b000 fd:01 201334158                  /usr/lib64/libnss_files-2.17.so
7fcaeaeaa000-7fcaeaeab000 r--p 0000a000 fd:01 201334158                  /usr/lib64/libnss_files-2.17.so
7fcaeaeab000-7fcaeaeac000 rw-p 0000b000 fd:01 201334158                  /usr/lib64/libnss_files-2.17.so
7fcaeaeac000-7fcaeb062000 r-xp 00000000 fd:01 201334140                  /usr/lib64/libc-2.17.so
7fcaeb062000-7fcaeb262000 ---p 001b6000 fd:01 201334140                  /usr/lib64/libc-2.17.so
7fcaeb262000-7fcaeb266000 r--p 001b6000 fd:01 201334140                  /usr/lib64/libc-2.17.so
7fcaeb266000-7fcaeb268000 rw-p 001ba000 fd:01 201334140                  /usr/lib64/libc-2.17.so
7fcaeb268000-7fcaeb26d000 rw-p 00000000 00:00 0
The pmap command also shows what a process is doing. It gets its information from the /proc/PID/maps file. One of the advantages of the pmap command is that it gives detailed information about the order in which a process does its work. You can see calls to external libraries, as well as additional memory allocation (malloc) requests that the program is doing, as reflected in the lines that have [anon] at the end.
Monitoring Storage Performance
One of the hardest things to do properly is the monitoring of storage utilization. The reason is that the storage channel typically is at the end of the chain. Other elements in your server can have a positive as well as a negative influence on storage performance. For example, if your server is low on memory, that will be reflected in storage performance, because if you don’t have enough memory, there can’t be a lot of cache and buffers, and thus, your server has more work to do on the storage channel.
Likewise, a slow CPU can have a negative impact on storage performance, because the queue of runnable processes can’t be cleared fast enough. Therefore, before jumping to the conclusion that you have bad performance on the storage channel, you should really try to take other factors into consideration as well.
It is generally hard to optimize storage performance on a server. The best behavior really depends on the kind of workload your server typically has. For instance, a server that has a lot of reads has other needs than a server that does mainly write. A server that is doing writes most of the time can benefit from a storage channel with many disks, because more controllers can work on clearing the write buffer cache from memory. If, however, your server is mainly reading data, the effect of having many disks is just the opposite. Because of the large amount of disks, seek times will increase, and therefore, performance will be negatively affected.
Following are some indicators of storage performance problems. Have a look and see if one of these is the case with your server, and if it is, go and analyze what is happening.
- Memory buffers and cache is heavily used while CPU utilization is low.
- There is high disk or controller utilization.
- Long network response times are occurring while network utilization is low.
- The wa parameter in top shows very high.
Understanding Disk Working
Before trying to understand storage performance, there is another factor that you should consider, and that is the way that storage activity typically takes place. First, a storage device, in general, handles large sequential transfers better than small random transfers. This is because, in memory, you can configure read ahead and write ahead, which means that the storage controller already goes to the next block it probably has to go to. If your server handles small files mostly, read ahead buffers will have no effect at all. On the contrary, they will only slow it down.
In addition, you should be aware that in modern environments, three different types of storage devices are used. If storage is handled by a Storage Area Network (SAN), it’s often not possible to do much about storage optimization. If local storage is used, it makes a big difference if that is SSD-based storage or storage that uses rotating platters.
From the tools perspective, there are three tools that really count when doing disk performance analysis. The first tool to start your disk performance analysis is vmstat. This tool has a couple of options that help you see what is happening on a particular disk device, such as -d, which gives you statistics for individual disks, or -p, which gives partition performance statistics. As you have already seen, you can use vmstat with an interval parameter and a count parameter as well. In Listing 15-12, you can see the result of the command vmstat -d, which gives detailed information on storage utilization for all disk devices on your server.
Listing 15-12. To Understand Storage Usage, Start with vmstat
[root@lab ~]# vmstat -d
disk- ------------reads------------ ------------writes----------- -----IO------
       total merged  sectors      ms     total  merged   sectors      ms    cur    sec
sda   932899 1821123 46129712   596065  938744  2512536 74210979 3953625      0    731
dm-0    1882      0   15056        537    3397        0    27160   86223      0      0
dm-1   17287      0 1226434      17917   62316        0 17270450 2186073      0     93
sdb      216    116    1686        182       0        0        0       0      0      0
dm-2   51387      0 2378598      16168   58063        0  3224216  130009      0     35
dm-3   51441      0 2402329      25443   55309        0  3250147  140122      0     40
In the output of this command, you can see detailed statistics about the reads and writes that have occurred on a disk. The following parameters are displayed when using vmstat -d:
- reads: total: The total number of reads that was requested
- reads: merged: The total number of adjacent locations that have been merged to improve performance. This is the result of the read ahead parameter. High numbers are good. A high number here means that within the same read request, a couple of adjacent blocks have been read as well.
- reads: sectors: The total number of disk sectors that has been read
- reads: ms: Total time spent reading from disk
- writes: total: The total number of writes
- writes: merged: The total number of writes to adjacent sectors
- writes: sectors: The total number of sectors that has been written
- writes: ms: The total time in milliseconds your system has spent writing data
- IO: cur: The total number of I/O requests currently in progress
- IO: sec: The total amount of time spent waiting for I/O to complete
Another way of monitoring disk performance with vmstat is by running it in sample mode. For example, the command vmstat 2 10 will run ten samples with a two-second interval. Listing 15-13 shows the result of this command.
Listing 15-13. In Sample Mode, You Can Get a Real-Time Impression of Disk Utilization
[root@lab ~]# vmstat 2 10
procs -----------memory---------- ---swap-- -----io---- -system-- ------cpu-----
 r  b   swpd   free   buff  cache    si   so    bi    bo   in   cs us sy id wa st
 0  0      0 1319012  3956 3574176    0    0    36    58   26    8  3  1 97  0  0
 0  0      0 1318532  3956 3574176    0    0     0     2 1212 3476  2  1 97  0  0
 0  0      0 1318540  3956 3574176    0    0     0     0 1189 3469  2  1 97  0  0
 0  0      0 1318788  3956 3574176    0    0     0     0 1250 3826  3  1 97  0  0
 0  0      0 1317852  3956 3574176    0    0     0     0 1245 3816  3  1 97  0  0
 0  0      0 1318044  3956 3574176    0    0     0     0 1208 3675  2  0 97  0  0
 1  0      0 1318044  3956 3574176    0    0     0     0 1193 3384  2  1 97  0  0
 0  0      0 1318044  3956 3574176    0    0     0     0 1212 3419  2  0 97  0  0
 0  0      0 1318044  3956 3574176    0    0     0     0 1229 3506  2  1 97  0  0
 3  0      0 1318028  3956 3574176    0    0     0     0 1227 3738  2  1 97  0  0
The columns that count in the preceding sample listing are the io: bi and io: bo columns, because they show the number of blocks that came in from the storage channel (bi) and the number of blocks that were written to the storage channel (bo).
Another tool to monitor performance on the storage channel, is iostat. It is not installed by default. Use zypper in sysstat, if you don’t have it. It provides an overview per device of the amount of reads and writes. In the example in Listing 15-14, you can see the following device parameters being displayed:
- tps: The number of transactions (read plus writes) that was handled per second
- Blk_read/s: The number of blocks that was read per second
- Blk_wrtn/s: The rate of disk blocks written per second
- Blk_read: The total number of blocks that was read since startup
- Blk_wrtn: The total number of blocks that was written since startup
Listing 15-14. The iostat Utility Provides Information About the Number of Blocks That Was Read and Written per Second
[root@hnl ~]# iostat
Linux 3.10.0-123.el7.x86_64 (lab.sandervanvugt.nl) 08/18/2014 _x86_64_ (4 CPU)

avg-cpu:  %user   %nice %system %iowait  %steal   %idle
           2.63    0.00    0.53    0.04    0.00   96.80

Device:            tps    kB_read/s    kB_wrtn/s    kB_read    kB_wrtn
sda              11.28       138.98       223.59   23064928   37106736
dm-0              0.03         0.05         0.08       7528      13580
dm-1              0.48         3.70        52.04     613289    8636472
sdb               0.00         0.01         0.00        843          0
dm-2              0.66         7.17         9.71    1189299    1612108
dm-3              0.64         7.24         9.79    1201164    1625073
dm-4              0.65         7.24         9.62    1201986    1596805
dm-5              0.65         7.38         9.62    1225284    1596418
dm-6              0.65         7.38         9.57    1224767    1588105
dm-7              0.65         7.31         9.53    1213582    1582201
If, when used in this way, iostat doesn’t give you enough detail, you can use the -x option as well. This option gives much more information and, therefore, doesn’t fit on the screen nicely, in most cases. In Listing 15-15, you can see an example.
Listing 15-15. iostat -x Gives You Much More Information About What Is Happening on the Storage Channel
[root@hnl ~]# iostat -x
Linux 3.10.0-123.el7.x86_64 (lab.sandervanvugt.nl) 08/18/2014 _x86_64_ (4 CPU)

avg-cpu:  %user   %nice %system %iowait  %steal   %idle
           2.63    0.00    0.53    0.04    0.00   96.80

Device:   rrqm/s   wrqm/s    r/s    w/s    rkB/s    wkB/s avgrq-sz avgqu-sz  await r_await w_await  svctm  %util
sda        10.97    15.13   5.62   5.66   138.94   223.52    64.29     0.03   2.43    0.64    4.21   0.39   0.44
dm-0        0.00     0.00   0.01   0.02     0.05     0.08     8.00     0.00  16.43    0.29   25.38   0.15   0.00
dm-1        0.00     0.00   0.10   0.38     3.69    52.02   231.77     0.01  27.61    1.04   34.96   1.18   0.06
sdb         0.00     0.00   0.00   0.00     0.01     0.00     7.81     0.00   0.84    0.84    0.00   0.82   0.00
When using the -x option, iostat gives you the following information:
- rrqm/s: Reads per second merged before issued to disk. Compare this to the information in the r/s column, to find out how much gain of efficiency you have because of read ahead.
- wrqm/s: Writes per second merged before issued to disk. Compare this to the w/s parameter, to see how much performance gain you have because of write ahead.
- r/s: The number of real reads per second
- w/s: The number of real reads per second
- rsec/s: The number of 512-byte sectors that was read per second
- wsec: The number of 51-byte sectors that was written per second
- avgrq-sz: The average size of disk requests in sectors. This parameter provides important information, as it shows you the size of the average files that were requested from disk. Based on the information that you receive from this parameter, you can optimize your file system.
- avgqu-sz: The average size of the disk request queue. This should be low at all times, because it gives the amount of pending disk requests. A high number here means that the performance of your storage channel cannot cope with the performance of your network.
- await: The average waiting time in milliseconds. This is the time the request has been waiting in the I/Oqueue plus the time that it actually took to service this request. This parameter should also be low in all cases.
- svctm: The average service time in milliseconds. This is the time it took before a request could be submitted to disk. If this parameter is below a couple of milliseconds (never more than ten), nothing is wrong with your server. If, however, this parameter is higher than ten, something is wrong, and you should consider doing some storage optimization.
- %util: The percentage of CPU utilization that was related to I/O
Finding Most Busy Processes with iotop
The most useful tool to analyze performance on a server is iotop. This tool also is not installed by default. Use zypper install iostat to install it. Running iotop is as easy as running top. Just start the utility, and you will see which process is causing you an I/O headache. The busiest process is listed on top, and you can also see details about the reads and writes that this process performs (see Listing 15-16).
Within iotop, you’ll see two different kinds of processes. There are processes whose name is written between square brackets. These are kernel processes that aren’t loaded as a separate binary but are a part of the kernel itself. All other processes listed are normal binaries.
Listing 15-16. Analyzing I/O Performance with iotop
[root@hnl ~]# iotop
Total DISK READ :        0.00 B/s | Total DISK WRITE :       0.00 B/s
Actual DISK READ:        0.00 B/s | Actual DISK WRITE:       0.00 B/s
  TID  PRIO  USER     DISK READ  DISK WRITE  SWAPIN     IO>    COMMAND
24960 be/4 root        0.00 B/s    0.00 B/s  0.00 %  0.01 % [kworker/1:2]
    1 be/4 root        0.00 B/s    0.00 B/s  0.00 %  0.00 % systemd --switche~ --deserialize 23
    2 be/4 root        0.00 B/s    0.00 B/s  0.00 %  0.00 % [kthreadd]
    3 be/4 root        0.00 B/s    0.00 B/s  0.00 %  0.00 % [ksoftirqd/0]
16388 be/4 qemu        0.00 B/s    0.00 B/s  0.00 %  0.00 % qemu-kvm -name vm~us=pci.0,addr=0x7
    5 be/0 root        0.00 B/s    0.00 B/s  0.00 %  0.00 % [kworker/0:0H]
16390 be/4 root        0.00 B/s    0.00 B/s  0.00 %  0.00 % [vhost-16388]
    7 rt/4 root        0.00 B/s    0.00 B/s  0.00 %  0.00 % [migration/0]
    8 be/4 root        0.00 B/s    0.00 B/s  0.00 %  0.00 % [rcu_bh]
    9 be/4 root        0.00 B/s    0.00 B/s  0.00 %  0.00 % [rcuob/0]
   10 be/4 root        0.00 B/s    0.00 B/s  0.00 %  0.00 % [rcuob/1]
   11 be/4 root        0.00 B/s    0.00 B/s  0.00 %  0.00 % [rcuob/2]
   12 be/4 root        0.00 B/s    0.00 B/s  0.00 %  0.00 % [rcuob/3]
Normally, you would start analyzing I/O performance because of an abnormality in the regular I/O load. For example, you may find a high wa indicator in top. In Exercise 15-4, you’ll explore an I/O problem using this approach.
EXERCISE 15-4. EXPLORING I/O PERFORMANCE
In this exercise, you’ll start a couple of I/O-intensive tasks. You’ll first see abnormal behavior occurring in top, after which you’ll use iotop to explore what is going on.
- Open two root shells. In one shell, run top. In the second shell, start the command dd if=/dev/sda of=/dev/null. Run this command four times.
- Observe what happens in top. You will notice that the wa parameter goes up. Press 1. If you’re using a multi-core system, you should also see that the workload is evenly load-balanced between cores.
- Start iotop. You will see that the four dd processes are listed on top, but you’ll notice no other kernel processes that are significantly high in the list.
- Use find / -exec xxd {} ; to create some read activity. In iotop, you should see the process itself listed above, but no further significant workload.
- Create a script with the following content:
#!/bin/bash

while true
do
        cp -R / blah.tmp
        rm -f /blah.tmp
        sync
done - Run the script and observe the list of processes in iotop. You should occasionally see the flush process doing a lot of work. This is to synchronize the newly written files back from the buffer cache to disk.
Understanding Network Performance
On a typical server, network performance is as important as disk, memory, and CPU performance. After all, the data has to be delivered over the network to the end user. The problem, however, is that things aren’t always as they seem. In some cases, a network problem can be caused by misconfiguration in server RAM. If, for example, packets get dropped on the network, the reason may very well be that your server just doesn’t have enough buffers reserved for receiving packets, which may be because your server is low on memory. Again, everything is related, and it’s your task to find the real cause of the troubles.
When considering network performance, you should always ask yourself what exactly you want to know. As you are aware, several layers of communication are used on the network. If you want to analyze a problem with your Samba server, that requires a completely different approach from analyzing a problem with dropped packets. A good network performance analysis always bottom-up. That means that you first have to check what is happening at the physical layer of the OSI model and then go up through the Ethernet, IP, TCP/UDP, and protocol layers.
When analyzing network performance, you should always start by checking the status of the network interface itself. Don’t use ifconfig; it really is a deprecated utility. Use ip -s link instead (see Listing 15-17).
Listing 15-17. Use ip -s link to See What Is Happening on Your Network Board
[root@vm8 ~]# ip -s link
1: lo: <LOOPBACK,UP,LOWER_UP> mtu 65536 qdisc noqueue state UNKNOWN mode DEFAULT
    link/loopback 00:00:00:00:00:00 brd 00:00:00:00:00:00
    RX: bytes  packets  errors  dropped overrun mcast
    0          0        0       0       0       0
    TX: bytes  packets  errors  dropped carrier collsns
    0          0        0       0       0       0
2: eth0: <BROADCAST,MULTICAST,UP,LOWER_UP> mtu 1500 qdisc pfifo_fast state UP mode DEFAULT qlen 1000
    link/ether 52:54:00:30:3f:94 brd ff:ff:ff:ff:ff:ff
    RX: bytes  packets  errors  dropped overrun mcast
    2824323    53309    0       0       0       0
    TX: bytes  packets  errors  dropped carrier collsns
    8706       60       0       0       0       0
The most important information that is given by ip -s link is that about the number of packets that has been transmitted and received.
It’s not especially the number of packets that is of interest here but, mainly, the number of erroneous packets. In fact, all of these parameters should be 0 at all times. If you see anything else, you should check what is going on. The following error indicators are displayed:
- Errors: The amount of packets that had an error. Typically, this is due to bad cabling or a duplex mismatch. In modern networks, duplex settings are detected automatically, and most of the time, that goes quite well. So, if you see an increasing number here, it might be a good idea to replace the patch cable to your server.
- Dropped: A packet gets dropped if on the server there has been no memory available to receive the packet. Dropped packets will also occur on a server that runs out of memory, so make sure that you have enough physical memory installed in your server.
- Overruns: An overrun will occur if your NIC gets overwhelmed with packets. If you are using up-to-date hardware, overruns may indicate that someone is doing a denial of service attack on your server.
- Carrier: The carrier is the electrical wave that is used for modulation of the signal. It really is the component that carries the data over your network. The error counter should be 0 at all times, and if it isn’t, you probably have a physical problem with the network board, so it’s time to replace the network board itself.
- Collisions: You may see this error in Ethernet networks where a hub is used instead of a switch. Modern switches make packet collisions impossible, so you will probably never see this error anymore.
If you see a problem when using ip -s link, the next step should be to check your network board settings. Use ethtool to find out the settings you’re currently using and make sure they match the settings of other network components, such as switches. (Note that this command does not work on many KVM virtual machines.) Listing 15-18 shows what you can expect.
Listing 15-18. Use ethtool to Check Settings of Your Network Board
[root@lab ~]# ethtool eno1
Settings for eno1:
        Supported ports: [ TP ]
        Supported link modes:   10baseT/Half 10baseT/Full
                                100baseT/Half 100baseT/Full
                                1000baseT/Full
        Supported pause frame use:   No
        Supports auto-negotiation:   Yes
        Advertised link modes:  10baseT/Half 10baseT/Full
                                100baseT/Half 100baseT/Full
                                1000baseT/Full
        Advertised pause frame use:  No
        Advertised auto-negotiation: Yes
        Speed: 1000Mb/s
        Duplex: Full
        Port: Twisted Pair
        PHYAD: 2
        Transceiver: internal
        Auto-negotiation: on
        MDI-X: off (auto)
        Supports Wake-on: pumbg
        Wake-on: g
        Current message level: 0x00000007 (7)
                               drv probe link
        Link detected: yes
Typically, there are just a few parameters from the ethtool output that are of interest, and these are the Speed and Duplex settings. They show you how your network board is talking to other nodes. If you see, for example, that your server is set to full duplex, whereas all other nodes in your network use half duplex, you’ve found your problem and know what you need to fix. Duplex setting misconfigurations are becoming more and more uncommon, however. A common error is that the supported link speed cannot be reached. If a network card supports gigabit, but only gives 100Mbit/s, that is often due to a hardware misconfiguration of one of the network devices that is involved.
Another good tool with which to monitor what is happening on the network is IPTraf-ng (start it by typing iptraf-ng). This useful tool, however, is not included in the default installation or SLES repositories. You can download the RPM from the Internet, after which it can be installed manually. This is a real-time monitoring tool that shows what is happening on the network from a text-user interface. After starting, it will show you a menu from which you can choose what you want to see. Different useful filtering options are offered. (See Figure 15-1.)
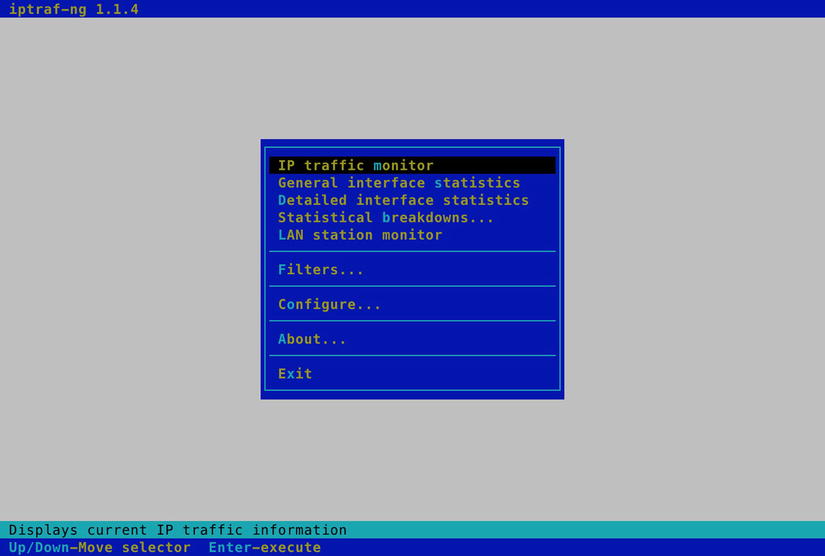
Figure 15-1. IPTraf allows you to analyze network traffic from a menu
Before starting IPTraf, use the configure option. From there, you can specify exactly what you want to see and how you want it to be displayed. For instance, a useful setting to change is the additional port range. By default, IPTraf shows activity on privileged TCP/UDP ports only. If you have a specific application that you want to monitor that doesn’t use one of these privileged ports, select Additional ports from the configuration interface and specify additional ports that you want to monitor. (See Figure 15-2.)

Figure 15-2. Use the filter options to select what you want to see
After telling IPTraf how to do its work, use the IP traffic monitor option to start the tool. Next, you can select the interface on which you want to listen, or just hit Enter to listen on all interfaces. This will start the IPTraf interface, which displays everything that is going on at your server and also exactly on what port it is happening. In Figure 15-3, you can see that the server that is monitored currently has two sessions enabled, and also you can see which are the IP addresses and ports involved in that session.

Figure 15-3. IPtraf gives a quick overview of the kind of traffic sent on an interface
If it’s not so much the performance on the network board that you are interested in but more what is happening at the service level, netstat is a good basic network performance tool. It uses different parameters to show you what ports are open and on what ports your server sees activity. My personal favorite way of using netstat is by issuing the netstat -tulpn command. This gives an overview of all listening ports on the server and even tells you what other node is connected to a particular port. See Listing 15-19 for an overview.
Listing 15-19. With netstat, You Can See What Ports Are Listening on Your Server and Who Is Connected
[root@lab ~]# netstat -tulpn
Active Internet connections (only servers)
Proto Recv-Q Send-Q Local Address           Foreign Address         State       PID/Program name
tcp        0      0 127.0.0.1:5913          0.0.0.0:*               LISTEN      31322/qemu-kvm
tcp        0      0 127.0.0.1:25            0.0.0.0:*               LISTEN      1980/master
tcp        0      0 127.0.0.1:5914          0.0.0.0:*               LISTEN      31347/qemu-kvm
tcp        0      0 127.0.0.1:6010          0.0.0.0:*               LISTEN      28676/sshd: sander@
tcp        0      0 0.0.0.0:48702           0.0.0.0:*               LISTEN      1542/rpc.statd
tcp        0      0 0.0.0.0:2022            0.0.0.0:*               LISTEN      1509/sshd
tcp        0      0 127.0.0.1:5900          0.0.0.0:*               LISTEN      13719/qemu-kvm
tcp        0      0 127.0.0.1:5901          0.0.0.0:*               LISTEN      16388/qemu-kvm
tcp        0      0 127.0.0.1:5902          0.0.0.0:*               LISTEN      18513/qemu-kvm
tcp        0      0 127.0.0.1:5903          0.0.0.0:*               LISTEN      18540/qemu-kvm
tcp        0      0 0.0.0.0:111             0.0.0.0:*               LISTEN      1498/rpcbind
tcp        0      0 127.0.0.1:5904          0.0.0.0:*               LISTEN      18450/qemu-kvm
tcp        0      0 127.0.0.1:5905          0.0.0.0:*               LISTEN      18919/qemu-kvm
tcp        0      0 127.0.0.1:5906          0.0.0.0:*               LISTEN      19542/qemu-kvm
tcp        0      0 127.0.0.1:5907          0.0.0.0:*               LISTEN      19586/qemu-kvm
tcp        0      0 127.0.0.1:5908          0.0.0.0:*               LISTEN      19631/qemu-kvm
tcp        0      0 127.0.0.1:5909          0.0.0.0:*               LISTEN      24773/qemu-kvm
tcp        0      0 192.168.122.1:53        0.0.0.0:*               LISTEN      2939/dnsmasq
tcp        0      0 127.0.0.1:5910          0.0.0.0:*               LISTEN      31234/qemu-kvm
tcp        0      0 127.0.0.1:5911          0.0.0.0:*               LISTEN      31274/qemu-kvm
tcp        0      0 127.0.0.1:631           0.0.0.0:*               LISTEN      3228/cupsd
tcp        0      0 127.0.0.1:5912          0.0.0.0:*               LISTEN      31301/qemu-kvm
tcp6       0      0 ::1:25                  :::*                    LISTEN      1980/master
tcp6       0      0 ::1:6010                :::*                    LISTEN      28676/sshd: sander@
tcp6       0      0 :::2022                 :::*                    LISTEN      1509/sshd
tcp6       0      0 :::111                  :::*                    LISTEN      1498/rpcbind
tcp6       0      0 :::58226                :::*                    LISTEN      1542/rpc.statd
tcp6       0      0 :::21                   :::*                    LISTEN      25370/vsftpd
tcp6       0      0 fe80::fc54:ff:fe88:e:53 :::*                    LISTEN      2939/dnsmasq
tcp6       0      0 ::1:631                 :::*                    LISTEN      3228/cupsd
udp        0      0 192.168.122.1:53        0.0.0.0:*                           2939/dnsmasq
udp        0      0 0.0.0.0:67              0.0.0.0:*                           2939/dnsmasq
udp        0      0 0.0.0.0:111             0.0.0.0:*                           1498/rpcbind
udp        0      0 0.0.0.0:123             0.0.0.0:*                           926/chronyd
udp        0      0 127.0.0.1:323           0.0.0.0:*                           926/chronyd
udp        0      0 0.0.0.0:816             0.0.0.0:*                           1498/rpcbind
udp        0      0 127.0.0.1:870           0.0.0.0:*                           1542/rpc.statd
udp        0      0 0.0.0.0:35523           0.0.0.0:*                           891/avahi-daemon: r
udp        0      0 0.0.0.0:52582           0.0.0.0:*                           1542/rpc.statd
udp        0      0 0.0.0.0:5353            0.0.0.0:*                           891/avahi-daemon: r
When using netstat, many options are available. Following, you’ll find an overview of the most interesting ones:
- p: Shows the PID of the program that has opened a port
- c: Updates the display every second
- s: Shows statistics for IP, UDP, TCP, and ICMP
- t: Shows TCP sockets
- u: Shows UDP sockets
- w: Shows RAW sockets
- l: Shows listening ports
- n: Resolves addresses to names
There are many other tools to monitor the network as well, most of them fall beyond the scope of this chapter, because they are rather protocol- or service-specific and won’t help you as much in finding performance problems on the network. There is, however, one very simple performance-testing method that I always use when analyzing a performance problem, which I will talk about at the end of this section.
In many cases, to judge network performance, you’re only interested in knowing how fast data can be copied to and from your server. After all, that’s the only parameter that you can change. To measure that, you can use a simple test. I like to create a big file (1GB, for example) and copy that over the network. To measure time, I use the time command, which gives a clear impression of how long it really took to copy the file. For example, time scp server:/bigfile /localdir will end with a summary of the total time it took to copy the file over. This is an excellent test, especially when you start optimizing performance, as it will show you immediately whether or not you’ve reached your goals.
Optimizing Performance
Now that you know what to look for in your server’s performance, it’s time to start optimizing. Optimizing performance is a complicated job, and you shouldn’t have the impression that after reading the tips in this chapter you know everything about server performance optimization. Nevertheless, it’s good to know about at least some of the basic approaches to make your server perform better.
You can look at performance optimization in two different ways. For some people, it involves just changing some parameters and seeing what happens. That is not the best approach. A much better approach is when you first start with performance monitoring. This will give you some clear ideas on what exactly is happening with performance on your server. Before optimizing anything, you should know what exactly to optimize. For example, if the network performs poorly, you should know if that is because of problems on the network, or just because you don’t have enough memory allocated for the network. So make sure you know what to optimize. You’ve just read in the previous sections how you can do this.
Once you know what to optimize, it comes down to doing it. In many situations, optimizing performance means writing a parameter to the /proc file system. This file system is created by the kernel when your server comes up and normally contains the settings that your kernel is working with. Under /proc/sys, you’ll find many system parameters that can be changed. The easy way to do this is by just echoing the new value to the configuration file. For example, the /proc/sys/vm/swappiness file contains a value that indicates how willing your server is to swap. The range of this value is between 0 and 100, a low value means that your server will avoid a swap as long as possible; a high value means that your server is more willing to swap. The default value in this file is 60. If you think your server is too eager to swap, you could change it, using the following:
echo "30" > /proc/sys/vm/swappiness
This method works well, but there is a problem. As soon as the server restarts, you will lose this value. So the better solution is to store it in a configuration file and make sure that the configuration file is read when your server comes up again. A configuration file exists for this purpose, and the name of the file is /etc/sysctl.conf. When booting, your server starts the sysctl service that reads this configuration file and applies all settings in it. The sysctl file is always read when your server starts to apply the settings it contains.
In /etc/sysctl.conf, you refer to files that exist in the /proc/sys hierarchy. So the name of the file you are referring to is relative to this directory. Also, instead of using a slash as the separator between directory, subdirectories, and files, it is common to use a dot (even if the slash is accepted as well). That means that to apply the change to the swappiness parameter as explained above, you would include the following line in /etc/sysctl.conf:
vm.swappiness=30
This setting would be applied the next time that your server reboots. Instead of just writing it to the configuration file, you can apply it to the current sysctl settings as well. To do that, use the sysctl command. The following command can be used to apply this setting immediately:
sysctl -w vm.swappiness=30
Using sysctl -w is exactly the same as using the echo "30" > /proc/sys/vm/swappiness command—it does not also write the setting to the sysctl.conf file. The most practical way of applying these settings is to write them to /etc/sysctl.conf first and then activate them using sysctl -p /etc/sysctl.conf. Once activated in this way, you can also get an overview of all current sysctl settings, using sysctl -a. In Listing 15-20, you can see a part of the output of this command.
Listing 15-20. sysctl -a Shows All Current sysctl Settings
vm.min_free_kbytes = 67584
vm.min_slab_ratio = 5
vm.min_unmapped_ratio = 1
vm.mmap_min_addr = 4096
vm.nr_hugepages = 0
vm.nr_hugepages_mempolicy = 0
vm.nr_overcommit_hugepages = 0
vm.nr_pdflush_threads = 0
vm.numa_zonelist_order = default
vm.oom_dump_tasks = 1
vm.oom_kill_allocating_task = 0
vm.overcommit_kbytes = 0
vm.overcommit_memory = 0
vm.overcommit_ratio = 50
vm.page-cluster = 3
vm.panic_on_oom = 0
vm.percpu_pagelist_fraction = 0
vm.scan_unevictable_pages = 0
vm.stat_interval = 1
vm.swappiness = 60
vm.user_reserve_kbytes = 131072
vm.vfs_cache_pressure = 100
vm.zone_reclaim_mode = 0
The output of sysctl -a is overwhelming, as all the kernel tunables are shown, and there are hundreds of them. I recommend that you use it in combination with grep, to find the information you need. For example, sysctl -a | grep huge would only show you lines that have the text huge in their output.
Using a Simple Performance Optimization Test
Although sysctl and its configuration file sysctl.conf are very useful tools to change performance-related settings, you shouldn’t use them immediately. Before writing a parameter to the system, make sure this really is the parameter you need. The big question, though, is how to know that for sure. There’s only one answer to that: testing. Before starting any test, be aware that tests always have their limitations. The test proposed here is far from perfect, and you shouldn’t use this test alone to draw definitive conclusions about the performance optimization of your server. Nevertheless, it gives a good impression especially of the write performance on your server.
The test consists of creating a 1GB file, using the following:
dd if=/dev/zero of=/root/1GBfile bs=1M count=1024
By copying this file around and measuring the time it takes to copy it, you can get a decent idea of the effect of some of the parameters. Many tasks you perform on your Linux server are I/O-related, so this simple test can give you an impression of whether or not there is any improvement. To measure the time it takes to copy this file, use the time command, followed by cp, as in time cp /root/1GBfile /tmp. In Listing 15-21, you can see what this looks like when doing it on your server.
Listing 15-21. Timing How Long It Takes to Copy a Large File Around, to Get an Idea of the Current Performance of Your Server
[root@hnl ~]# dd if=/dev/zero of=/1Gfile bs=1M count=1024
1024+0 records in
1024+0 records out
1073741824 bytes (1.1 GB) copied, 16.0352 s, 67.0 MB/s
[root@hnl ~]# time cp /1Gfile /tmp

real    0m20.469s
user    0m0.005s
sys     0m7.568s
The time command gives you three different indicators: the real time, the user time, and the sys (system) time it took to complete the command. Real time is the time from initiation to completion of the command. User time is the time the kernel spent in user space, and sys time is the time the kernel spent in system space. When doing a test such as this, it is important to interpret it in the right way. Consider, for example, Listing 15-22, in which the same command is repeated a few seconds later.
Listing 15-22. The Same Test, Ten Seconds Later
[root@hnl ~]# time cp /1Gfile /tmp

real    0m33.511s
user    0m0.003s
sys     0m7.436s
As you can see, the command now performs slower than the first time it was used. This is only in real time, however, and not in sys time. Is this the result of a performance parameter that I’ve changed in between? No, but let’s have a look at the result of free –m, as in Listing 15-23.
Listing 15-23. Take Other Factors into Consideration
root@hnl:~# free -m
                    total       used       free     shared    buffers     cached
Mem:                3987        2246       1741          0         17       2108
-/+buffers/cache:                119       3867
Swap:               2047           0       2047
Any idea what has happened here? The entire 1GB file was put in cache when the command was first executed. As you can see, free -m shows almost 2GB of data in cache, which wasn’t there before and that has an influence on the time it takes to copy a large file around.
So what lesson is there to learn? Performance optimization is complex. You have to take into account multiple factors that all have an influence on the performance of your server. Only when this is done the right way will you truly see how your server performs and whether or not you have succeeded in improving its performance. When not looking properly, you may miss things and think you have improved performance, while in reality, you have worsened it. So, it is important to develop reliable procedures for performance testing and stick to them.
CPU Tuning
In this section, you’ll learn what you can do to optimize the performance of your server’s CPU. First you’ll learn about some aspects of the working of the CPU that are important when trying to optimize performance parameters for the CPU, then you’ll read about some common techniques to optimize CPU utilization.
Understanding CPU Performance
To be able to tune the CPU, you should know what is important with regard to this part of your system. To understand the CPU, you should know about the thread scheduler. This part of the kernel makes sure that all process threads get an equal amount of CPU cycles. Because most processes will do some I/O as well, it’s not really bad that the scheduler puts process threads on hold for a given moment. While not being served by the CPU, the process thread can handle its I/O. The scheduler operates by using fairness, meaning that all threads are moving forward in an even manner. By using fairness, the scheduler makes sure there is not too much latency.
The scheduling process is pretty simple in a single CPU / core environment. If, however, multiple cores are used, it becomes more complicated. To work in a multi-CPU or multi-core environment, your server will use a specialized symmetric multiprocessing (SMP) kernel. If needed, this kernel is installed automatically. In an SMP environment, the scheduler should make sure that some kind of load balancing is used. This means that process threads are spread over the available CPU cores. Some programs are written to be used in an SMP environment and are able to use multiple CPUs by themselves. Most programs can’t do that and for this depend on the capabilities of the kernel.
A specific worry in a multi-CPU environment is that the scheduler should prevent processes and threads from being moved to other CPU cores. Moving a process means that the information the process has written in the CPU cache has to be moved as well, and that is a relatively expensive process.
You may think that a server will always benefit from installing multiple CPU cores, but that is not true. When working on multiple cores, chances increase that processes swap around between cores, taking their cached information with them, and that slows down performance in a multiprocessing environment. When using multi-core systems, you should always optimize your system for that.
Optimizing CPU Performance
CPU performance optimization really is just about two things: priority and optimization of the SMP environment. Every process gets a static priority from the scheduler. The scheduler can differentiate between real time (RT) processes and normal processes, but if a process falls in one of these categories, it will be equal to all other processes in the same category. Be aware, however, that some real-time processes (most are part of the Linux kernel) will run with the highest priority, whereas the rest of available CPU cycles must be divided among the other processes. In that procedure, it’s all about fairness: the longer a process is waiting, the higher its priority will be. You have already learned how to use the nice command to tune process priority.
If you are working in an SMP environment, a good utility to improve performance is the taskset command. You can use taskset to set CPU affinity for a process to one or more CPUs. The result is that your process is less likely to be moved to another CPU. The taskset command uses a hexadecimal bitmask to specify which CPU to use. In this bitmap, the value 0x1 refers to CPU0, 0x2 refers to CPU1, 0x4 to CPU2, 0x8 to CPU3, and so on. Note that these numbers do combine, so use 0x3 to refer to CPUs 0 and 1.
So, if you have a command that you would like to bind to CPUs 2 and 3, you would use the following command:
taskset 0x12 somecommand
You can also use taskset on running processes, by using the -p option. With this option, you can refer to the PID of a processes, for instance,
taskset -p 0x3 7034
would set the affinity of the process using PID 7034 to CPUs 0 and 1.
You can specify CPU affinity for IRQs as well. To do this, you can use the same bitmask that you use with taskset. Every interrupt has a subdirectory in /proc/irq/, and in that subdirectory, there is a file with the name smp_affinity. So, if, for example, your IRQ 5 is producing a very high workload (check /proc/interrupts to see if this is the case), and, therefore, you want that IRQ to work on CPU1, use the following command:
echo 2 > /proc/irq/3/smp_affinity
Another approach to optimize CPU performance is by using cgroups. Cgroups provide a new way to optimize all aspects of performance, including CPU, memory, I/O, and more. At the end of this chapter, you’ll read about using cgroups.
Apart from the generic settings discussed here, there are some more specific ways of optimizing CPU performance. Most of them relate to the working of the scheduler. You can find these settings in /proc/sys/kernel. All files with a name that begins with sched relate to CPU optimization. One example of these is the sched_latency_ns, which defines the latency of the scheduler in nanoseconds. You could consider decreasing the latency that you find here, to get better CPU performance. However, you should realize that optimizing the CPU brings benefits only in very specific environments. For most environments, it doesn’t make that much sense, and you can get much better results by improving performance of important system parts, such as memory and disk.
Tuning Memory
System memory is a very important part of a computer. It functions as a buffer between CPU and I/O, and by tuning memory, you can really get the best out of it. Linux works with the concept of virtual memory, which is the total of all memory available on a server. You can tune the working of virtual memory by writing to the /proc/sys/vm directory. This directory contains lots of parameters that help you to tune the way your server’s memory is used. As always when tuning the performance of a server, there are no solutions that work in all cases. Use the parameters in /proc/sys/vm with caution, and use them one by one. Only by tuning each parameter individually, will you be able to determine if it gave the desired result.
Understanding Memory Performance
In a Linux system, the virtual memory is used for many purposes. First, there are processes that claim their amount of memory. When tuning for processes, it helps to know how these processes allocate memory, for instance, a database server that allocates large amounts of system memory when starting up has different needs than a mail server that works with small files only. Also, each process has its own memory space, which may not be addressed by other processes. The kernel takes care that this never occurs.
When a process is created, using the fork() system call (which basically creates a child process from the parent), the kernel creates a virtual address space for the process. The kernel part that takes care of that is known as the dynamic linker. The virtual address space that is used by a process is made up of pages. On a 64-bit server, you can choose between 4, 8, 16, 32, and 64KB pages, but the default pages’ size is set to 4KB and is rarely changed. For applications that require lots of memory, you can optimize memory by configuring huge pages.
Another important aspect of memory usage is caching. In your system, there is a read cache and a write cache, and it may not surprise you that a server that handles read requests most of the time is tuned in another way than a server that handles write requests.
Configuring Huge Pages
If your server is a heavily used application server, it may benefit from using large pages, also referred to as huge pages. A huge page, by default, is a 2MB page, and it may be useful to improve performance in high-performance computing and with memory-intensive applications. By default, no huge pages are allocated, as they would be a waste on a server that doesn’t need them—memory that is used for huge pages cannot be used for anything else. Typically, you set huge pages from the Grub boot loader when starting your server. In Exercise 15-5, you’ll learn how to set huge pages.
EXERCISE 15-5. CONFIGURING HUGE PAGES
In this exercise, you’ll configure huge pages. You’ll set them as a kernel argument and then you’ll verify their availability. Note that in this procedure, you’ll specify the amount of huge pages as a boot argument to the kernel. You can also set it from the /proc file system, as explained later.
- Using an editor, open the Grub menu configuration file in /etc/default.grub.
- Find the section that starts your kernel and add hugepages=64 to the kernel line.
- Save your settings and reboot your server to activate them.
- Use cat /proc/sys/vm/nr_hugepages to confirm that there are 64 huge pages set on your system. Note that all memory that is allocated in huge pages is not available for other purposes.
Be careful, however, when allocating huge pages. All memory pages that are allocated as huge pages are no longer available for other purposes, and if your server needs a heavy read or write cache, you will suffer from allocating too many huge pages immediately. If you find that this is the case, you can change the amount of huge pages currently in use by writing to the /proc/sys/vm/nr_hugepages parameter. Your server will pick up this new amount of huge pages immediately.
Optimizing Write Cache
The next couple of parameters all relate to the buffer cache. As discussed earlier, your server maintains a write cache. By putting data in that write cache, the server can delay writing data. This is useful for more than one reason. Imagine that just after committing the write request to the server, another write request is made. It will be easier for the server to handle that write request, if the data is not yet written to disk but still in memory. You may also want to tune the write cache to balance between the amount of memory reserved for reading and the amount that is reserved for writing data.
The first relevant parameter is in /proc/sys/vm/dirty_ratio. This parameter is used to define the percentage of memory that is maximally used for the write cache. When the percentage of buffer cache in use comes above this parameter, your server will write memory from the buffer cache to disk as soon as possible. The default of 10 percent works fine for an average server, but in some situations, you may want to increase or decrease the amount of memory used here.
Related to dirty_ration are the dirty_expire_centisecs and dirty_writeback_centisecs parameters, also in /proc/sys/vm. These parameters determine when data in the write cache expires and have to be written to disk, even if the write cache hasn’t reached the threshold, as defined in dirty_ratio, yet. By using these parameters, you reduce the chances of losing data when a power outage occurs on your server. On the contrary, if you want to use power more efficiently, it is useful to give both these parameters the value of 0, which actually disables them and keeps data as long as possible in the write cache. This is useful for laptop computers, because your hard disk has to spin up in order to write these data, and that takes a lot of power.
The last parameter that is related to writing data, is nr_pdflush_threads. This parameter helps in determining the amount of threads the kernel launches for writing data from the buffer cache. Understanding it is easy; more of these means faster write back. So, if you have the idea that buffer cache on your server is not cleared fast enough, increase the amount of pdflush_threads, using the following command by echoing a 4 to the file /proc/sys/vm/nr_pdflush_threads.
When using this option, do respect its limitations. By default, the minimal amount of pdflush_threads is set to 2, and there is a maximum of 8, so that the kernel still has a dynamic range to determine what exactly it has to do.
Overcommitting Memory
Next, there is the issue of overcommitting memory. By default, every process tends to claim more memory than it really needs. This is good, because it makes the process faster. If the process already has some spare memory available, it can access it much faster when it needs it, because it doesn’t have to ask the kernel if it has some more memory available. To tune the behavior of overcommitting memory, you can write to the /proc/sys/vm/overcommit_memory parameter. This parameter can have some values. The default value is 0, which means that the kernel checks if it still has memory available before granting it. If that doesn’t give you the performance you need, you can consider changing it to 1, which means that the system thinks there is enough memory in all cases. This is good for performance of memory-intensive tasks but may result in processes getting killed automatically. You can also use the value of 2, which means that the kernel fails the memory request if there is not enough memory available.
This minimal amount of memory that is available is specified in the /proc/sys/vm/overcommit_ratio parameter, which by default is set to 50. This means that the kernel can allocate 50 percent more than the total amount of memory that is available in RAM + swap. So, on a 4GB system that has 2GB swap, the total amount of addressable memory would be set to 9GB when using the value 50 in overcommit_ration.
Another useful parameter is the /proc/sys/vm/swappiness parameter. This indicates how eager the process is to start swapping out memory pages. A high value means that your server will swap very fast; a low value means that the server will wait some more before starting to swap. The default value of 60 does well in most situations. If you still think your server starts swapping too fast, set it to a somewhat lower value, like 40.
Optimizing Inter Process Communication
The last relevant parameters that relate to memory are the parameters that relate to shared memory. Shared memory is a method that the Linux kernel or Linux applications can use to make communication between processes (also known as Inter Process Communication or IPC) as fast as possible. In database environments, it often makes sense to optimize shared memory. The cool thing about shared memory is that the kernel is not involved in the communication between the processes using it. Data doesn’t even have to be copied, because the memory areas can be addressed directly. To get an idea of shared memory–related settings your server is currently using, use the ipcs -lm command, as shown in Listing 15-24.
Listing 15-24. Use the ipcs -lm Command to Get an Idea of Shared Memory Settings
[root@lab ~]# ipcs -lm

------ Shared Memory Limits --------
max number of segments = 4096
max seg size (kbytes) = 4194303
max total shared memory (kbytes) = 1073741824
min seg size (bytes) = 1
When your applications are written to use shared memory, you can benefit from tuning some of their parameters. If, on the contrary, your applications don’t know how to handle it, it doesn’t make a difference if you change the shared memory–related parameters. To find out if shared memory is used on your server, and, if so, in what amount it is used, apply the ipcs -m command. In Listing 15-25, you can see an example of its output on a server on which only one shared memory segment is used.
Listing 15-25. Use ipcs -m to Find Out If Your Server Is Using Shared Memory Segments
[root@lab ~]# ipcs -m

------ Shared Memory Segments --------
key        shmid      owner      perms      bytes      nattch     status
0x00000000 65536      root       600        4194304    2          dest
0x00000000 163841     root       600        4194304    2          dest
0x00000000 557058     root       600        4194304    2          dest
0x00000000 294915     root       600        393216     2          dest
0x00000000 458756     root       600        2097152    2          dest
0x00000000 425989     root       600        1048576    2          dest
0x00000000 5865478    root       777        3145728    1
0x00000000 622599     root       600        16777216   2          dest
0x00000000 1048584    root       600        33554432   2          dest
0x00000000 6029321    root       777        3145728    1
0x00000000 6127626    root       777        3145728    1
0x00000000 6193163    root       777        3145728    1
0x00000000 6258700    root       777        3145728    1
The first /proc parameter that is related to shared memory is shmmax. This defines the maximum size in bytes of a single shared-memory segment that a Linux process can allocate. You can see the current setting in the configuration file /proc/sys/kernel/shmmax, as follows:
    root@hnl:~# cat /proc/sys/kernel/shmmax
33554432
This sample was taken from a system that has 4GB of RAM. The shmmax setting was automatically created to allow processes to allocate up to about 3.3GB of RAM. It doesn’t make sense to tune the parameter to use all available RAM, because RAM has to be used for other purposes as well.
The second parameter that is related to shared memory is shmmni, which is not, as you might think, the minimal size of shared memory segments but the maximum size of the shared memory segments that your kernel can allocate. You can get the default value from /proc/sys/kernel/shmmni; it should be set to 4096. If you have an application that relies heavily on the use of shared memory, you may benefit from increasing this parameter, for example:
sysctl -w kernel.shmmni=8192
The last parameter related to shared memory is shmall. It is set in /proc/sys/kernel/shmall and defines the total amount of shared memory pages that can be used system-wide. Normally, the value should be set to the value of shmmax, divided by the current page size your server is using. On a 32-bit processor, finding the page size is easy; it is always set to 4096. On a 64-bit computer, you can use the getconf command to determine the current page size:
[root@hnl ~]# getconf PAGE_SIZE

4096
If the shmall parameter doesn’t contain a value that is big enough for your application, change it, as needed. For instance, use the following command:
sysctl -w kernel.shmall=2097152
Tuning Storage Performance
The third element in the chain of Linux performance is the storage channel. Performance optimization on this channel can be divided in two: journal optimization and I/O buffer performance. Apart from that, there are some other file system parameters that can be tunes to optimize performance.
Understanding Storage Performance
To determine what happens with I/O on your server, Linux uses the I/O scheduler. This kernel component sits between the block layer that communicates directly with the file systems and the device drivers. The block layer generates I/O requests for the file systems and passes those requests to the I/O scheduler. This scheduler, in turn, transforms the request and passes it to the low-level drivers. The drivers, in turn, next forward the request to the actual storage devices. Optimizing storage performance begins with optimizing the I/O scheduler.
Optimizing the I/O Scheduler
Working with an I/O scheduler makes your computer more flexible. The I/O scheduler can prioritize I/O requests and reduce times for searching data on the hard disk. Also, the I/O scheduler makes sure that a request is handled before it times out. An important goal of the I/O scheduler is to make hard disk seek times more efficient. The scheduler does this by collecting requests before really committing them to disk. Because of this approach, the scheduler can do its work more efficiently. For example, it may choose to order requests before committing them to disk, which makes hard disk seeks more efficient.
When optimizing the performance of the I/O scheduler, there is a dilemma: you can optimize read performance or write performance but not both at the same time. Optimizing read performance means that write performance will be not as good, whereas optimizing write performance means you have to pay a price in read performance. So before starting to optimize the I/O scheduler, you should really analyze what type of workload is generated by your server.
There are four different ways in which the I/O scheduler does its work.
- Complete fair queueing (cfq): When choosing this approach, the I/O scheduler tries to allocate I/O bandwidth fairly. This approach offers a good solution for machines with mixed workloads and offers the best compromise between latency, which is relevant for reading data, and throughput, which is relevant in an environment in which there are a lot of file writes.
- NOOP: The NOOP scheduler performs only minimal merging functions on your data. There is no sorting, and therefore, this scheduler has minimal overhead. This scheduler was developed for non-disk-based block devices, such as memory devices. It also does well on storage media that have extensive caching.
- Deadline: The deadline scheduler works with five different I/O queues and, therefore, is very capable of making a difference between read requests and write requests. When using this scheduler, read requests will get a higher priority. Write requests do not have a deadline, and, therefore, data to be written can remain in cache for a longer period. This scheduler does well in environments in which a good read performance, as well as a good write performance, is required, but shows some more priority for reads. This scheduler does particularly well in database environments.
- Anticipatory: The anticipatory scheduler tries to reduce read response times. It does so by introducing a controlled delay in all read requests. This increases the possibility that another read request can be handled in the same I/O request and therefore makes reads more efficient.
![]() Note The results of switching between I/O schedulers heavily depend on the nature of the workload of the specific server. The preceding summary is only a guideline, and before changing the I/O scheduler, you should test intensively to find out if it really leads to the desired results.
Note The results of switching between I/O schedulers heavily depend on the nature of the workload of the specific server. The preceding summary is only a guideline, and before changing the I/O scheduler, you should test intensively to find out if it really leads to the desired results.
There are two ways to change the current I/O scheduler. You can echo a new value to the /sys/block/<YOURDEVICE>/queue/scheduler file. Alternatively, you can set it as a boot parameter, using elevator=yourscheduler on the Grub prompt or in the grub menu. The choices are noop, anticipatory, deadline, and cfq.
Optimizing Storage for Reads
Another way to optimize the way your server works is by tuning read requests. This is something that you can do on a per-disk basis. First, there is read_ahead, which can be tuned in /sys/block/<YOURDEVICE>/queue/read_ahead_kb. On a default Linux installation, this parameter is set to 128KB. If you have fast disks, you can optimize your read performance by using a higher value; 512, for instance, is a starting point, but make sure always to test before making a new setting final. Also, you can tune the number of outstanding read requests by using /sys/block/<YOURDEVICE>/queue/nr_requests. The default value for this parameter also is set to 128, but a higher value may optimize your server in a significant way. Try 512, or even 1024, to get the best read performance, but do always observe that it doesn’t introduce too much latency while writing files.
![]() Note Optimizing read performance works well, but be aware that while making read performance better, you’ll also introduce latency on writes. In general, there is nothing against that, but if your server loses power, all data that is still in memory buffers and hasn’t been written yet will get lost.
Note Optimizing read performance works well, but be aware that while making read performance better, you’ll also introduce latency on writes. In general, there is nothing against that, but if your server loses power, all data that is still in memory buffers and hasn’t been written yet will get lost.
EXERCISE 15-6. CHANGING SCHEDULER PARAMETERS
In this exercise, you’ll change scheduler parameters and try to see a difference. Note that, normally, complex workloads will show differences better, so don’t be surprised if, with the simple tests proposed in this exercise, you don’t detect much of a difference.
- Open a root shell. Use the command cat /sys/block/sda/queue/scheduler to find out what the scheduler is currently set to. If it’s a default SLES installation, it will be set to cfq.
- Use the command dd if=/dev/urandom of=/dev/null to start some background workload. The idea is to start a process that is intense on reads but doesn’t write a lot.
- Write a script with the name reads that read the contents of all files in /etc, as follows:
cd /etc
for i in *
do
        cat $i
done - Run the script using time reads and note the time it takes for the script to complete.
- Run the command time dd if=/dev/zero of=/1Gfile bs=1M count=1000 and note the time it takes for the command to complete.
- Change the I/O scheduler setting to noop, anticipatory, and deadline and repeat steps 4 and 5. To change the current I/O-scheduler setting, use echo noop > /sys/block/sda/queue/scheduler. You now know which settings work best for this simple test environment.
- Use killall dd to make sure all dd jobs are terminated.
Changing Journal Options
By default, all modern file systems on Linux use journaling. On some specific workloads, the default journaling mode will cause you a lot of problems. You will determine if this is the case for your server by using iotop. If you see that kjournald is high on the list, you have a journaling issue that you must optimize.
There are three different journaling options, which you can set by using the data=journaloption mount option.
- data=writeback: This options guarantees internal file system integrity, but it doesn’t guarantee that new files have been committed to disk. In many cases, it is the fastest, but also the most insecure, journaling option.
- data=ordered: This is the default mode. It forces all data to be written to the file system before the metadata is written to the journal.
- data=journaled: This is the most secure journaling option, in which all data blocks are journaled as well. The performance price for using this option is high, but it does offer the best security for your files that you can imagine.
Network Tuning
Among the most difficult items to tune is network performance. This is because in networking, multiple layers of communication are involved, and each is handled separately on Linux. First, there are buffers on the network card itself that deal with physical packets. Next, there is the TCP/IP protocol stack, and then there is also the application stack. All work together, and tuning one will have its consequences on the other layer. While tuning the network, always work upward in the protocol stack. That is, start by tuning the packets themselves, then tune the TCP/IP stack, and after that, have a look at the service stacks that are in use on your server.
Tuning Network-Related Kernel Parameters
While it initializes, the kernel sets some parameters automatically, based on the amount of memory that is available on your server. So, the good news is that in many situations, there is no work to be done. Some parameters, by default, are not set in the most optimal way, so, in some cases, there is some performance to gain there.
For every network connection, the kernel allocates a socket. The socket is the end-to-end line of communication. Each socket has a receive buffer and a send buffer, also known as the read (receive) and write (send) buffers. These buffers are very important. If they are full, no more data can be processed, so data will be dropped. This will have important consequences for the performance of your server, because if data is dropped, it has to be sent and processed again.
The basis of all reserved sockets on the network comes from two /proc tunables:
/proc/sys/net/core/wmem_default
/proc/sys/net/core/rmem_default
All kernel-based sockets are reserved from these sockets. If, however, a socket is TCP-based, the settings in here are overwritten by TCP specific parameters, in particular the tcp_rmem and tcp_wmem parameters. In the next section, you can get more details on how to optimize those.
The values of the wmem_default and rmem_default are set automatically when your server boots. If you have dropped packets on the network interface, you may benefit from increasing them. For some workloads, the values that are used by default are rather low. To set them, tune the following parameters in /etc/sysctl.conf.
net.core.wmem_default
net.core.rmem_default
Especially if you have dropped packets, try doubling them, to find out if the dropped packets go away by doing so.
Related to the default read and write buffer size is the maximum read and write buffer size: rmem_max and wmem_max. These are also calculated automatically when your server comes up but, for many situations, are far too low. For example, on a server that has 4GB of RAM, the sizes of these are set to 128KB only! You may benefit from changing their values to something that is much larger, like 8MB.
sysctl -w net.core.rmem_max=8388608
sysctl -w net.core.wmem_max=8388608
When increasing the read and write buffer size, you also have to increase the maximum amount of incoming packets that can be queued. This is set in netdev_max_backlog. The default value is set to 1000, which is not enough for very busy servers. Try increasing it to a much higher value, like 8000, especially if you have long latency times on your network or if there are lots of dropped packets.
sysctl -w net.core.netdev_max_backlog=8000
Apart from the maximum number of incoming packets that your server can queue, there is also a maximum amount of incoming connections that can be accepted. You can set them from the somaxconn file in /proc.
sysctl -w net.core.somaxconn=512
By tuning this parameter, you will limit the amount of new connections dropped.
Optimizing TCP/IP
Up to now, you have tuned kernel buffers for network sockets only. These are generic parameters. If you are working with TCP, some specific tunables are available as well. Some TCP tunables, by default, have a value that is too low; many are self-tunable and adjust their values automatically, if that is needed. Chances are that you can gain a lot by increasing them. All relevant options are in /proc/sys/net/ipv4.
To start with, there is a read buffer size and a write buffer size that you can set for TCP. They are written to tcp_rmem and tcp_wmem. Here also, the kernel tries to allocate the best possible values when it boots, but in some cases, it doesn’t work out that well. If that happens, you can change the minimum size, the default size, and the maximum size of these buffers. Note that each of these two parameters contains three values at the same time, for minimal, default, and maximal size. In general, there is no need to tune the minimal size. It can be interesting, though, to tune the default size. This is the buffer size that will be available when your server boots. Tuning the maximum size is also important, as it defines the upper threshold above which packets will get dropped. In Listing 15-26, you can see the default settings for those parameters on my server that have 4GB of RAM.
Listing 15-26. Default Settings for TCP Read and Write Buffers
[root@hnl ~]# cat /proc/sys/net/ipv4/tcp_rmem
4096    87380   3985408
[root@hnl ~]# cat /proc/sys/net/ipv4/tcp_wmem
4096    16384   3985408
In this example, the maximum size is quite good; almost 4MB are available as the maximum size for read as well as write buffers. The default write buffer size is limited. Imagine that you want to tune these parameters in a way that the default write buffer size is as big as the default read buffer size, and the maximum for both parameters is set to 8MB. You could do that by using the following two commands:
sysctl -w net.ipv4.tcp_rmem="4096 87380 8388608"
sysctl -w net.ipv4.tcp_wmem="4096 87380 8388608"
Before tuning options like these, you should always check the availability of memory on your server. All memory that is allocated for TCP read and write buffers can’t be used for other purposes anymore, so you may cause problems in other areas while tuning these. It’s an important rule in tuning that you should always make sure the parameters are well-balanced.
Another useful set of parameters is related to the acknowledged nature of TCP. Let’s have a look at an example to understand how this works. Imagine that the sender in a TCP connection sends a series of packets, numbered 1,2,3,4,5,6,7,8,9,10. Now imagine that the receiver receives all of them, with the exception of packet 5. In the default setting, the receiver would acknowledge receiving up to packet 4, in which case, the sender would send packets 5,6,7,8,9,10 again. This is a waste of bandwidth, because packets 6,7,8,9,10 have been received correctly already.
To handle this acknowledgment traffic in a more efficient way, the setting /proc/sys/net/ipv4/tcp_sack is enabled (having the value of 1). That means, in such cases as the above, only missing packets have to be sent again, and not the complete packet stream. For your network bandwidth, that is fine, as only those packets that really need to be retransmitted are retransmitted. So, if your bandwidth is low, you should always leave it on. If, however, you are on a fast network, there is a downside. When using this parameter, packets may come in out of order. That means that you need larger TCP receive buffers to keep all the packets until they can be defragmented and put in the right order. That means that using this parameter involves more memory to be reserved, and from that perspective, on fast network connections, you had better switch it off. To do that, use the following:
sysctl -w net.ipv4.tcp_sack=0
When disabling TCP selective acknowledgments, as described previously, you should also disable two related parameters: tcp_dsack and tcp_fack. These parameters enable selective acknowledgments for specific packet types. To enable them, use the following two commands:
sysctl -w net.ipv4.tcp_dsack=0
sysctl -w net.ipv4.tcp_fack=0
In case you would prefer to work with selective acknowledgments, you can also tune the amount of memory that is reserved to buffer incoming packets that have to be put in the right order. Two parameters relate to this. First, there is ipfrag_low_tresh, and then there is ipfrag_high_tresh. When the amount that is specified in ipfrag_high_tresh is reached, new packets to be defragmented are dropped until the server reaches ipfrag_low_tresh. Make sure the value of both of these is set high enough at all times, if your server uses selective acknowledgments. The following values are reasonable for most servers:
sysctl -w net.ipv4.ipfrag_low_thresh=393216
sysctl -w net.ipv4.ipfrag_high_thresh=524288
Next, there is the length of the TCP Syn queue that is created for each port. The idea is that all incoming connections are queued until they can be serviced. As you can probably guess, when the queue is full, connections get dropped. The situation is that the tcp_max_syn_backlog that manages these per-port queues has a default value that is too low, as only 1024 bytes are reserved for each port. For good performance, better allocate 8192 bytes per port, using the following:
sysctl -w net.ipv4.tcp_max_syn_backlog=8192
Also, there are some options that relate to the time an established connection is maintained. The idea is that every connection that your server has to keep alive uses resources. If your server is a very busy server, at a given moment, it will be out of resources and tell new incoming clients that no resources are available. Because, for a client, in most cases, it is easy enough to reestablish a connection, you probably want to tune your server in such a way that it detects failing connections as soon as possible.
The first parameter that relates to maintaining connections is tcp_synack_retries. This parameter defines the number of times the kernel will send a response to an incoming new connection request. The default value is 5. Given the current quality of network connections, 3 is probably enough, and it is better for busy servers, because it makes a connection available sooner. So use the following to change it:
sysctl -w net.ipv4.tcp_synack_retries=3
Next, there is the tcp_retries2 option. This relates to the amount of times the server tries to resend data to a remote host that has an established session. Because it is inconvenient for a client computer if a connection is dropped, the default value is with 15 a lot higher than the default value for the tcp_synack_retries. However, retrying it 15 times means that during all that time, your server can’t use its resources for something else. Therefore, it is better to decrease this parameter to a more reasonable value of 5, as in the following:
sysctl -w net.ipv4.tcp_retries2=5
The parameters just mentioned relate to sessions that appear to be gone. Another area in which you can do some optimization is in the maintenance of inactive sessions. By default, a TCP session can remain idle forever. You probably don’t want that, so use the tcp_keepalive_time option to determine how long an established inactive session will be maintained. By default, this will be 7200 seconds (2 hours). If your server tends to run out of resources because too many requests are coming in, limit it to a considerably shorter period of time.
sysctl -w net.ipv4.tcp_keepalive_time=900
Related to the keepalive_time is the amount of packets that your server sends before deciding a connection is dead. You can manage this by using the tcp_keepalive_probes parameter. By default, nine packets are sent before a server is considered dead. Change it to three, if you want to terminate dead connections faster.
sysctl -w net.ipv4.tcp_keepalive_probes=3
Related to the amount of keep alive probes is the interval you want to use to send these probes. By default, that happens every 75 seconds. So even with 3 proves, it still takes more than 3 minutes before your server can see that a connection has really failed. To bring this period back, give the tcp_keepalive_intvl parameter the value of 15.
sysctl -w net.ipv4.tcp_keepalive_intvl=15
To complete the story about maintaining connections, we need two more parameters. By default, the kernel waits a little before reusing a socket. If you run a busy server, performance will benefit from switching this off. To do this, use the following two commands:
sysctl -w net.ipv4.tcp_tw_reuse=1
sysctl -w net.ipv4.tcp_tw_recycle=1
Generic Network Performance Optimization Tips
Until now, we have discussed kernel parameters only. There are also some more generic hints for optimizing performance on the network. You probably already have applied all of them, but just to be sure, let’s repeat some of the most important tips.
- Make sure you have the latest network driver modules.
- Use network card teaming to double performance of the network card in your server.
- Check Ethernet configuration settings, such as frame size, MTU, speed, and duplex mode on your network. Make sure all devices involved in network communications use the same settings.
- If supported by all devices in your network, use 9000-byte jumbo frames. This reduces the amount of packets sent over the network, and so, too, the overhead that is caused by sending all those packets, therefore speeding your network overall.
Optimizing Linux Performance Using Cgroups
Among the latest features for performance optimization that Linux has to offer, is cgroups (short for control groups), a technique that allows you to create groups of resources and allocate them to specific services. By using this solution, you can make sure that a fixed percentage of resources on your server is always available for those services that need it.
To start using cgroups, you first have to make sure the libcgroup RPM package is installed, so use zypper install libcgroup-tools to do that. Once its installation is confirmed, you have to start the cgconfig and cgred services. Make sure to put these in the runlevels of your server, using systemctl enable cgconfig and systemctl enable cgred on. Next, make sure to start these services. This will create a directory /cgroup with a couple of subdirectories in it. These subdirectories are referred to as controllers. The controllers refer to the system resources that you can limit using cgroups. Some of the most interesting include the following:
- blkio: Use this to limit the amount of IO that can be handled.
- cpu: This is used to limit CPU cycles.
- memory: Use this to limit the amount of memory that you can grant to processes.
There are some other controllers as well, but they are not as useful as the blkio, cpu, and memory controllers. Now let’s assume that you’re running an Oracle database on your server, and you want to make sure that it runs in a cgroup in which it has access to at least 75 percent of available memory and CPU cycles. The first step would be to create a cgroup that defines access to cpu and memory resources. The following command would create this cgroup with the name oracle: cgcreate -g cpu,memory oracle. After defining the cgroups this way, you’ll see that in the /cgroups/cpu and /cgroups/memory directory, a subdirectory with the name oracle is created. In this subdirectory, different parameters are available to specify the resources that you want to make available to the cgroup. (See Listing 15-27.)
Listing 15-27. In the Subdirectory of Your Cgroup, You’ll Find All Tunables
[root@hnl ~]# cd /cgroup/cpu/oracle/
[root@hnl oracle]# ls
cgroup.procs        cpu.rt_period_us       cpu.stat
cpu.cfs_period_us   cpu.rt_runtime_us    notify_on_release
cpu.cfs_quota_us    cpu.shares                   tasks
To specify the amount of CPU resources available for the newly created cgroup, you’ll use the cpu.shares parameter. This is a relative parameter that only makes sense if everything is in cgroups, and it defines the amount of shares available in this cgroup. That means that to the amount of shares in the cgroup oracle, you’ll assign the value 80, and for that in the cgroup other that contains all other processes, you’ll assign the value of 20. Thus the oracle cgroup receives 80 percent of available CPU resources. To set the parameter, you can use the cgset command: cgset -r cpu.shares=80 oracle.
After setting the amount of CPU shares for this cgroup, you can put processes in it. The best way to do this is to start the process you want to put in the cgroup as an argument to the cgexec command. In this example, that would mean that you’d run cgexec -g cpu:/oracle /path/to/oracle. At this time, the oracle process itself, and all its child processes, will be visible in the /cgroups/cpu/oracle/tasks file, and you have assigned Oracle to its specific cgroup.
In this example, you’ve seen how to manually create cgroups, make resources available to the cgroup, and put a process in it. The disadvantage of this approach is that after a system restart, all settings will be lost. To make the cgroups permanent, you have to use the cgconfig service and the cgred service. The cgconfig service reads its configuration file /etc/cgconfig.conf, in which the cgroups are defined, including the definition of the resources you want to assign to that cgroup. Listing 15-28 shows what it would look like for the oracle example:
Listing 15-28. Sample cgconfig.conf file
group oracle {
        cpu {
                cpu.shares=80
        }
        memory {
        }
}
Next, you have to create the file cgrules.conf, which specifies the processes that have to be put in a specific cgroup automatically. This file is read when the cgred service is starting. For the Oracle group, it would have the following contents:
*:oracle cpu,memory /oracle
If you have ensured that both the cgconfig service and the cgred service are starting from the runlevels, your services will be started automatically in the appropriate cgroup.
Summary
In this chapter, you’ve learned how to tune and optimize performance on your server. You’ve read that for both the tuning part and the optimization part, you’ll always have to look at four different categories: CPU, memory, I/O, and network. For each of these, several tools are available to optimize performance.
Often, performance optimization is done by tuning parameters in the /proc file system. In addition to that, there are different options, which can be very diverse, depending on the optimization you’re trying to get. An important new instrument to optimize performance are control groups (cgroups), which allow you to limit resources for services on your server in a very specific way.