
In this chapter, you will write a college-level report. This report will have all the bells and whistles needed to impress the instructor and get a good grade. These include the following and more:
Bullet lists
Footnotes
Quotes
End notes/bibliography
Tables
Graphics
In this chapter, you will create a report about how to write a report. Unlike most college reports (we hope), the quotes and sources will be made up.
Starting the Report
Begin by running LibreOffice Writer and selecting File ➤ New ➤ Text Document. Now every good report should start with a good title. From the Style selection box in the upper-right corner, select the Title style and then type in the title of the report: A statistical analysis of the structure of college essays and their relationship to the grade received. Long-winded perhaps, but that certainly is an A or at least A- paper based on the title . Figure 4-1 shows the result.
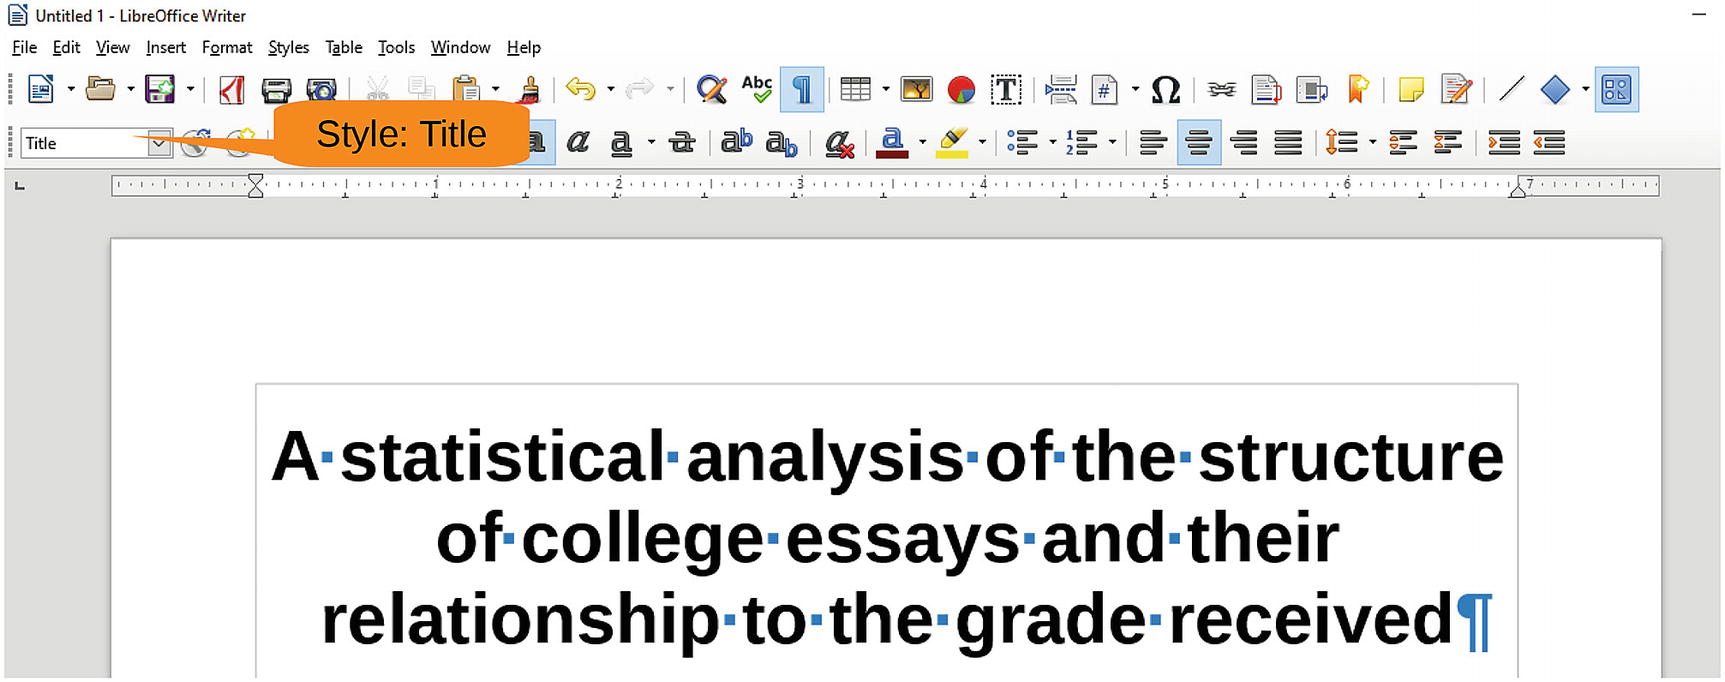
Figure 4-1 The title
Now let’s get to the next line by pressing Enter. This is where you put the author’s information. Let’s select the Subtitle style from the Style pull-down and type the author’s name . You will get something that looks like Figure 4-2.
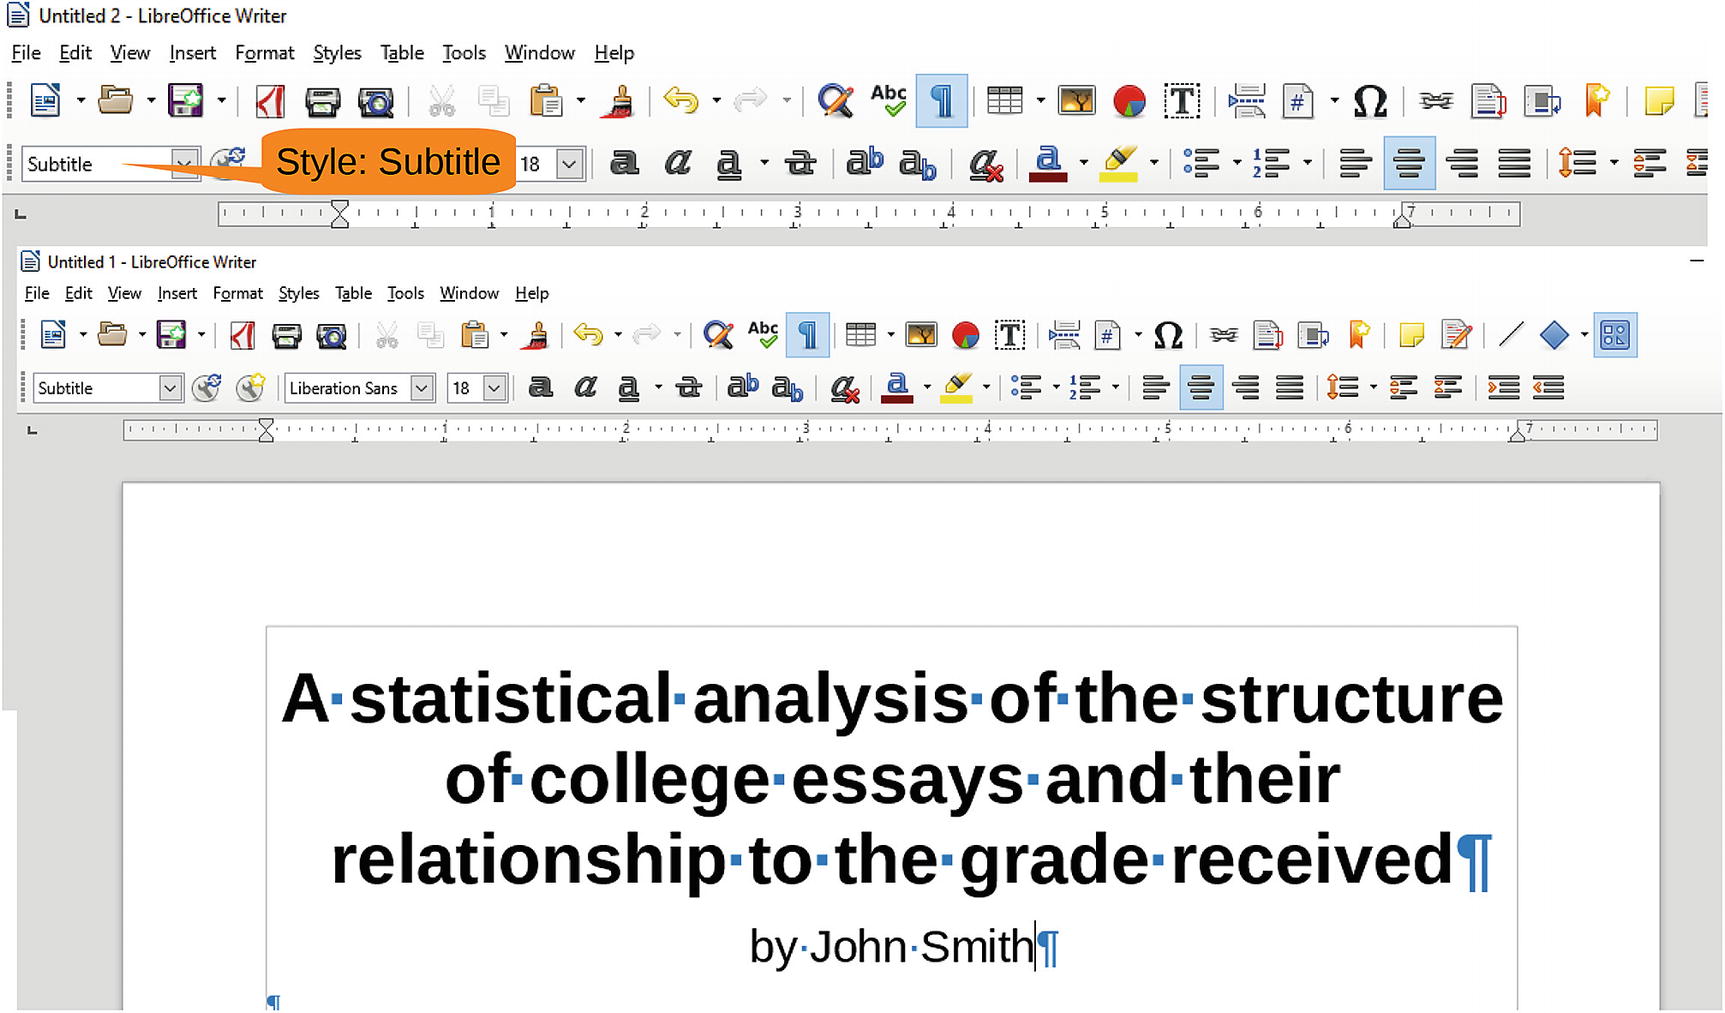
Figure 4-2 Author’s name
For this particular report, you will use structured numbered headings. It’s a school requirement we just made up so we could show you structured headings.
Press Enter to go to the next line, and select the style Heading 1 . Enter Level 1 Heading for the text of this heading (not the most imaginative heading, but it does get the point across). Now, click the number icon, just a little left of center on the toolbar. Figure 4-3 shows the numbered heading.
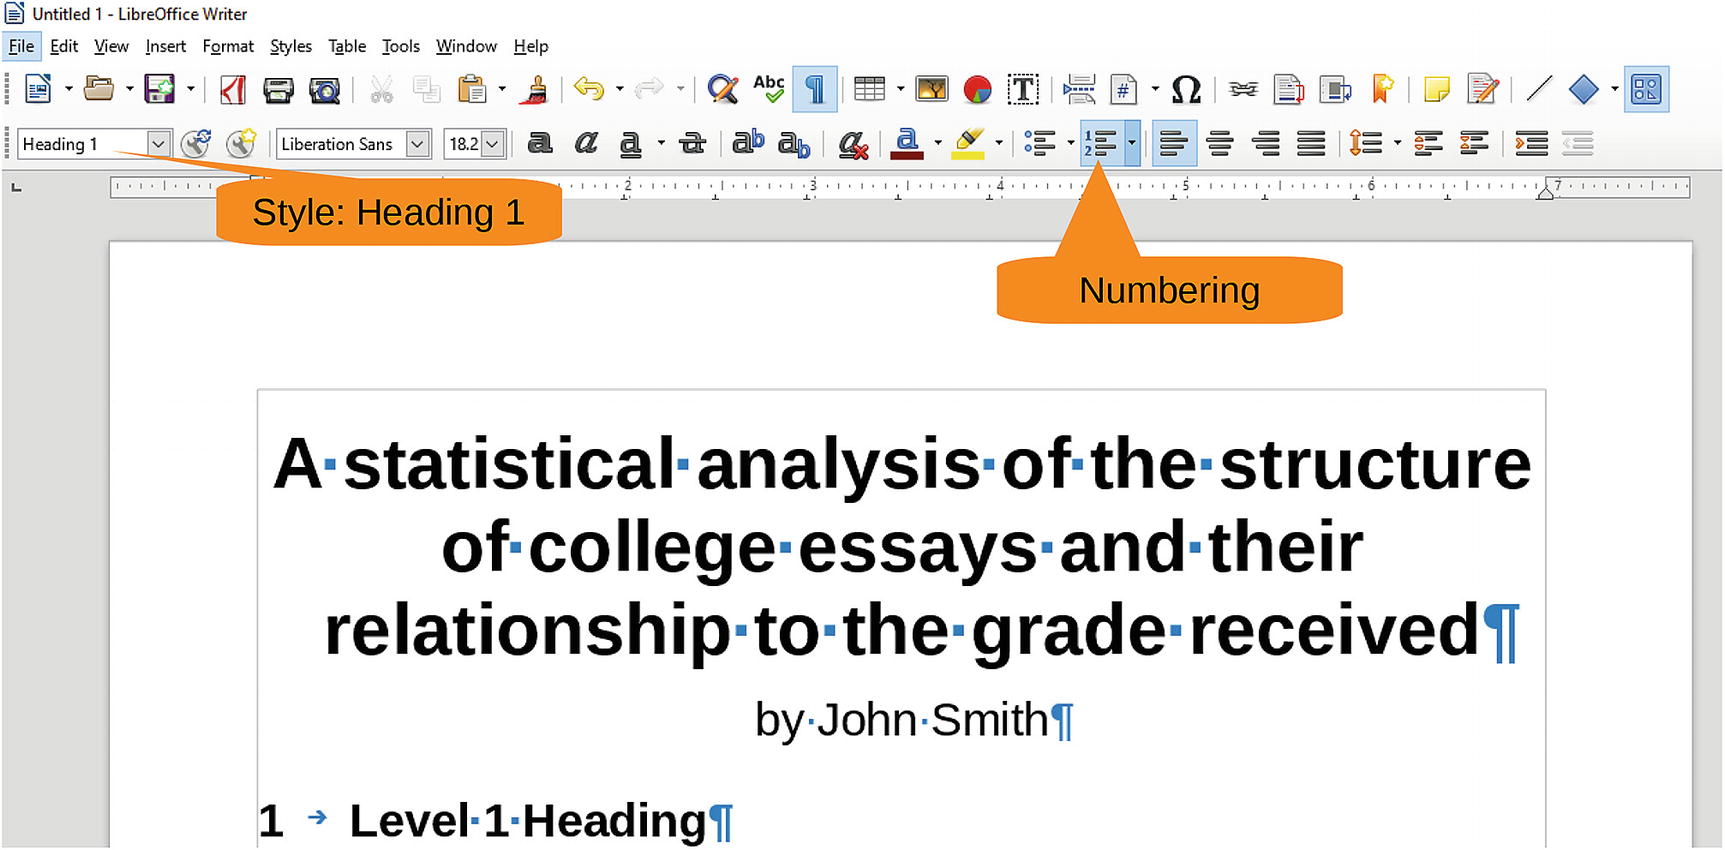
Figure 4-3 Heading 1 style
Let’s add a couple more headings. The first one is a Heading 2 paragraph, and the one after that is Heading 3. In Figure 4-4 you can see that LibreOffice has added structured numbers to the paragraphs.
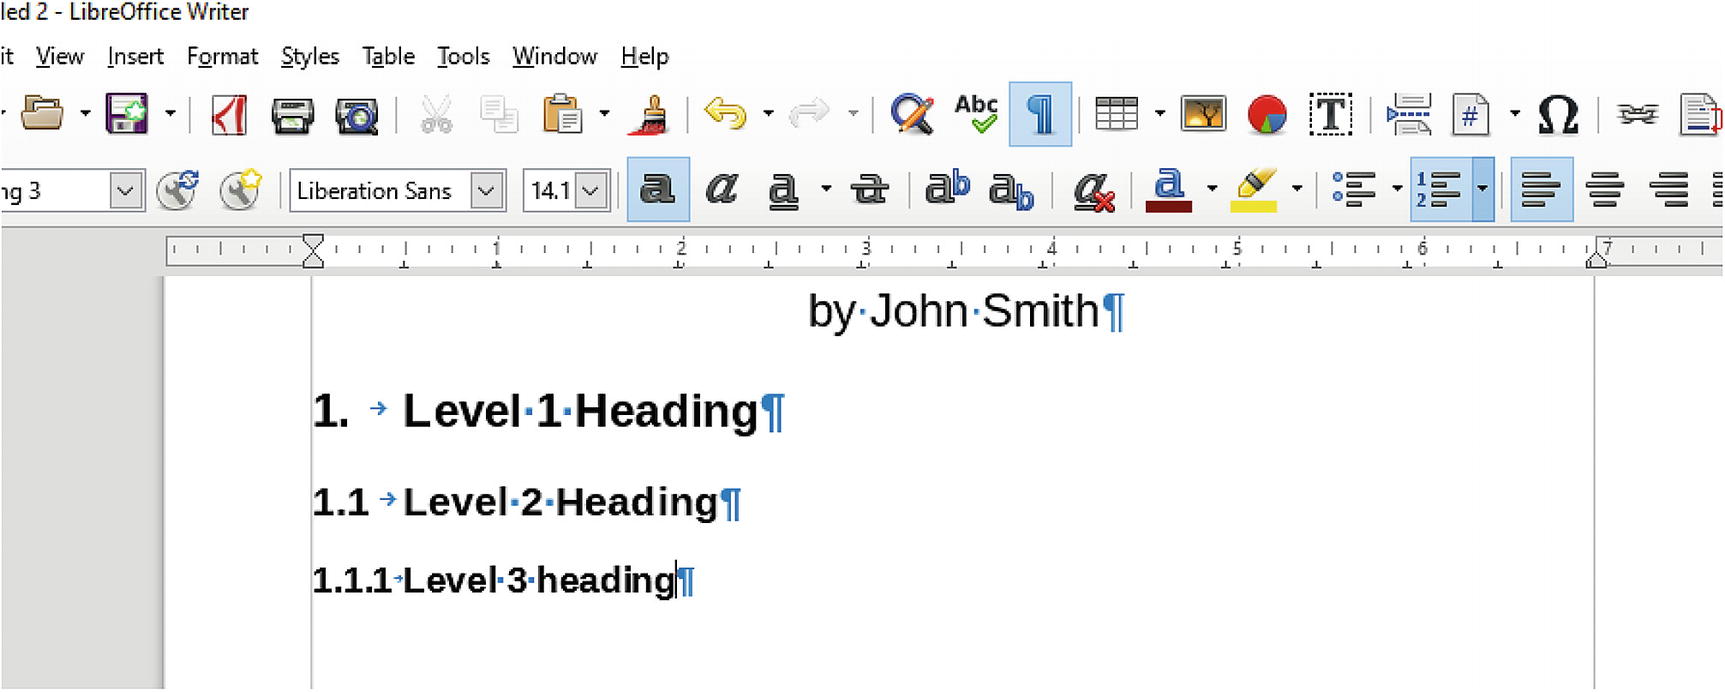
Figure 4-4 Structured numbers
Try as you might, you can’t make an essay entirely of headings. You’ll have to add some text. Let’s write a sentence or two under the first heading. So, type some text: This paper discusses the relationship between measurable structural elements of an essay and a student’s grade.
The report now looks like Figure 4-5.
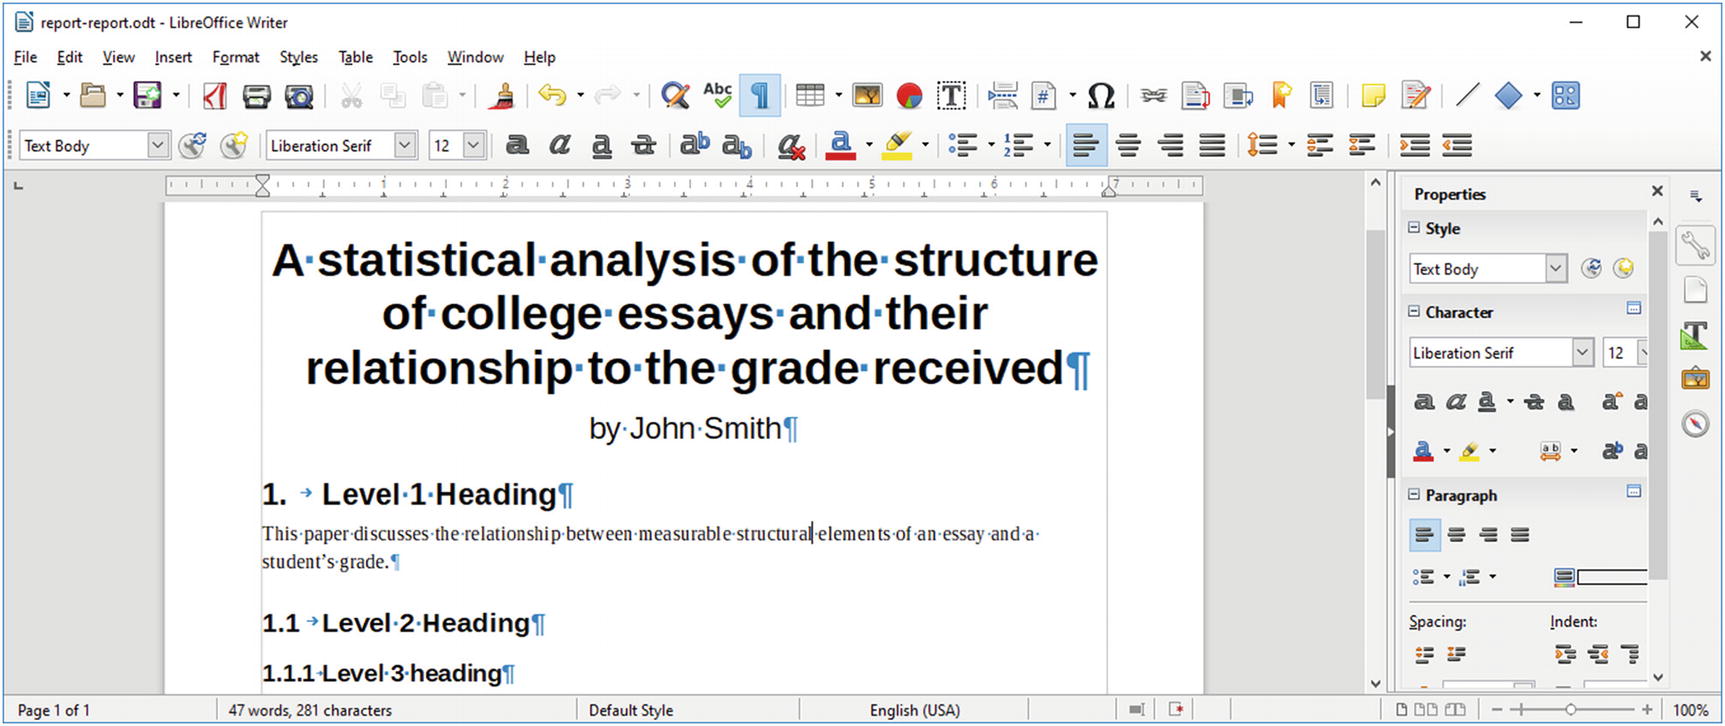
Figure 4-5 Report with paragraph added
Adding Footnotes
Professors like footnotes, so let’s add a footnote just after the word structural in the sentence you just typed. First move the cursor to just after the word and click after structural. Now select Insert ➤ Footnote or Endnote ➤ Footnote. You’ll notice that the cursor jumps to the bottom of the page and lets you type in your footnote. See Figures 4-6 and 4-7 for the results.

Figure 4-6 Inserting a footnote
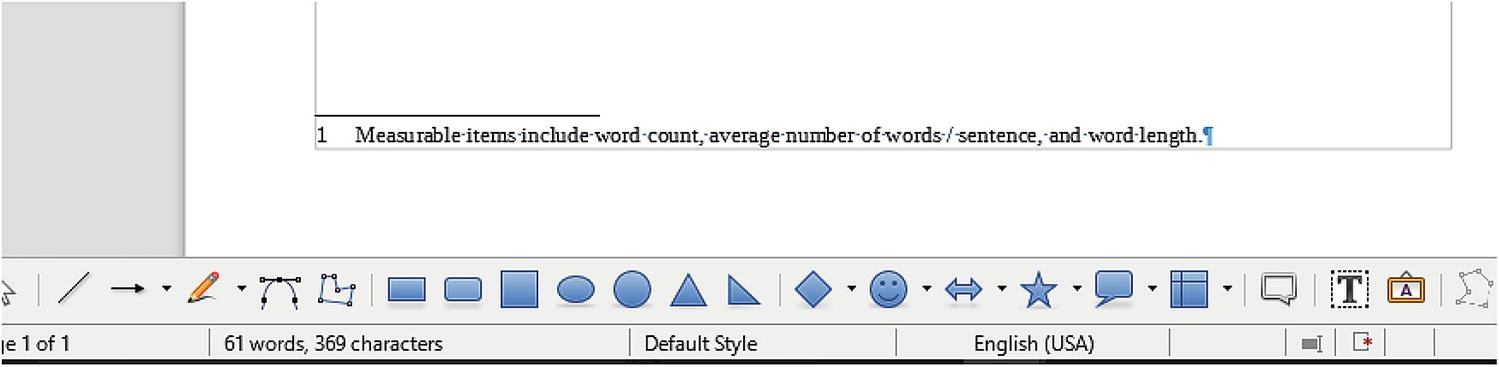
Figure 4-7 Footnote at the bottom of the page
Adding Quotes: Styles and Custom Styles
Since you are writing a college paper, you need a few quotes. Not only do professors like quotes, but they let you reach your page count without having to write your own material. (To save time and effort, we will make up our own.)
According to the style guide supplied by the teacher, “Quotation paragraphs should be indented half an inch from the regular text on both the left and right sides. Text should appear in italics.”
When you look through your list of styles, you won’t see one labeled Quote. Selecting More Styles brings up the Styles and Formatting panel, as shown in Figure 4-8.
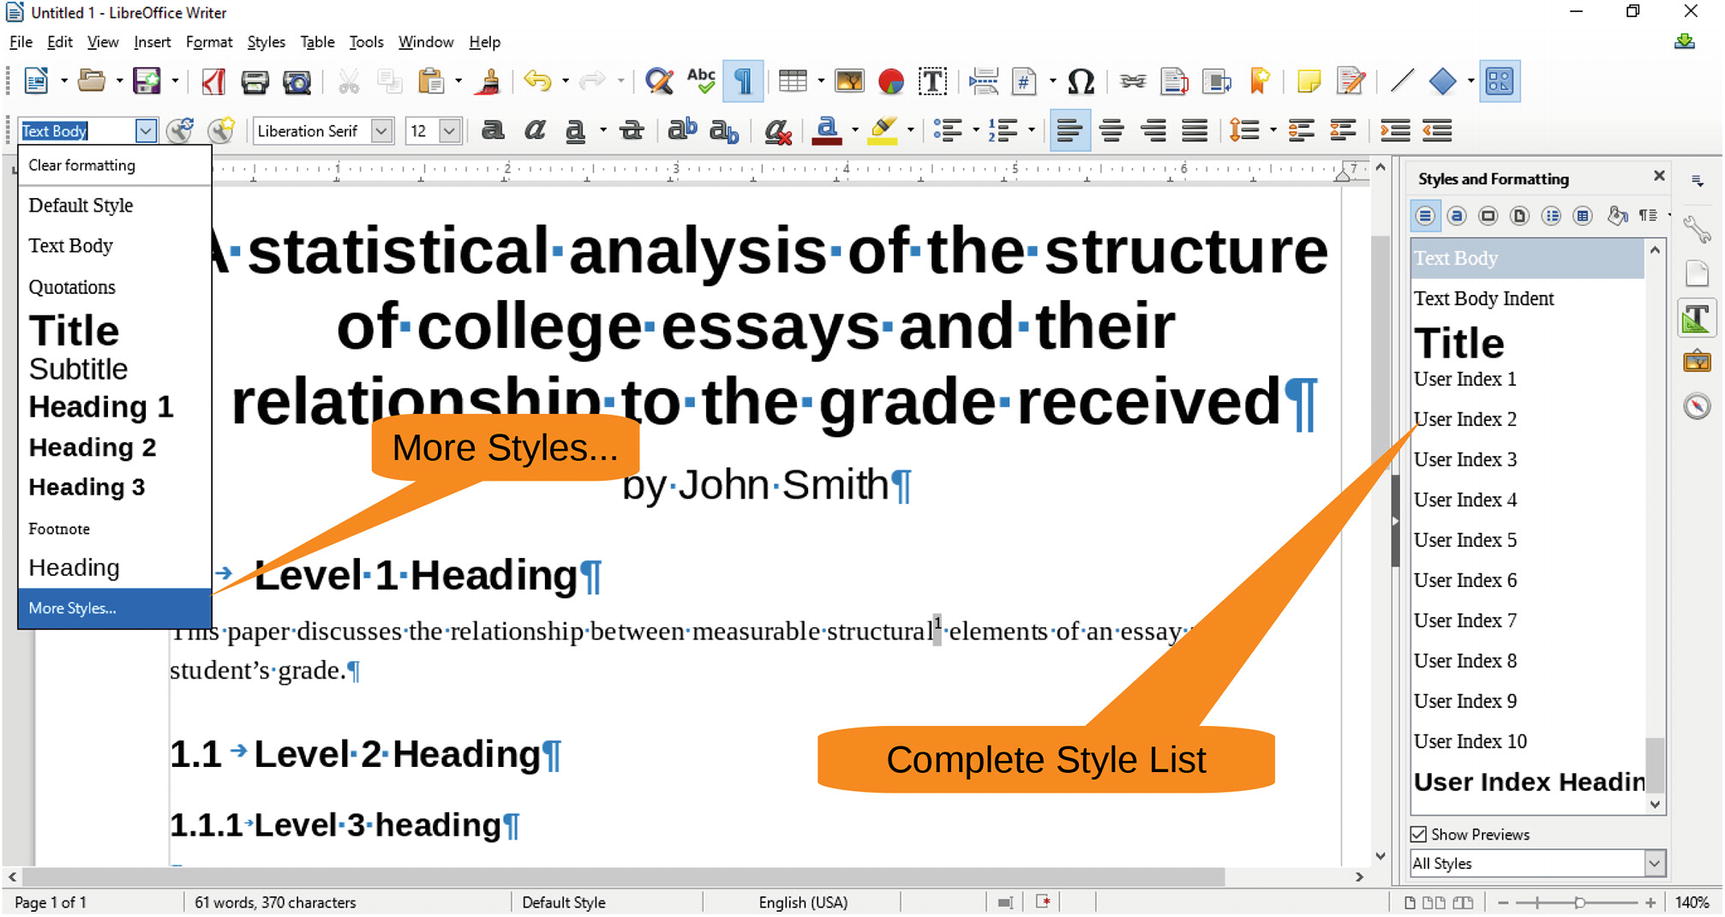
Figure 4-8 More Styles option
There is one labeled Quotations, but that indents the wrong amount and uses the wrong font. So, you’ll have to make a quote style yourself.
Click the Properties icon (the wrench) to open the Properties panel. Then move the margins in 0.50" (on both sides) and make the font italic. Figure 4-9 shows you where the controls are.
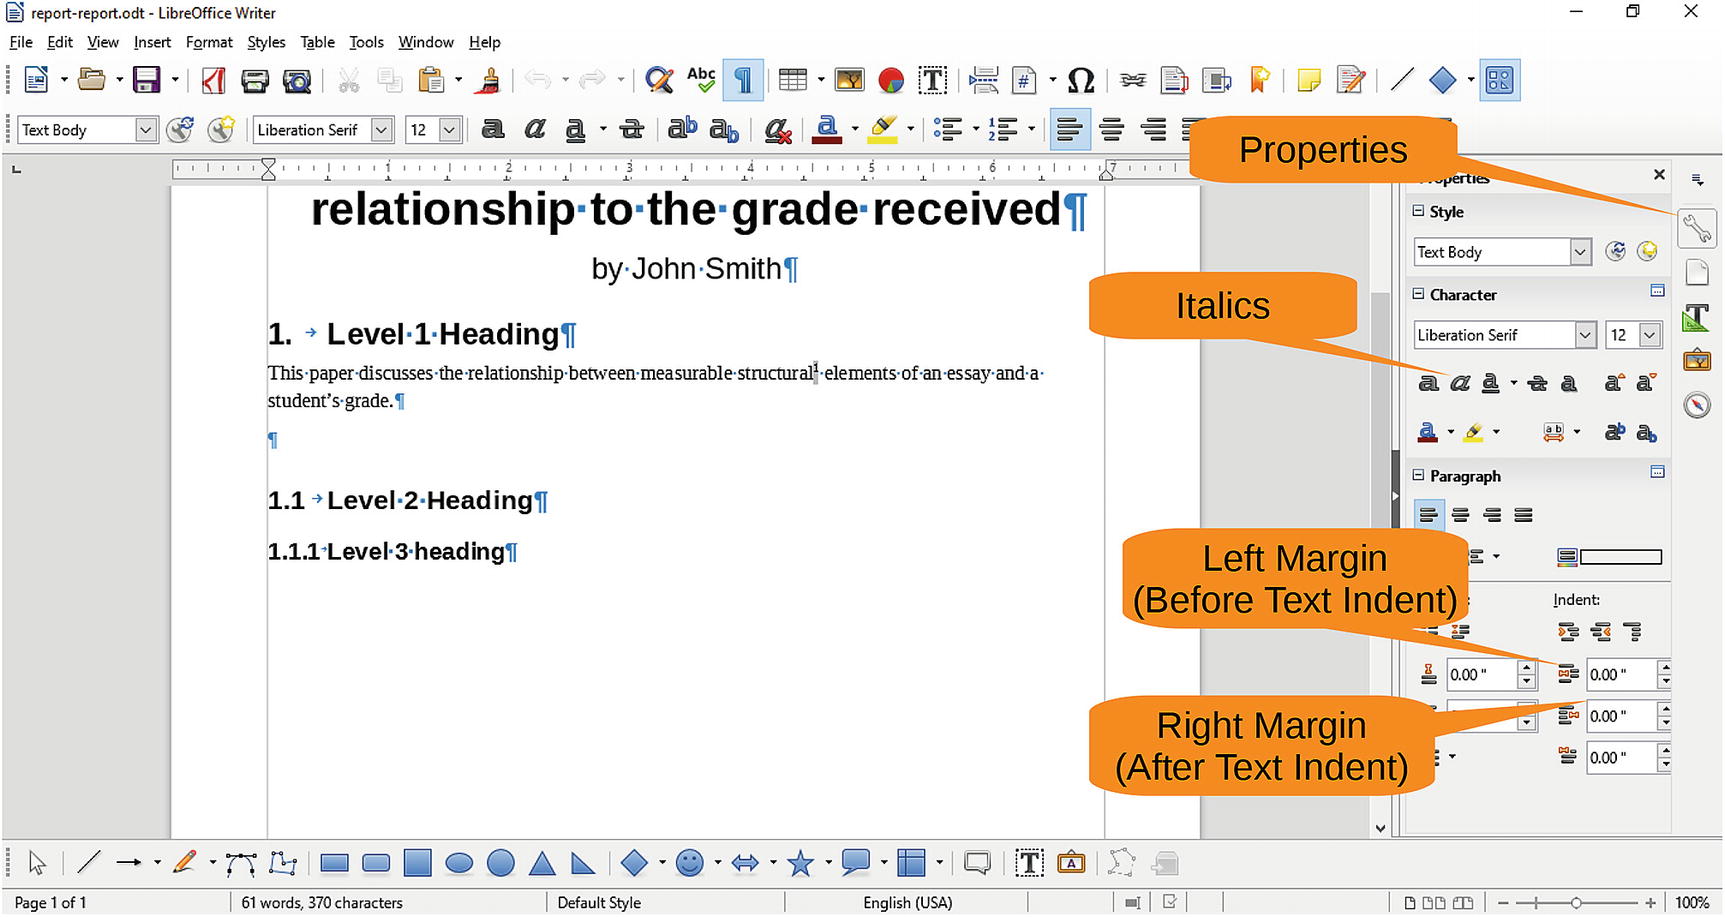
Figure 4-9 Adjusting the paragraph and font
Now click the New Style icon and give your new style the name Quote. Figure 4-10 shows this process.
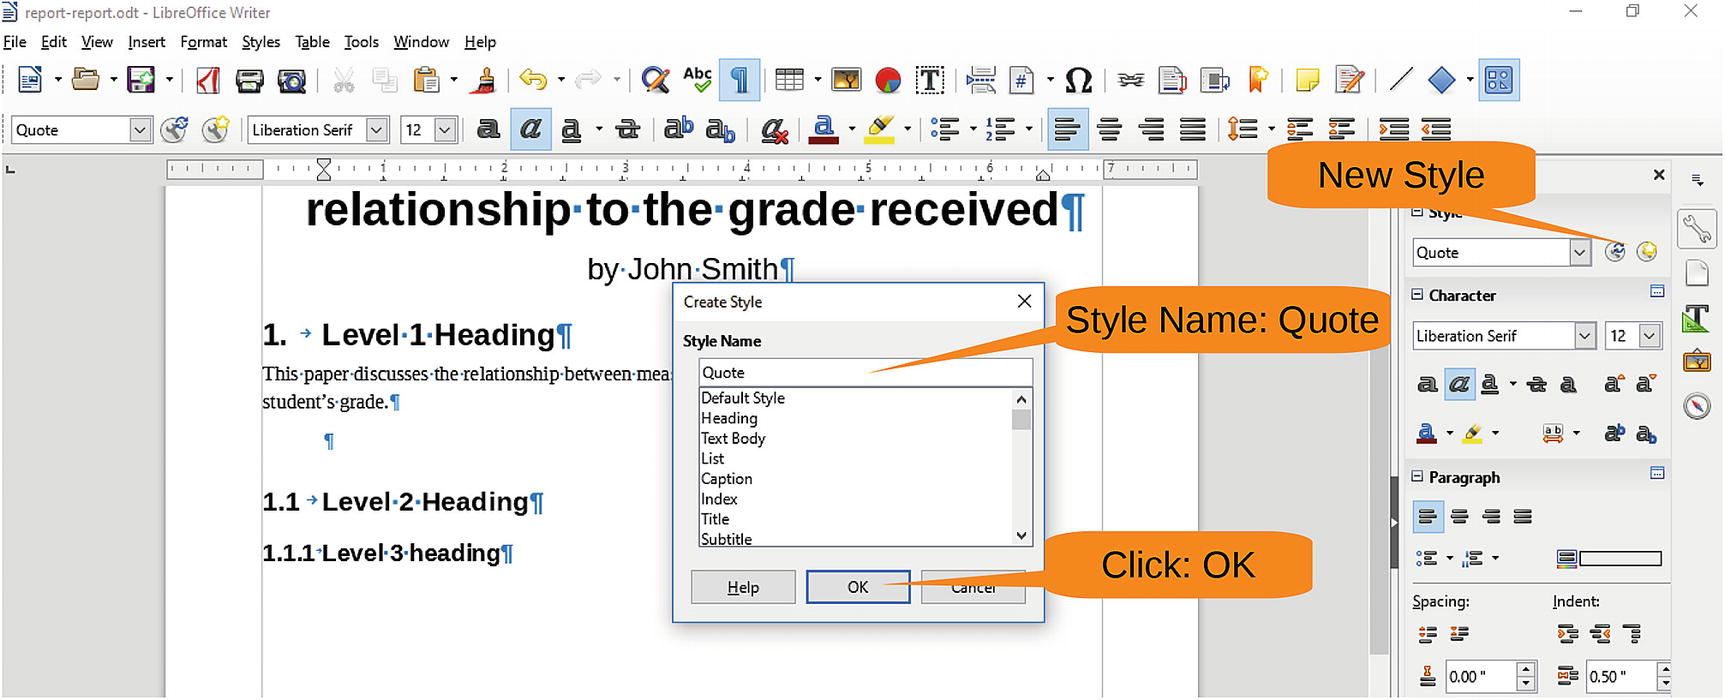
Figure 4-10 New style
Now you can type in the quote:
Quotes are the key to writing an authoritative sounding paper. If other people reinforce your ideas then it makes it sound like you know what you are talking about.
After entering the quote, you need an attribution line. Type Steve Oualline for the attribution and then click the Align Right icon to move the text to the right. Then click New Style and enter the name Quote Who. Figure 4-11 illustrates the basic steps.
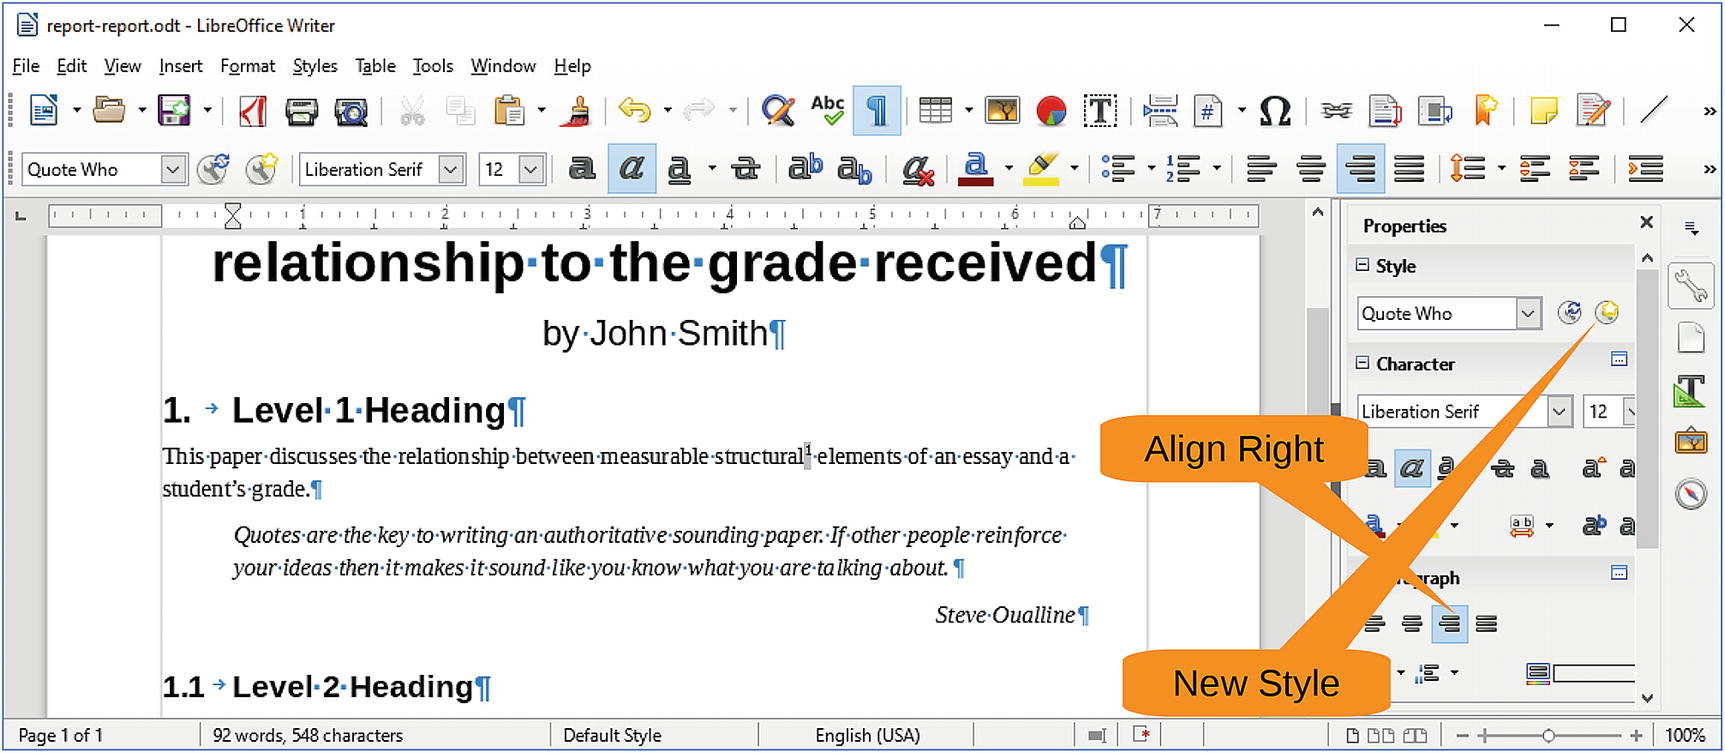
Figure 4-11 Creating the Quote Who style
By default, the next paragraph after a Quote Who paragraph is a Quote Who paragraph. Instead, you want it to be the Text Body style. Select Format ➤ Styles or press F11 to bring up the Style list. Locate the Quote Who style, right-click, and select Modify . Figure 4-12 shows the significant steps.
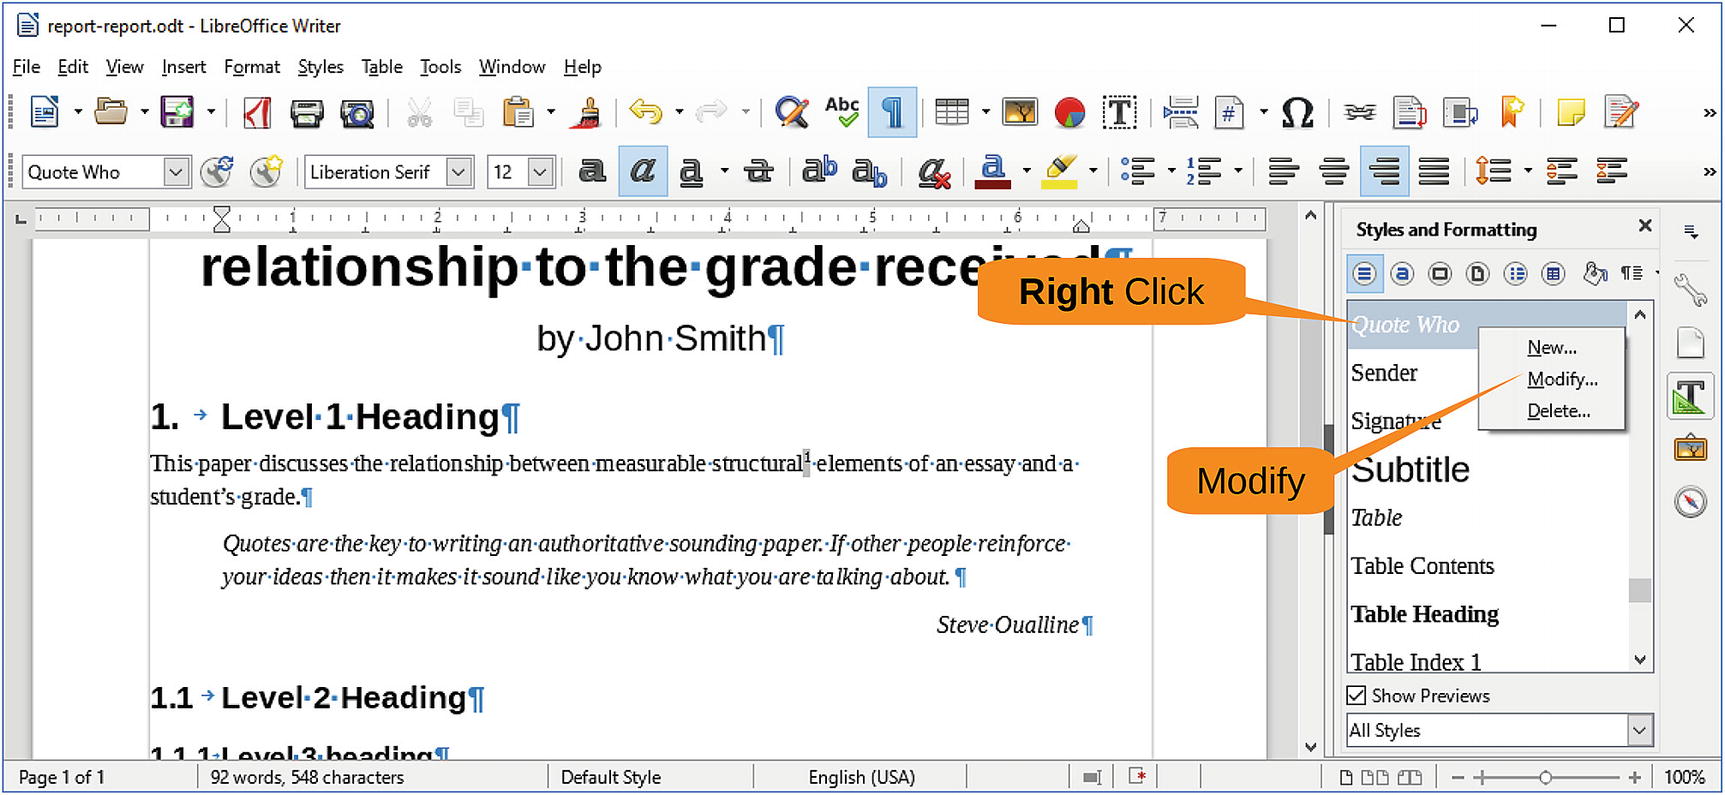
Figure 4-12 Modifying the style
The style modification dialog will appear. Click the Organizer tab. Then use the “Next style” pull-down to select Text Body (the default text format), as shown in Figure 4-13.
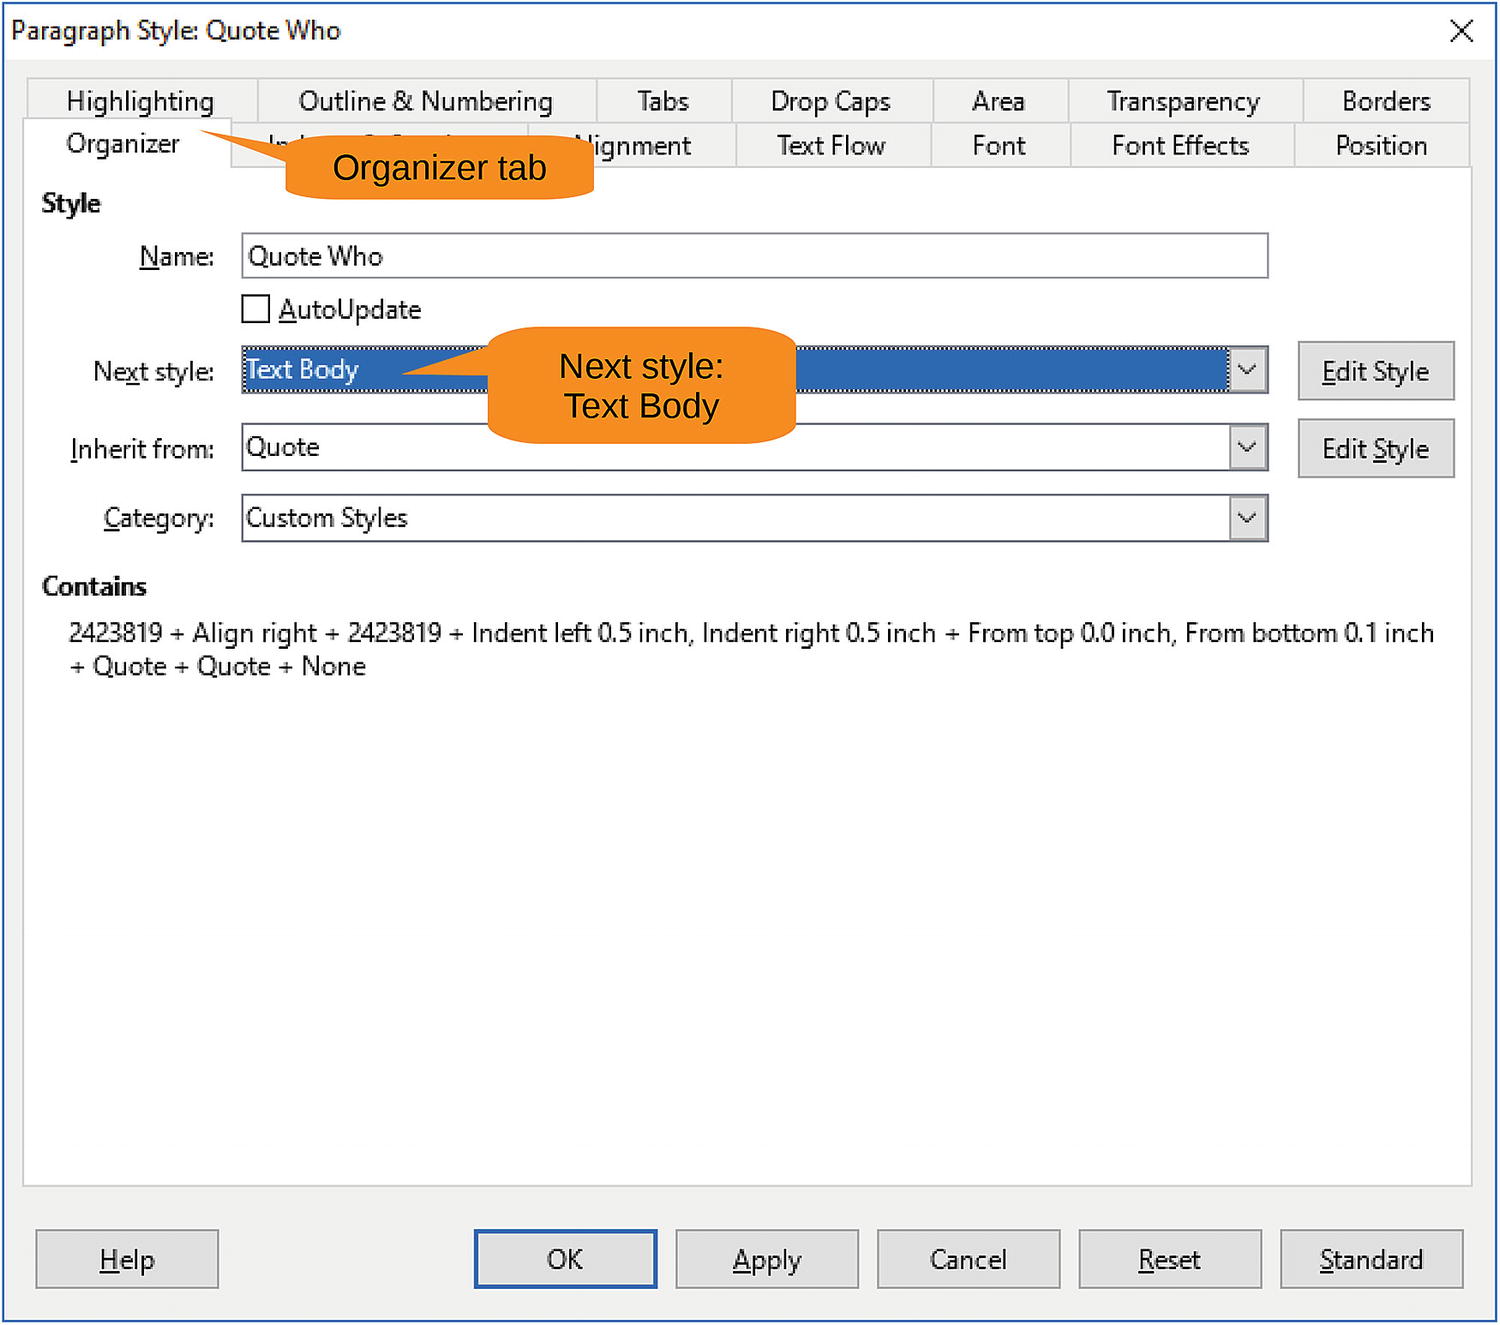
Figure 4-13 Style modification
Click OK to save your changes. Now when you press Enter after the Quote Who paragraph, the paragraph style will change to Text Body.
Adding End Notes
The quote needs a bibliography entry. That means an end note. Place the cursor just after the attribution, at the end of the line, and select Insert ➤ Footnote and Endnote ➤ Endnote. Figure 4-14 shows the operation.
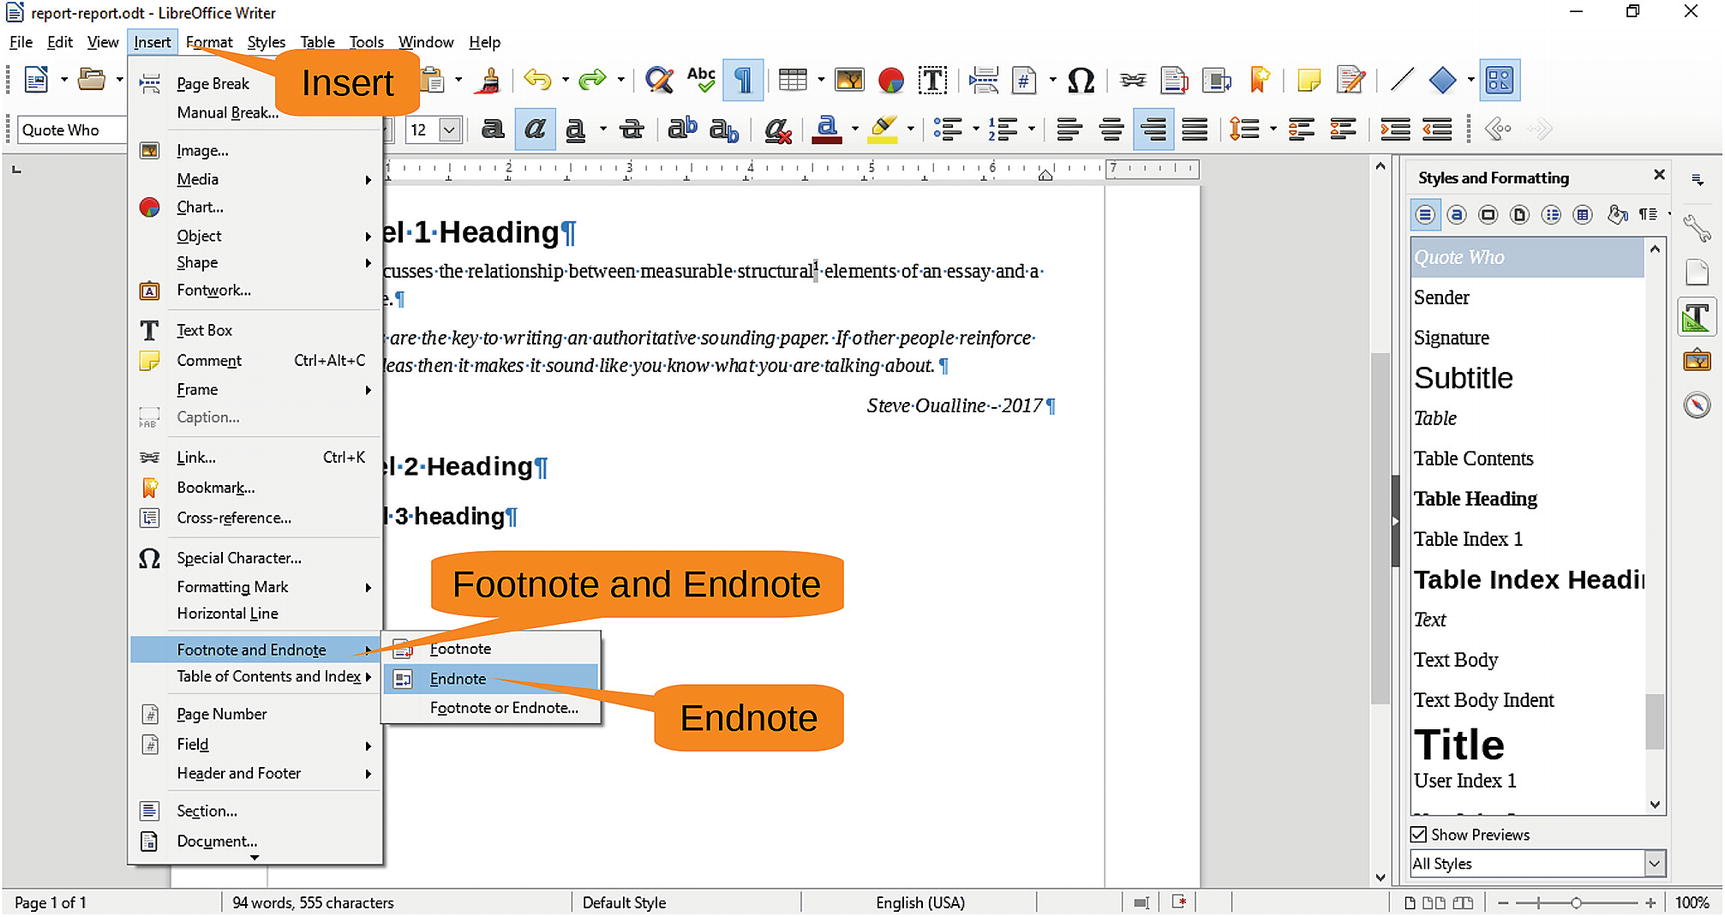
Figure 4-14 Inserting an end note
The end note marker is inserted, and you are taken to the end of the document where you can enter your end note, as shown in Figure 4-15.
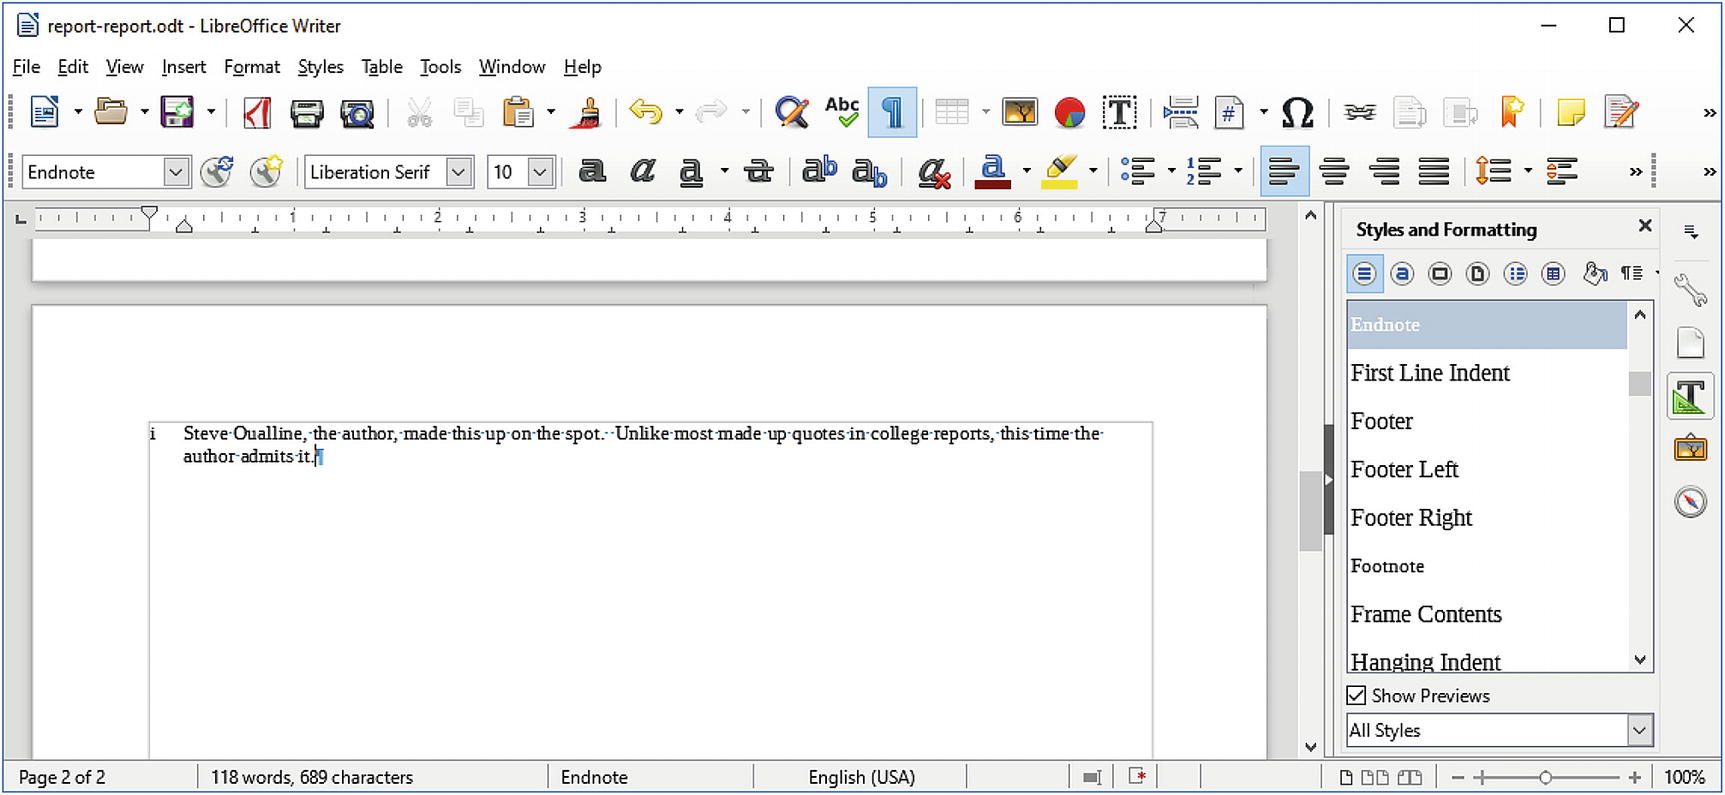
Figure 4-15 Entering the end note
Formatting Footnotes and Endnotes
You may have noticed that footnotes are numbered 1, 2, 3, …, and endnotes are numbered 1, 2, 3, …. This may lead to some confusion because you have a footnote numbered 1 and an endnote numbered 1 on the same page. You need to change the numbering of one of these items.
The Format menu item contains commands that format just about everything except footnotes and endnotes. To format them, you need to select Tools ➤ Footnotes and Endnotes, as shown in Figure 4-16.
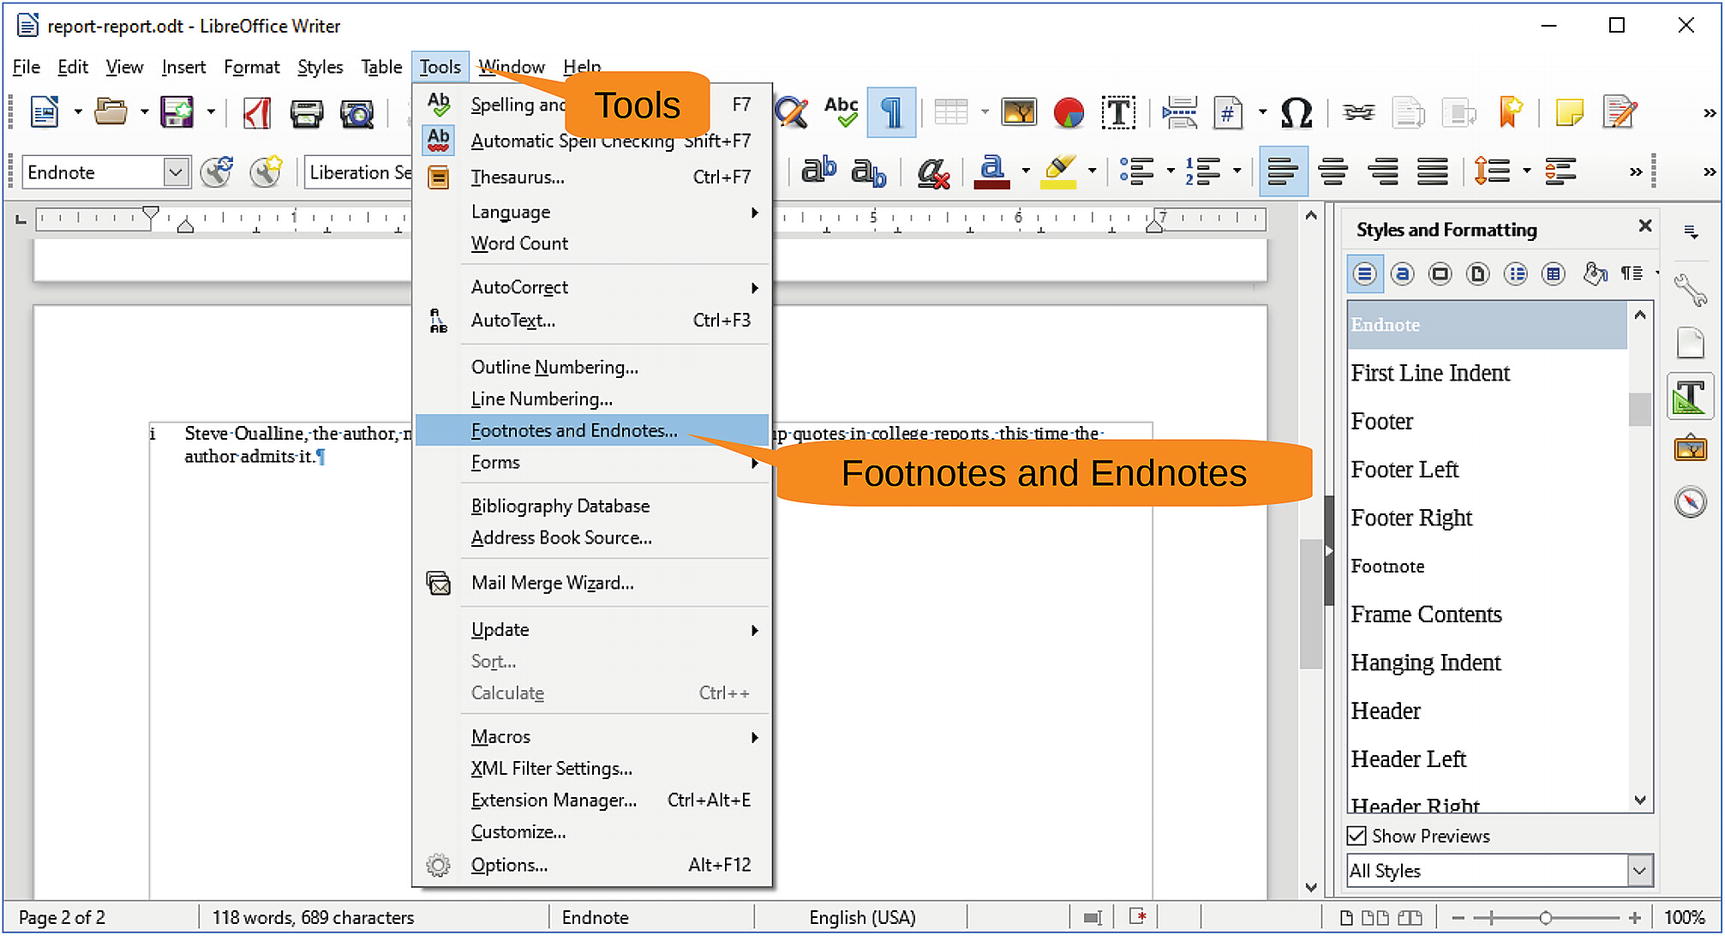
Figure 4-16 Footnotes and Endnotes menu item
This brings up a dialog that allows you to modify the way footnotes work. Click the Footnotes tab and then change Numbering to “a, b, c, …” and change Counting to “Per page,” as demonstrated by Figure 4-17. Finally, click OK.
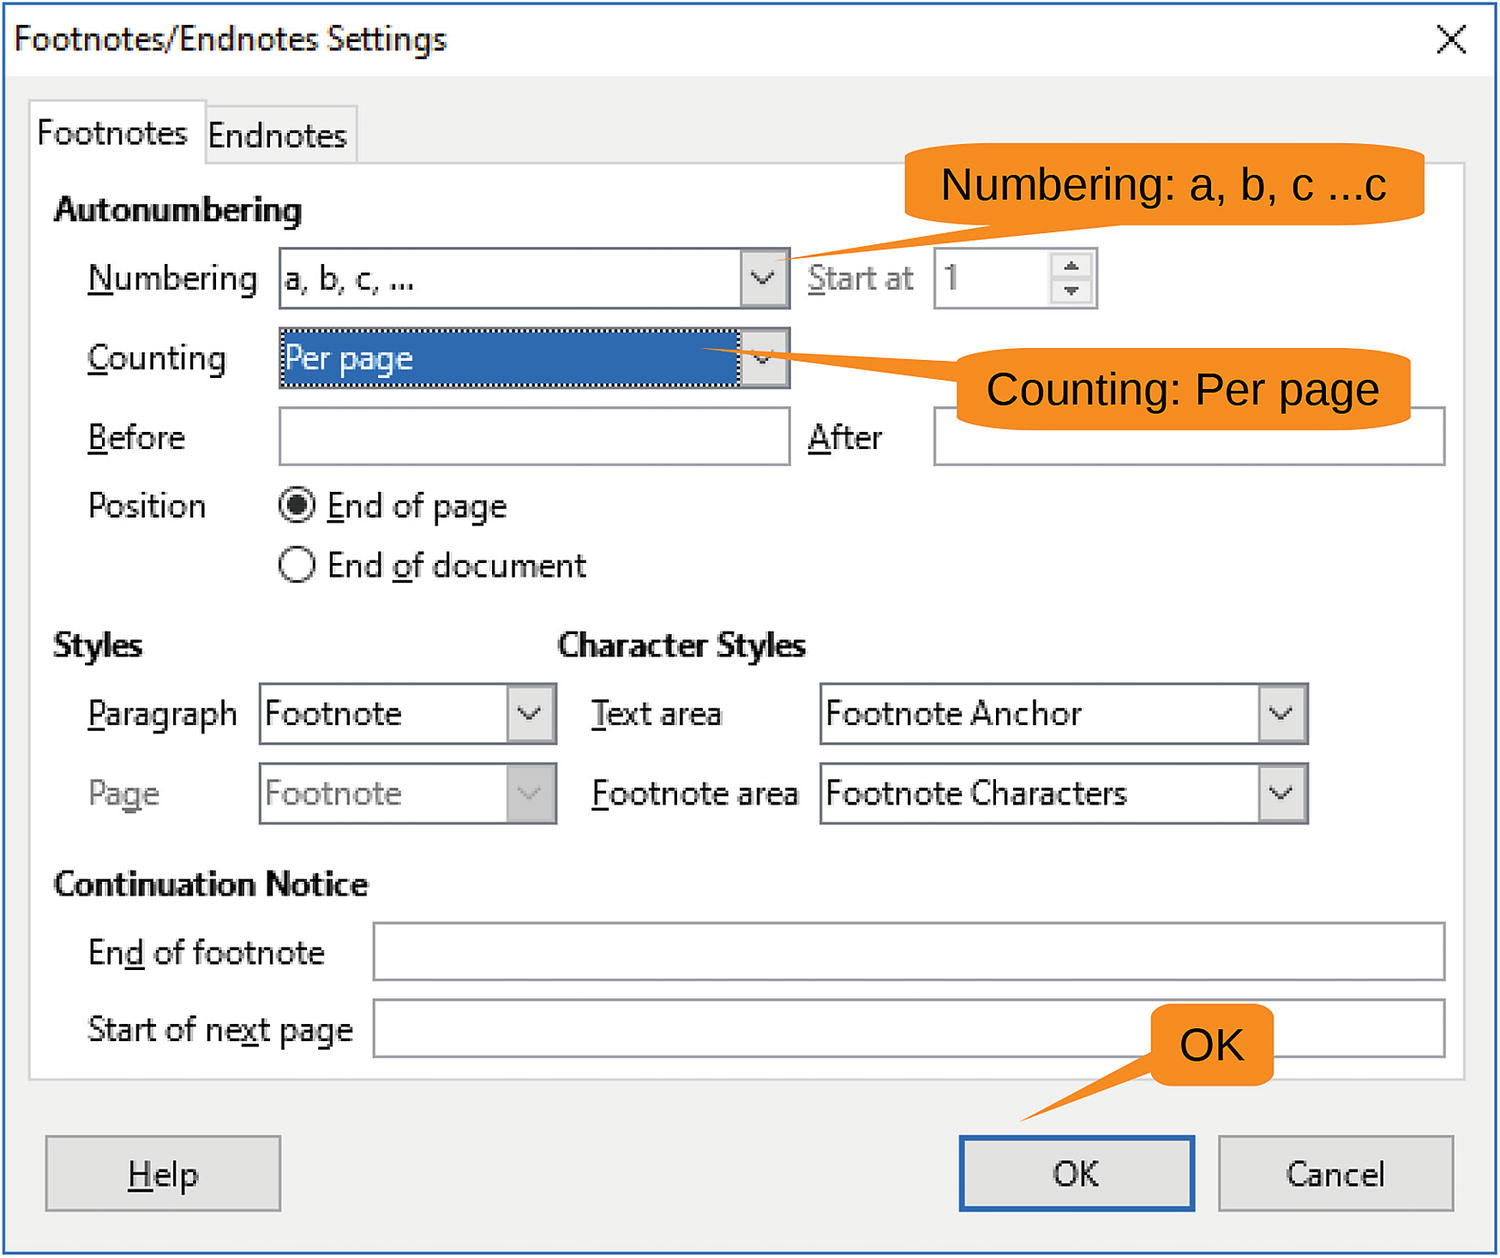
Figure 4-17 Footnotes/Endnotes Settings dialog
Now the footnotes and endnotes look different. And everyone can tell it’s a great paper because you’ve got them both.
Adding Tables
Any good report should have a few tables. They are nice ways of presenting a lot of data in an organized format. They stand out in a report and tell your professor “Hey, this guy has got a lot of data,” whether your data is useful or not.
To create a table, select Table ➤ Insert Table, as shown in Figure 4-18.
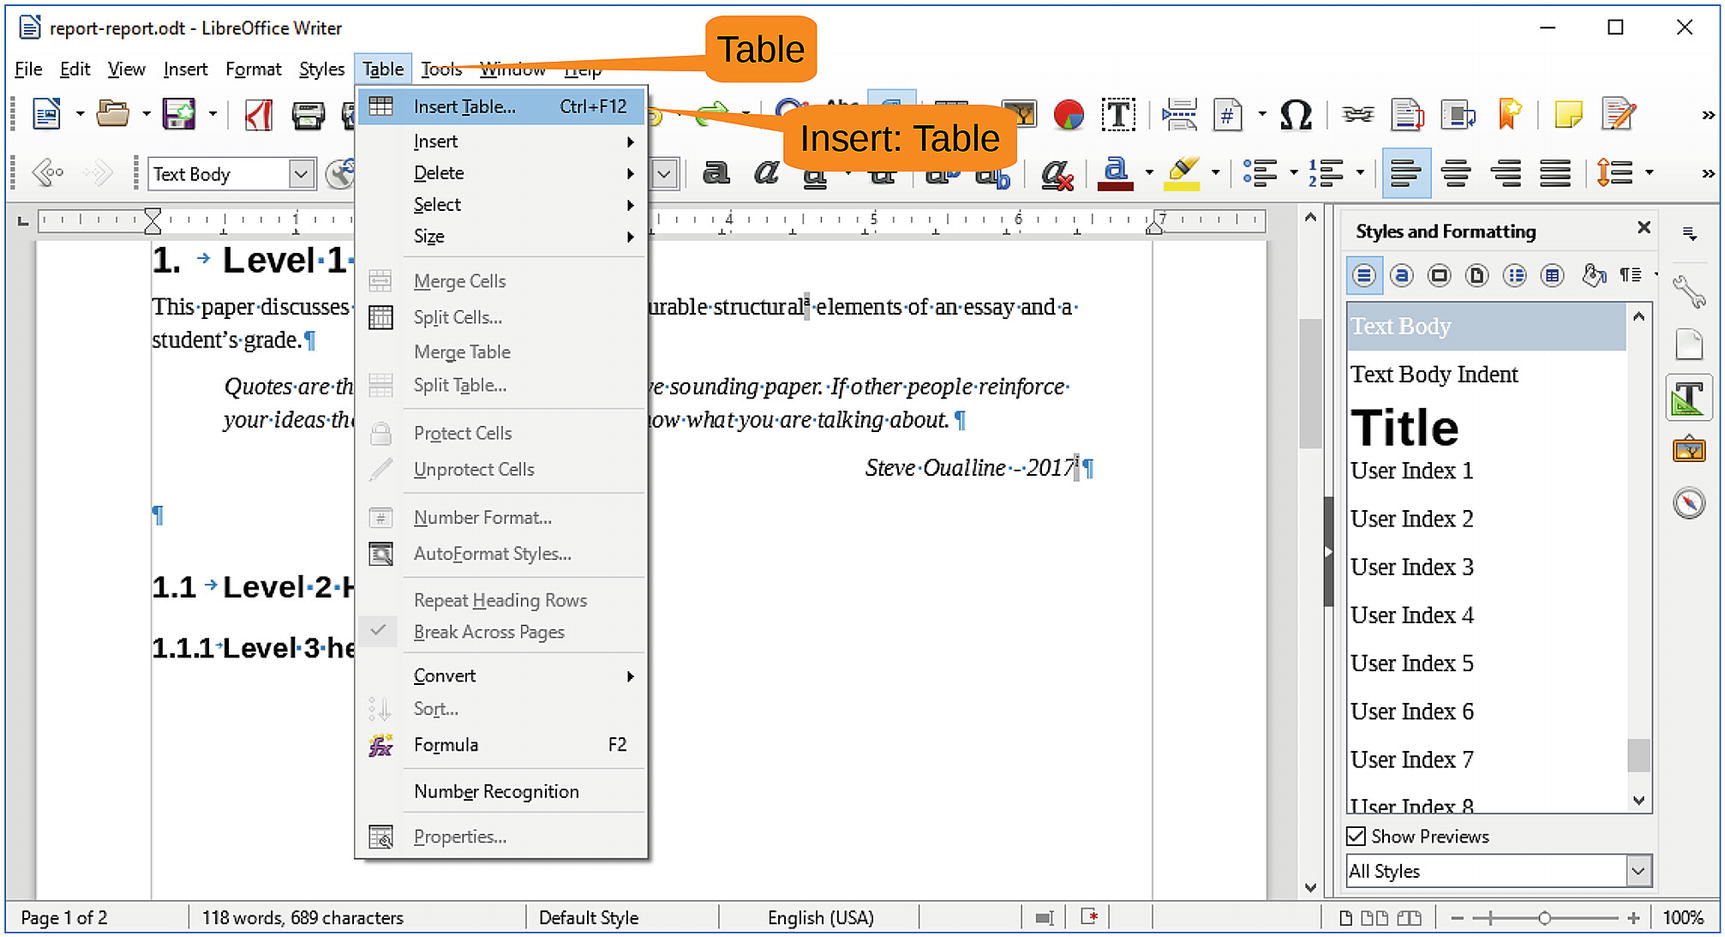
Figure 4-18 Inserting a table
The Insert Table dialog appears. Let’s leave the defaults as they are. Specifically, you want to create a table with two rows and two columns. (You can adjust this later.) Click the Insert button to create the table, as shown in Figure 4-19.
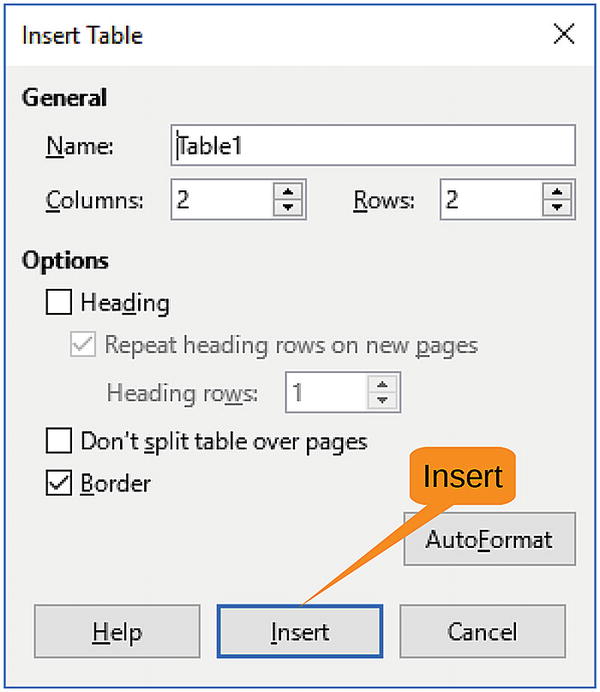
Figure 4-19 Inserting a table
Now let’s enter some data . Specifically, type the following and press Tab (not Enter) after each line:
Length<tab>
Grade<tab>
24<tab>
A+
Note that after each Tab, you go to the next cell in the table. Figure 4-20 displays the results.
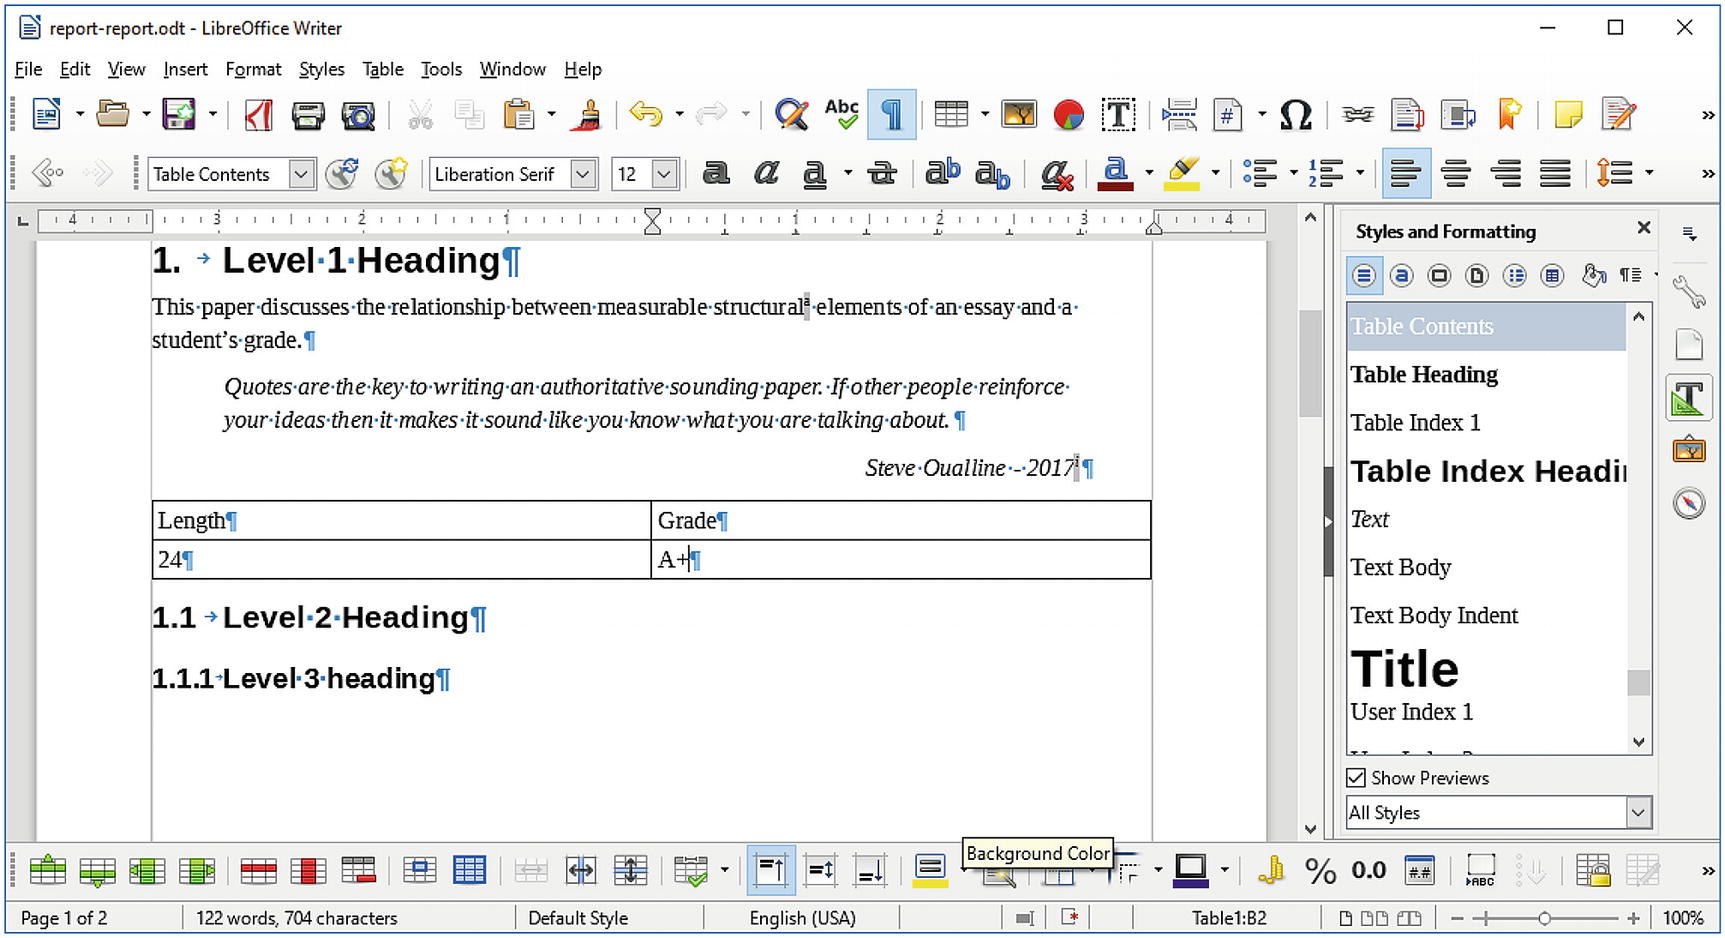
Figure 4-20 Table entry
Now let’s press Tab again. A new row opens. Continue to enter data until the table looks like this:
Length | Grade |
24 | A+ |
19 | A |
18 | B |
16 | C |
9 | F |
The problem with this table is that you have a lot of white space. Let’s fix that. First select the table by clicking Table ➤ Select ➤ Table, as demonstrated in Figure 4-21.
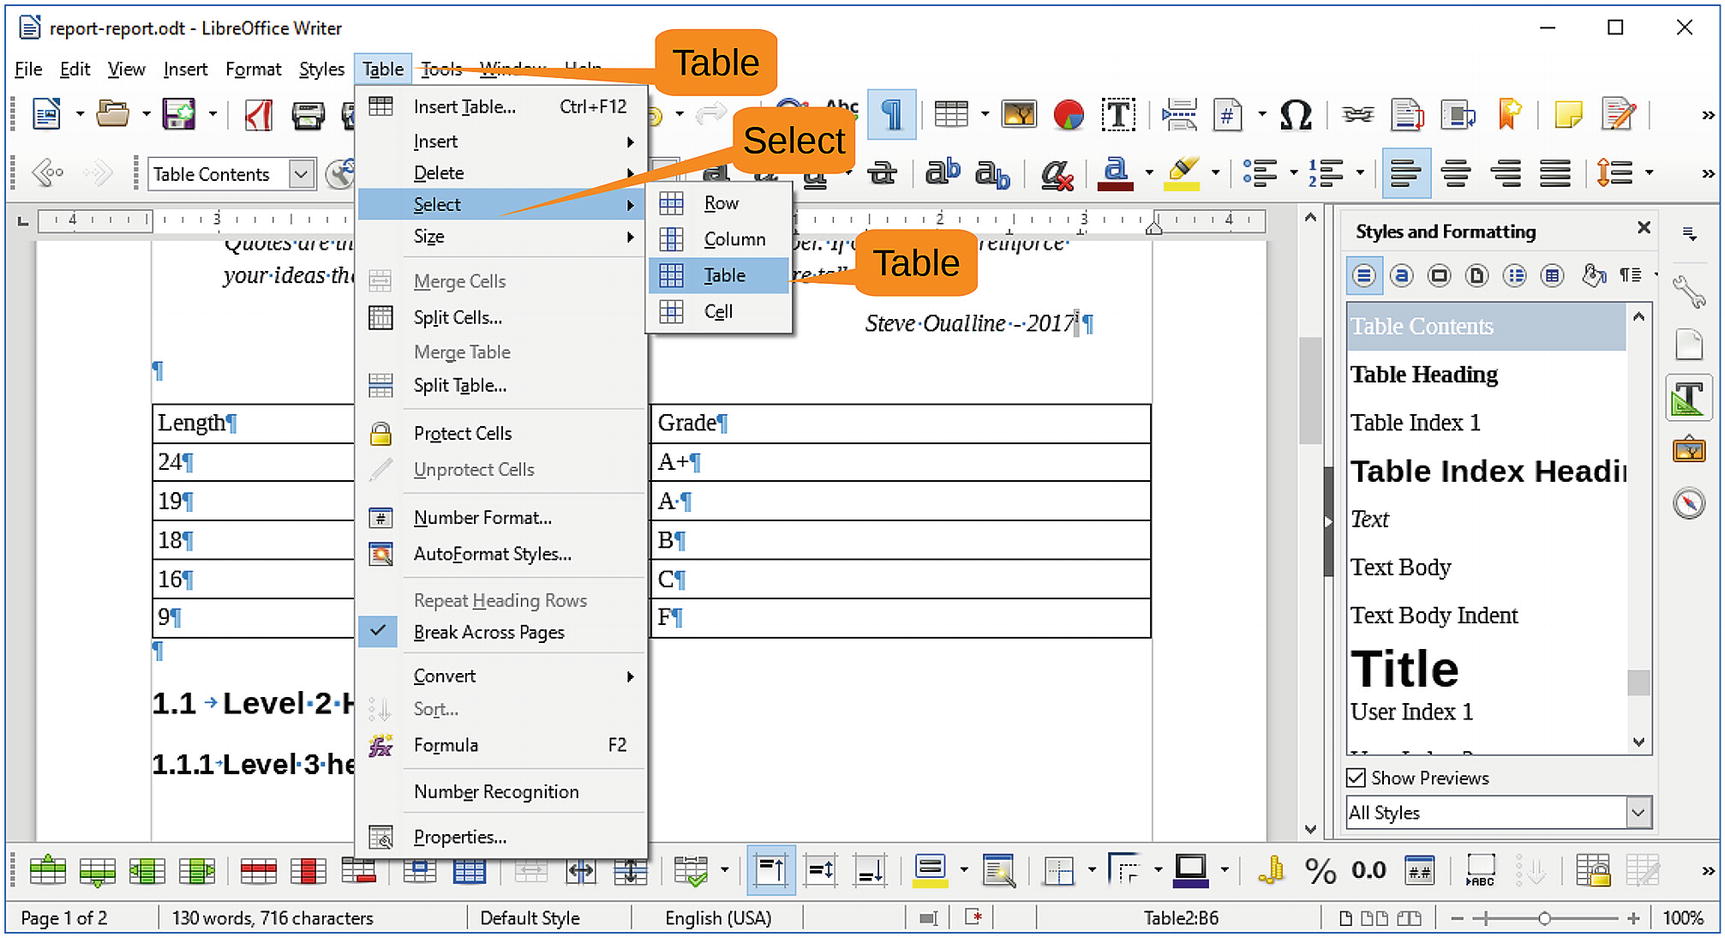
Figure 4-21 Selecting a table
Now let’s adjust the column size with Table ➤ Size ➤ Optimal Column Width, as shown in Figure 4-22.
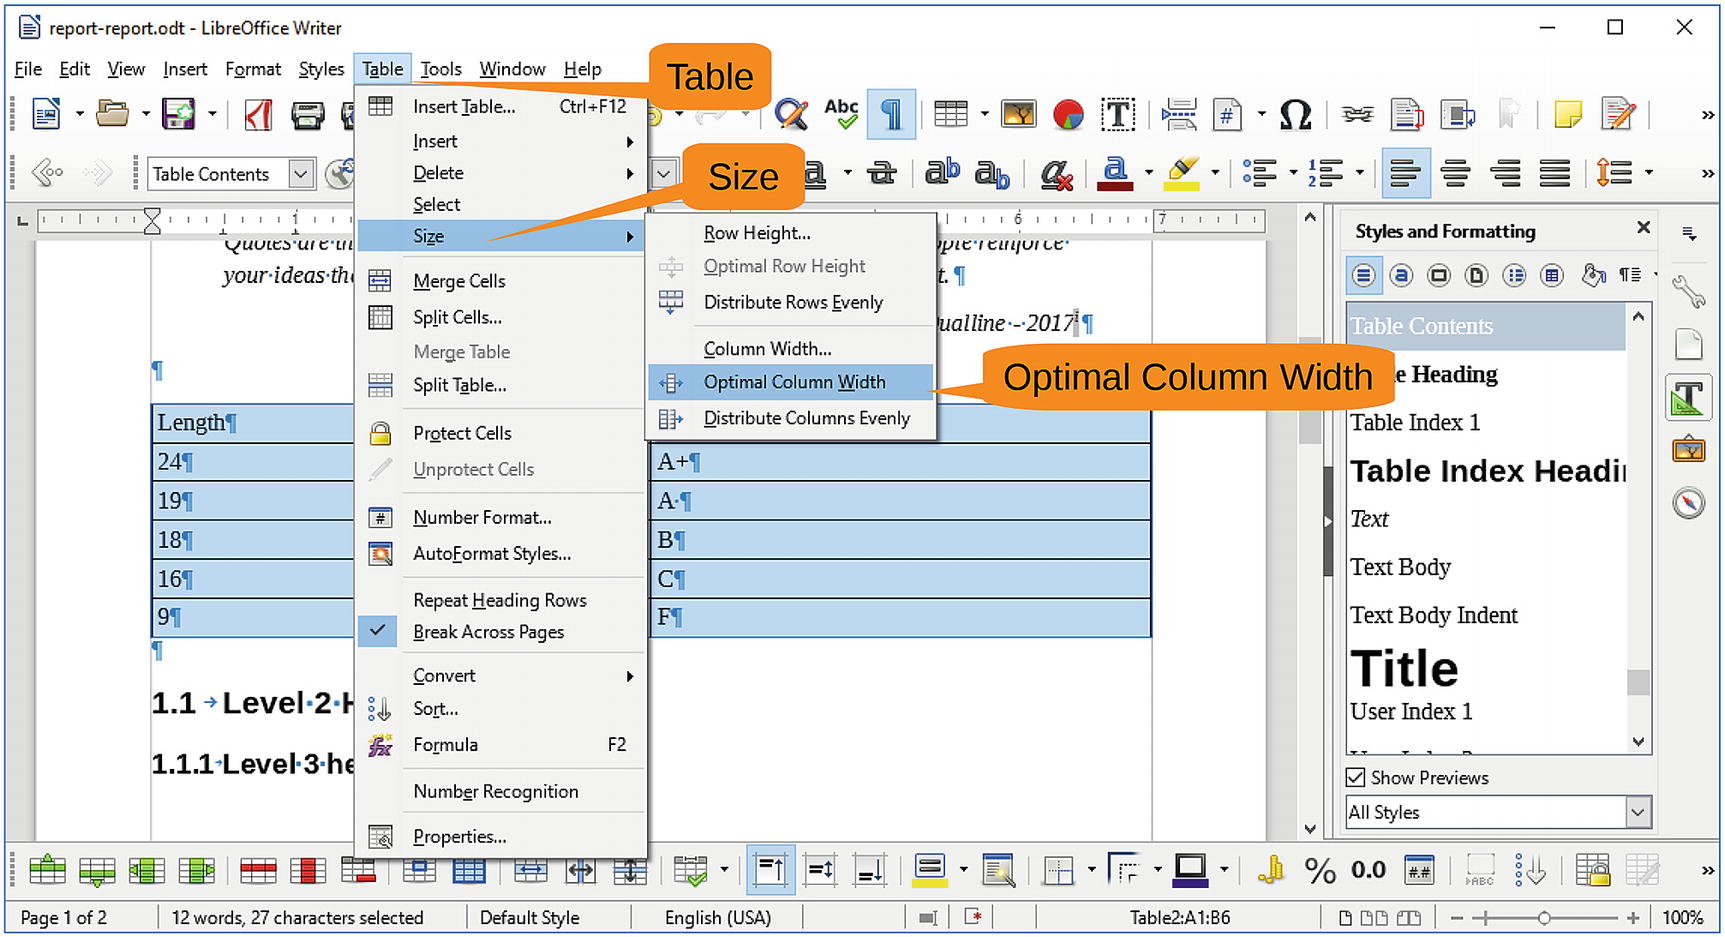
Figure 4-22 Adjusting the column size
The result is a much nicer-looking table (Figure 4-23).
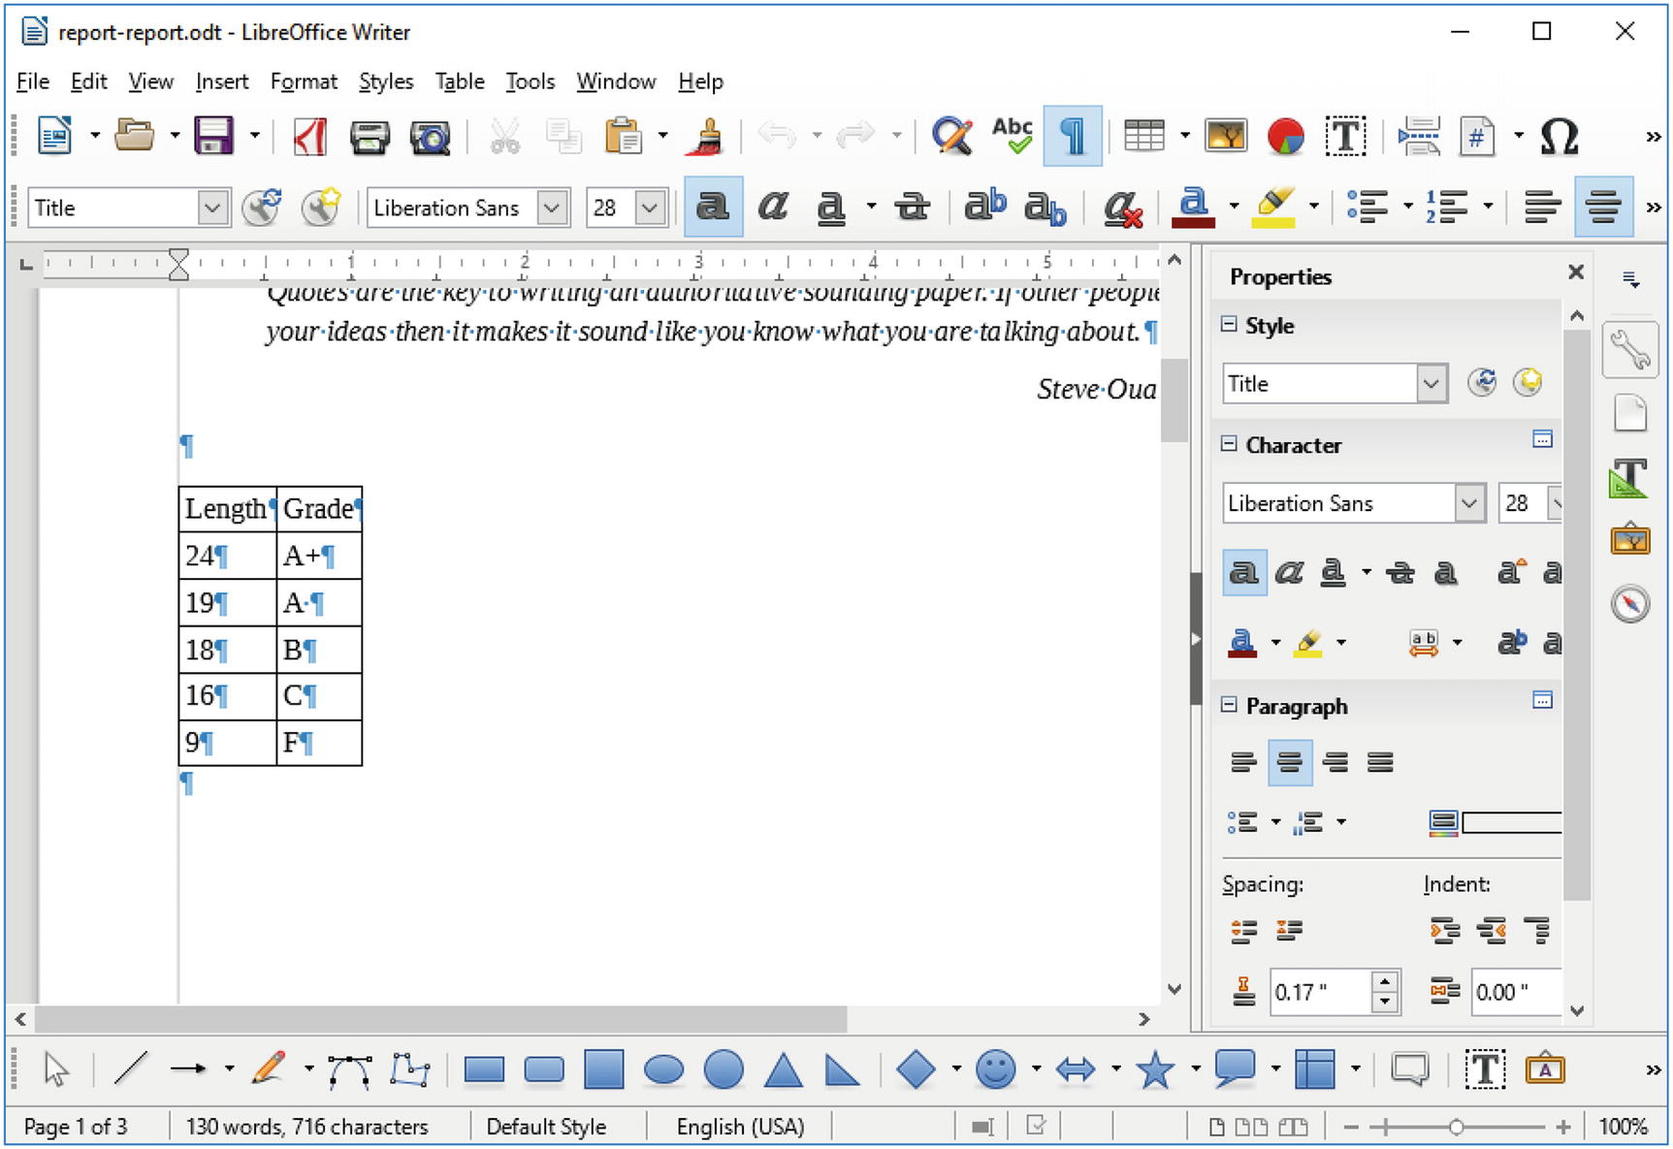
Figure 4-23 Nice table
Inserting Graphics
Pictures are nice in reports because humans are graphical animals and respond to pictures better than words. Besides, graphics are an easy way of increasing the page count without having to write anything.
Let’s start by adding a cute picture of a kitten to the paper. We’re not sure how this fits into the theme of the subject, but a cute kitten can’t hurt, so take a look at the one in Figure 4-24 that we’ve added to the report.
To insert a figure into the report, copy it to the clipboard, click where you want the picture to be, and select Edit ➤ Paste. Then click the picture to select it, right-click, and select Anchor ➤ As Character. We covered this in Chapter 2 if you need a more visual explanation.
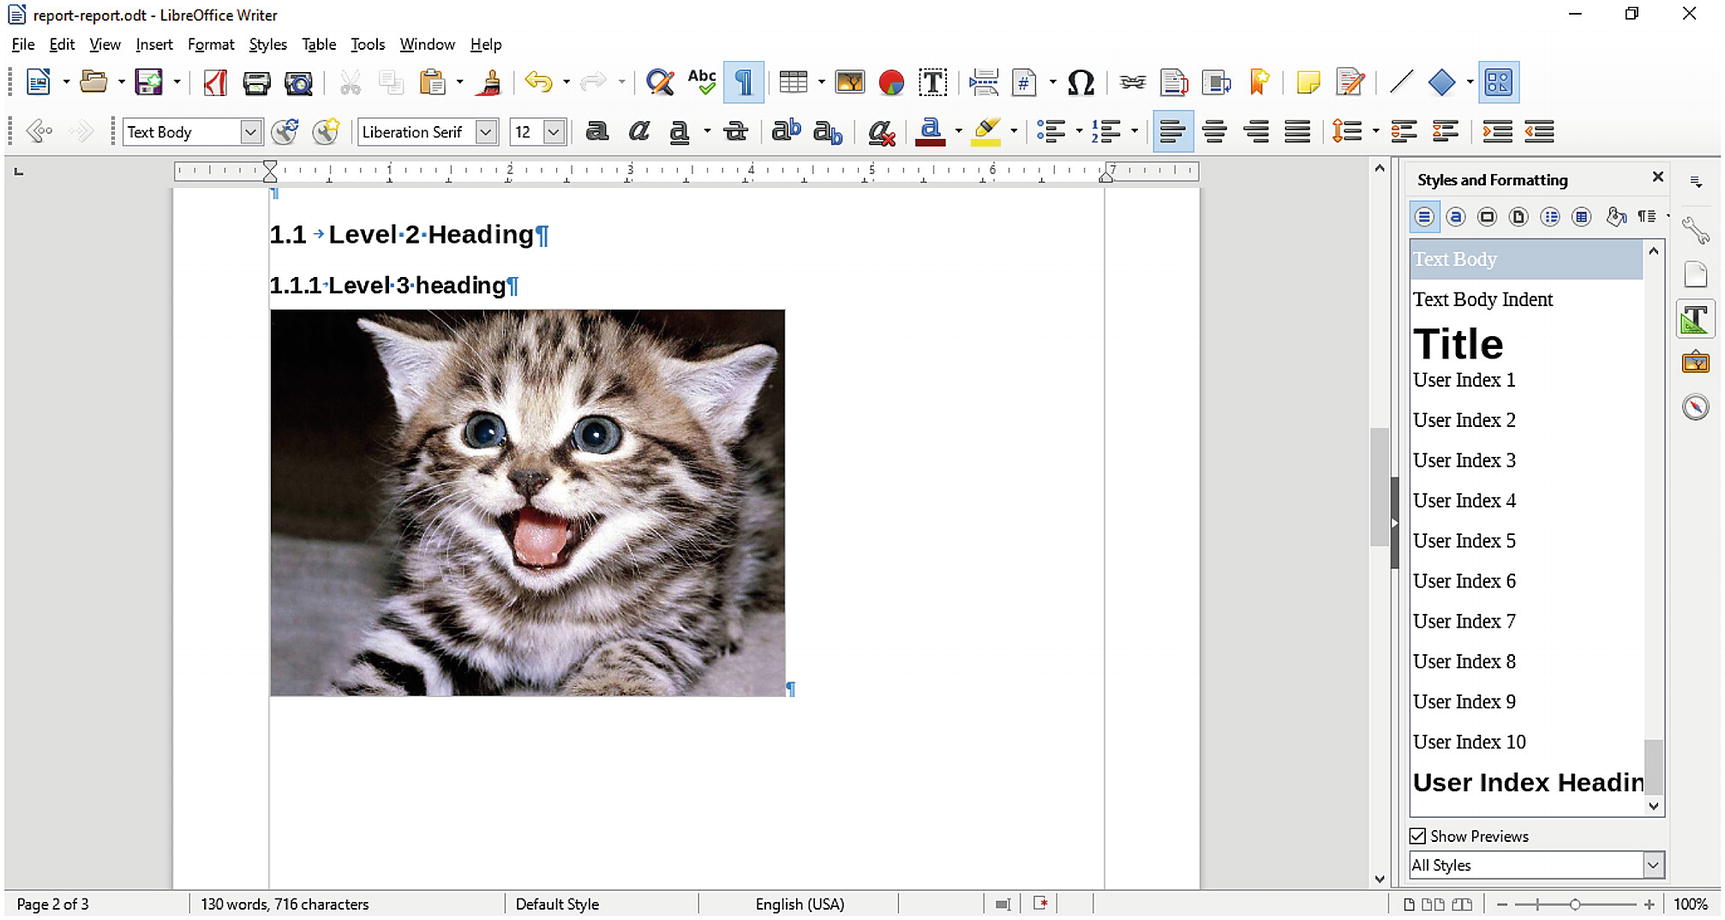
Figure 4-24 A sneaky way of getting a cute kitten into the book
However, since this is a serious report and the people reading it might not understand what they are looking at, let’s add a few graphics. First bring up the Drawing toolbar using the command View ➤ Toolbar ➤ Drawing, as shown in Figure 4-25.
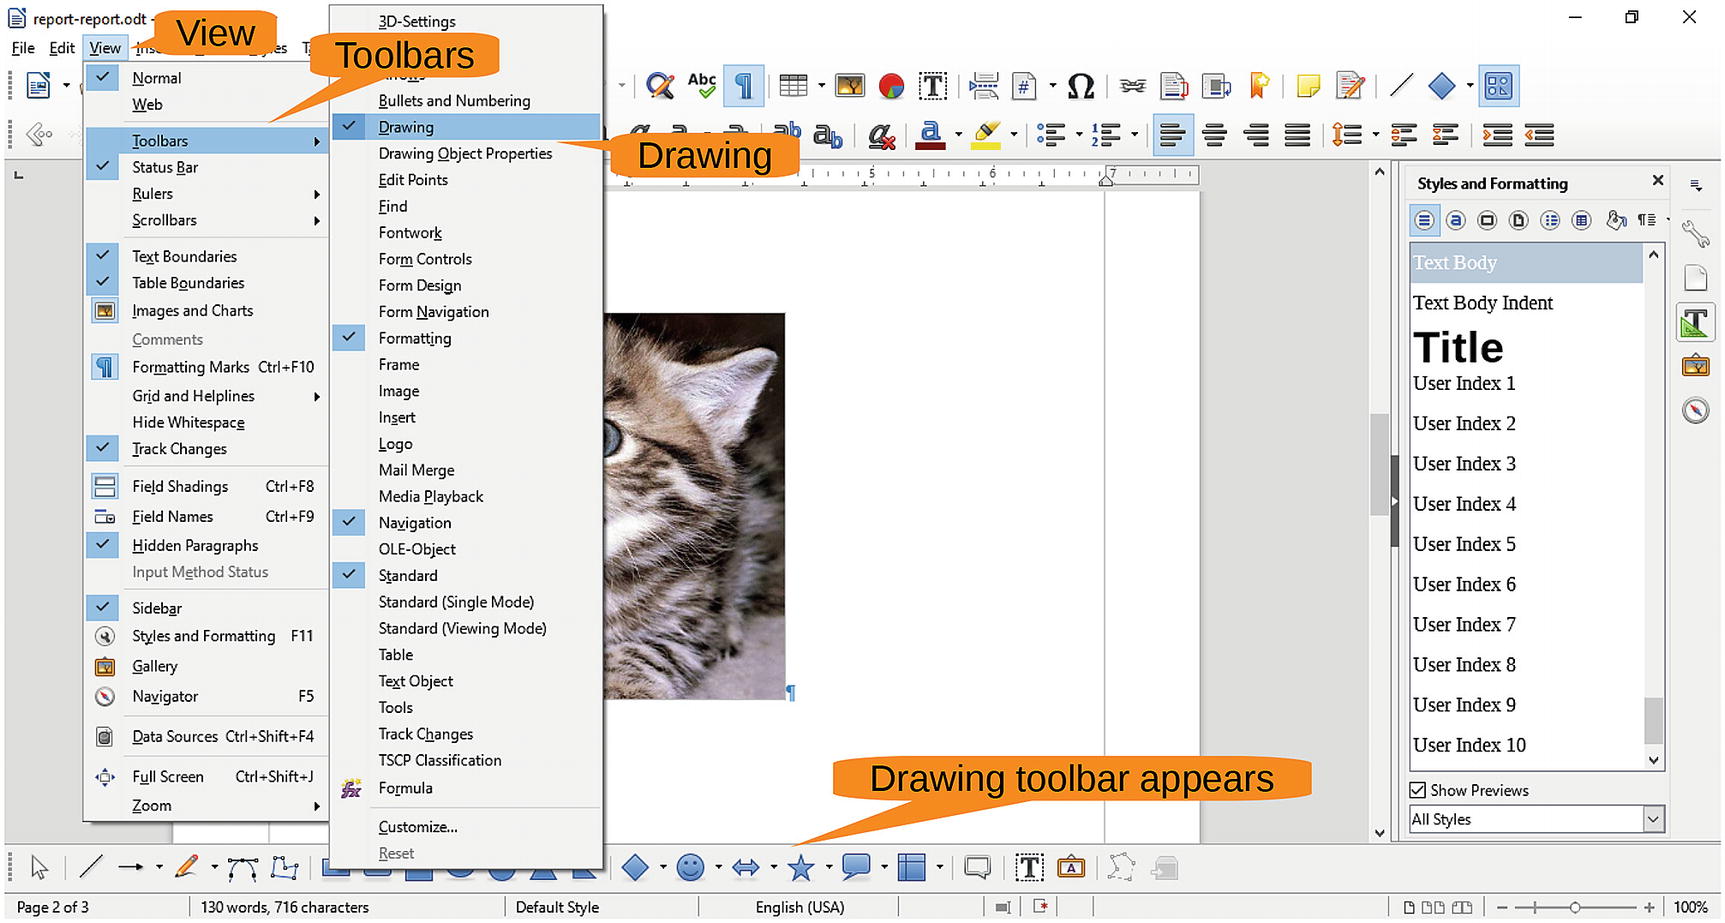
Figure 4-25 Drawing toolbar
Click the circle on the Drawing toolbar; then click the upper left of the cat’s face and drag the cursor to the lower right. A circle will be generated covering up the cat’s face, as illustrated by the ugly picture in Figure 4-26.
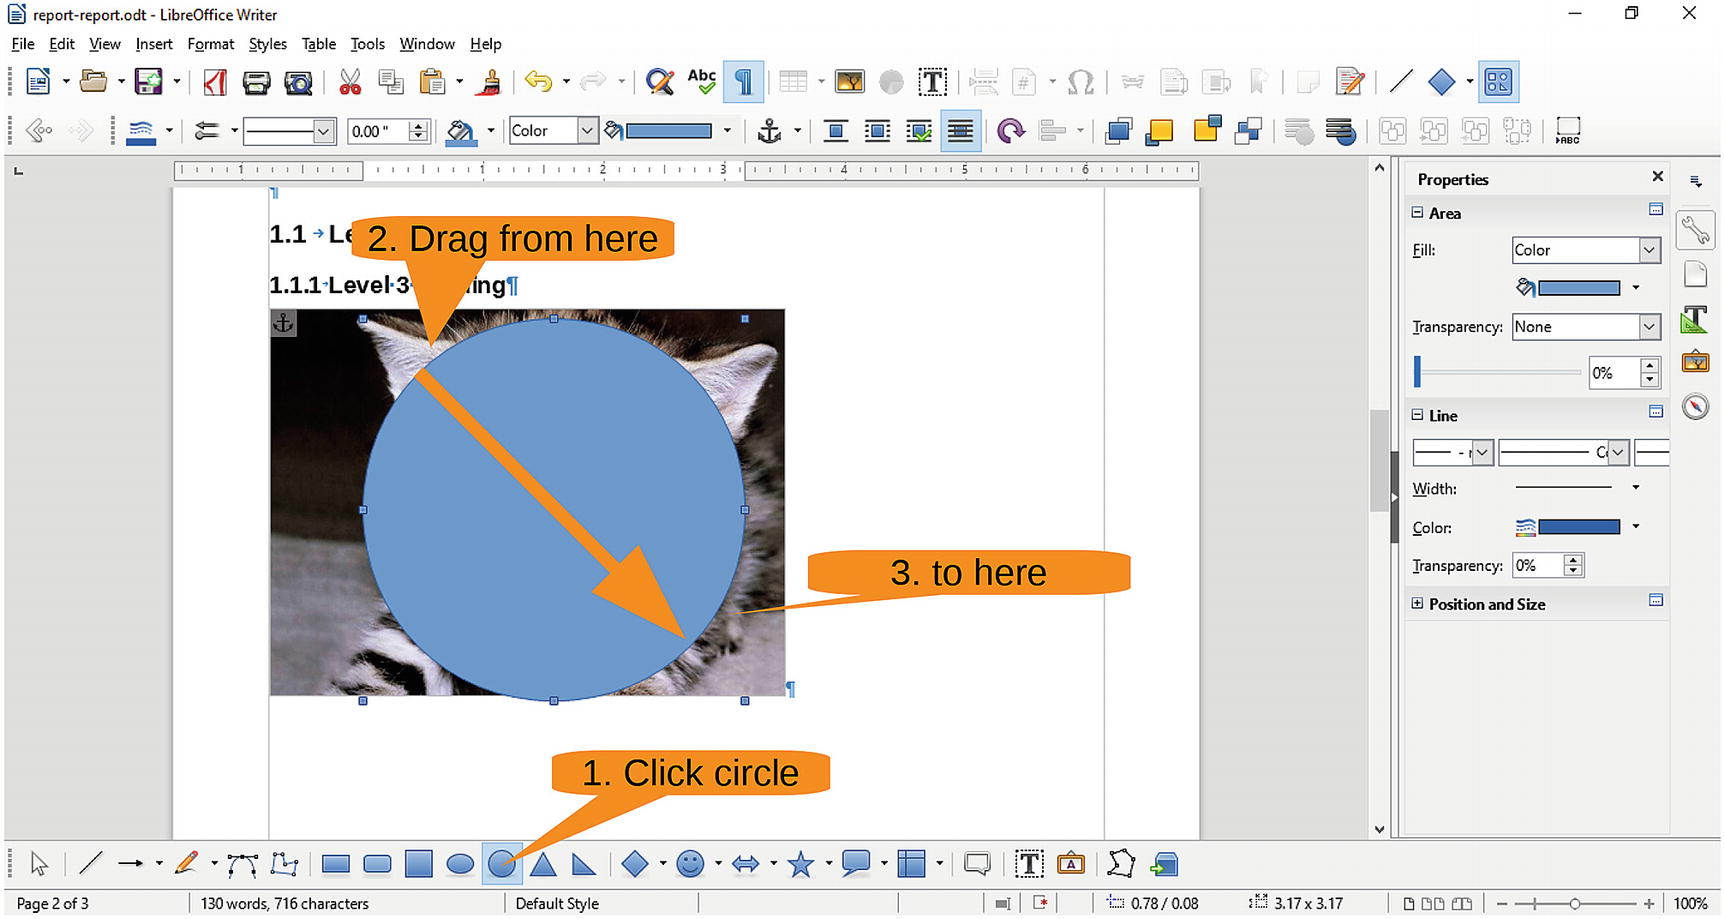
Figure 4-26 Circle drawn
Now let’s bring the kitten back. In the Properties panel, under Area, change Fill to None. Under Line, change Width to 2.3 and Color to a yellow. The result is a circle around a kitten’s face, as shown in Figure 4-27.
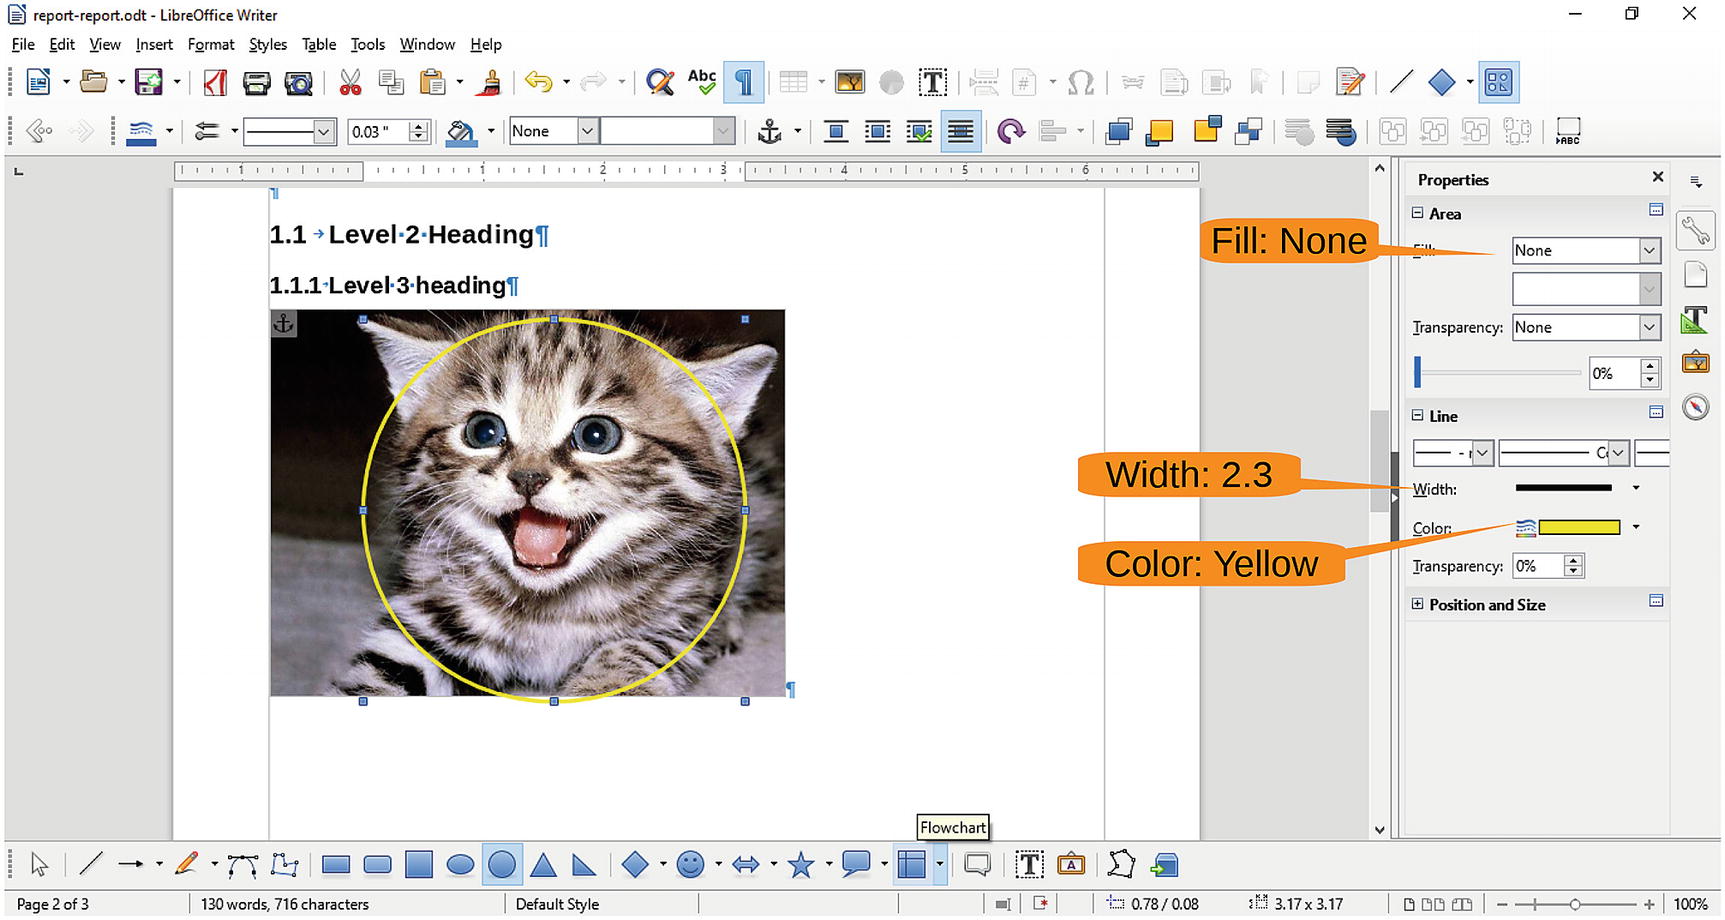
Figure 4-27 Cat with circle
Now let’s click the Callout icon and draw a square to the right of the picture about a half-inch high and 2 inches wide, as shown in Figure 4-28.
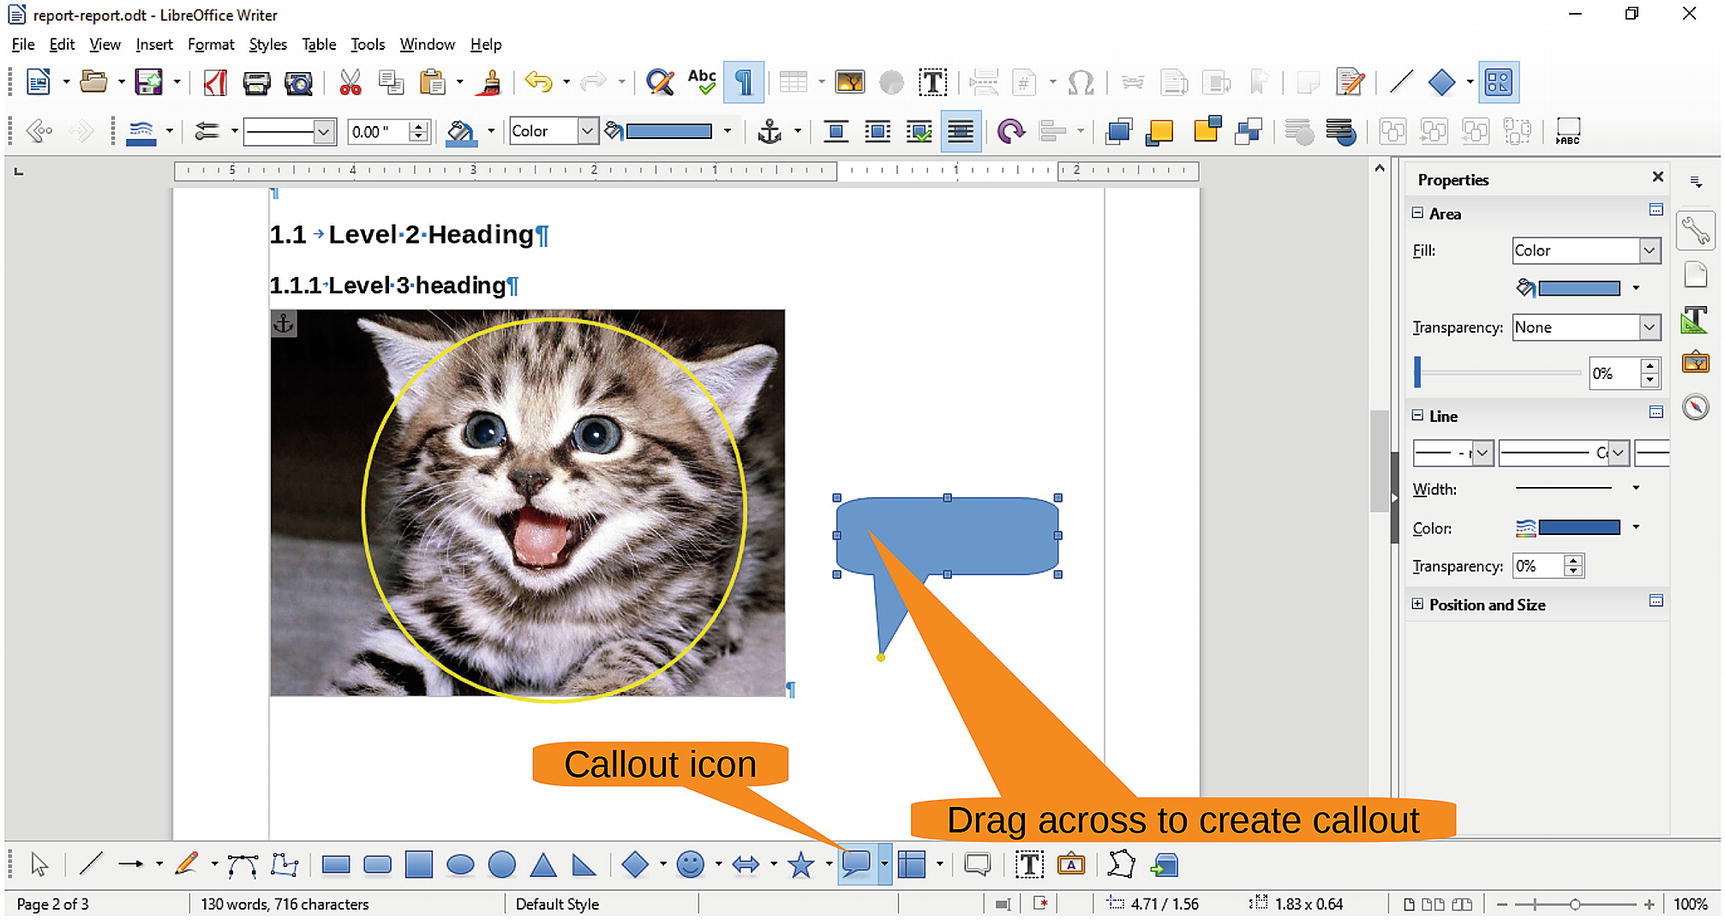
Figure 4-28 Creating the callout
Now drag the handle for the callout pointer (the little yellow dot) to the circle. Click the callout and enter the text Cute Kitten. Figure 4-29 shows the labeled kitten . Click outside the caption to stop editing it. Double-click it if you want to change the text.
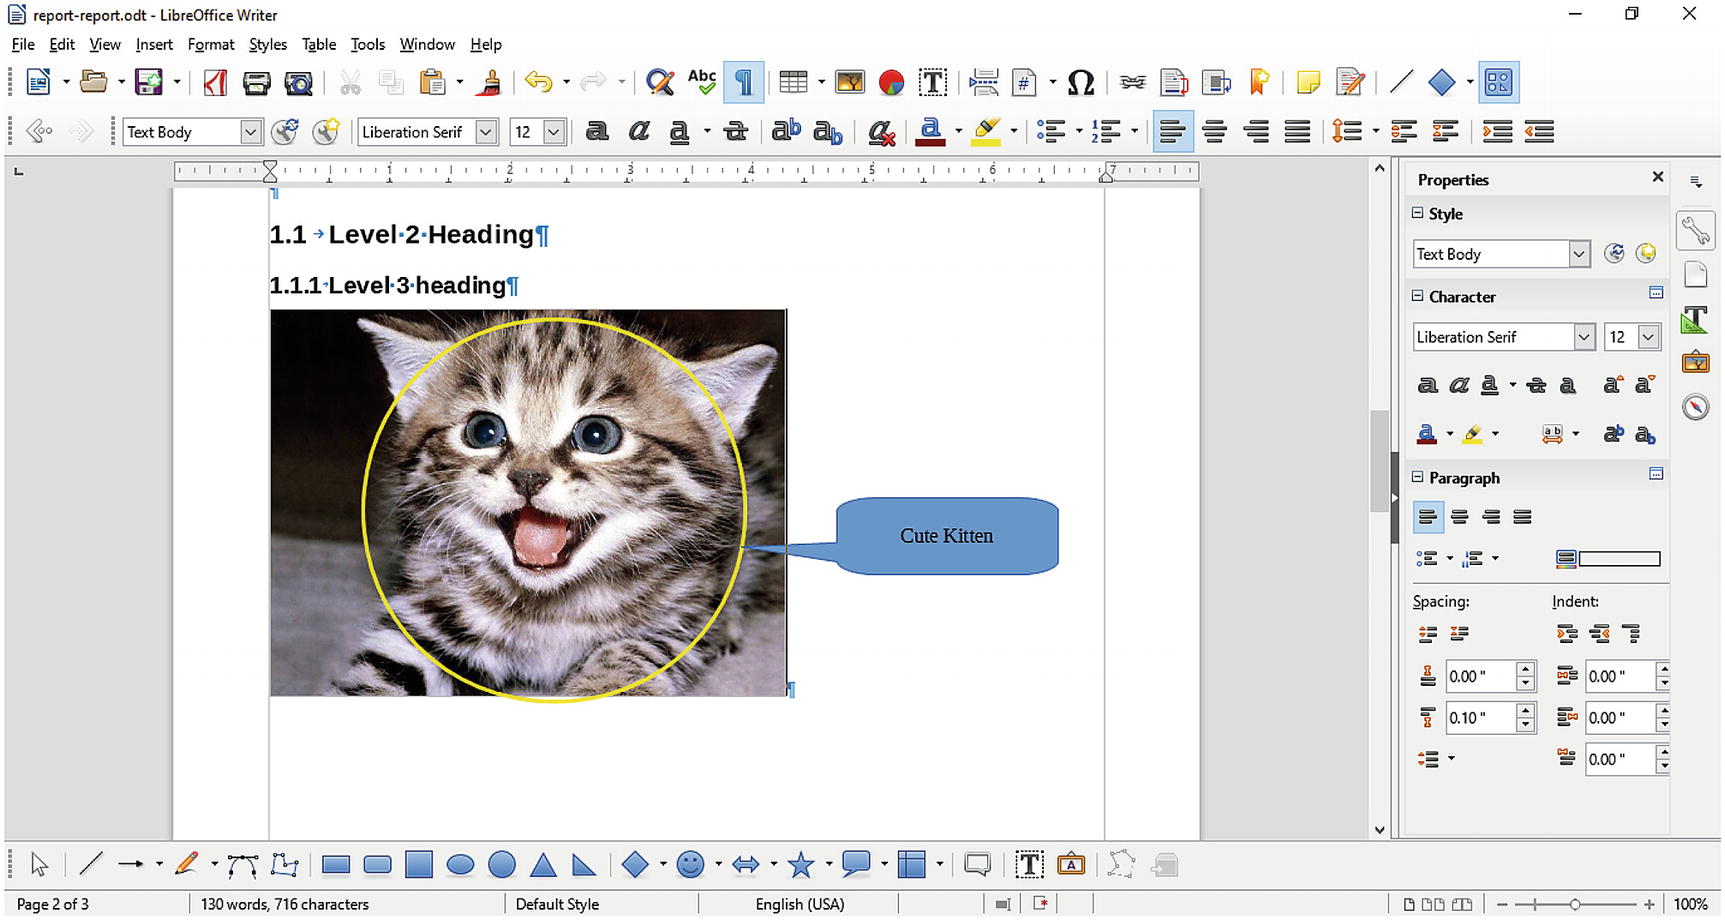
Figure 4-29 Labeled kitten
Summary
We’ve only touched on a fraction of the features available in LibreOffice yet you’ve been able to produce a report that pretty much has everything, including footnotes, endnotes, tables, custom paragraph styles, pictures, and graphics. About the only thing it doesn’t have is any meaningful content. But as they say in college, “The proof is left to the student.”