
Introduction to Project Scheduling
Objectives
On completion of this chapter, you should be able to
- Understand what is meant by activity sequencing
- Understand how network diagrams are used in scheduling
- Understand different types of relationships between tasks (activities)
- Learn how to use Project templates to jump start planning in MS-Project
In Chapter 2, we studied about creating a work breakdown structure (WBS). The WBS will help you to baseline the scope of the project. However, you have yet to arrive with the schedule of the project. There are five key project planning processes (according to Project Management Body of Knowledge [PMBOK]) that will help you to arrive at the schedule once you are ready with the scope of the work. These are:
- Define activities
- Sequence activities
- Estimate activity resources
- Estimate activity durations
- Develop a schedule
In this chapter, we will discuss about how to define activities and how to arrive at a sequence of activities. In subsequent chapters, we shall discuss about estimating activity resources and durations, and also arriving at a schedule. (Note that some of these processes may be combined together in some organizations, based on the organization’s own practices and parameters such as the project size and the domain.)
Define Activities
The first process in the activity planning section is define activities. This process starts with the WBS and identifies the activities required to produce the various project deliverables. Activities are viewed from the perspective of the work packages. You ask the question, “What activities are required to come out with deliverables of the work package?” In the next process, the resulting information from this process is used to organize the activities into a specific sequence. Let us take the example of website requirements work package. This particular work package can be decomposed into activities like user requirements and content requirements as shown in Figure 3.1. As an outcome of this process, you will get activity list and attributes. In MS-Project, as we discussed, all activities are represented by tasks. However, you can use summary tasks to represent work packages and subtasks to represent activities. (For more information on how to insert a summary task using MS-Project, you may refer Appendix C, A quick introduction to MS-Project 2016). You will also get a milestones list in the project. In a project, milestones are significant events or points of interest (Figure 3.2).Milestones have zero duration. For example, project start and design freeze are milestones in a project.

Figure 3.1 An example of breaking up website requirements work package into activities

Figure 3.2 Milestones along the timeline of a project
Project milestones are also referred to as a Phase Gate, Stage Gate, Check Point, or Decision Point. In MS-Project, in Gantt Chart, milestones are represented using a diamond shape, by default.
The next process is that of arranging the activity list from activity definition into a discrete sequence (Figure 3.3). Some activities can be accomplished at any time throughout the project. Other activities depend on input from another activity or are constrained by time or resources. Any requirement that restricts the start or end time of an activity is a logical relationship. This process identifies all relationships between activities and notes restrictions imposed by these relationships.

Figure 3.3 Sequencing of activities in a work-package
For example, when building a software you cannot do unit testing of a module unless the coding is completed for the same. This is just one example of how activities can be related to one another. The sequence activities process is one that can benefit from the use of computer software to assist in noting and keeping track of interactivity relationships.
Network Diagrams and Precedence
Diagramming Method
When planning project activities, as a first step, we have to understand network diagrams. Network diagrams provide a graphical view of activities and how they are related to one another. The most common type of diagramming method for building a schedule network diagram is the precedence diagramming method (PDM). Activity on node (AON) is a PDM. Most scheduling software packages use AON.A sample AON is shown in Figure 3.4 for reference.

Figure 3.4 An example of an AON diagram
The PDM shows nodes—representing activities—connected by arrows that represent logical relationships. For example, to represent that activity B is dependent on activity A (in other words, activity A must be complete before activity B starts), simply draw an arrow from A to B. PDM diagrams are also referred to as AON diagrams because the nodes contain the activity duration information. The arrows show how some activities are dependent on other activities. For example, activity D cannot start until activities C and E are complete. To show this dual dependency, we draw an arrow from C to D and another arrow from E to D.
In fact, nodes generally contain several pieces of information, including
- Early start—The earliest date the activity can start
- Duration—The duration of the activity
- Early finish—The earliest date the activity can finish
- Late start—The latest date the activity can start
- Late finish—The latest date the activity can finish
- Float or slack—Difference between the early start and the late start dates (or the difference between early finish and late finish dates)
We will discuss about the same and also will see how this can be used in schedule-related computations in subsequent chapters.
There can be four types of relationships with a PDM diagram, as shown in Figure 3.5:

Figure 3.5 Different types of relationships between tasks (activities)
- Finish-to-start—It is the most common type of dependency. The successor activity’s start depends on the completion of the predecessor activity. For example, finish coding for Module 1 before starting unit testing Module 1.
- Finish-to-finish—The completion of the successor activity depends on the completion of the predecessor activity. Let us say you are doing a series of tests and creating a test report. The test report cannot be finished unless testing activity is finished.
- Start-to-start—The start of the successor activity depends on the start of the predecessor activity. You have to start integration of modules to start integration testing.
- Start-to-finish—The completion of the successor activity depends on the start of the predecessor activity. It is rarely used.
Leads and Lags
In addition to relationships, we have to understand the two terms related to time period, namely lead and lag to build a schedule network (see Figure 3.6). A successor activity can be advanced with respect to a predecessor activity, when you have a lead. For example, if you are writing a big proposal, two weeks before finishing the first draft, the review process can be started. This would be shown as a finish-to-start relationship with a two weeks’ lead.
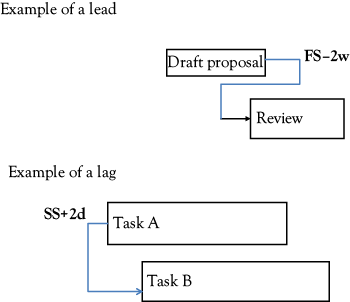
Figure 3.6 Example of lead and lag
When you have a lag, a successor activity will be delayed with respect to a predecessor activity. For example, let us say you are building two modules of software using a new tool. Though these can be started simultaneously, you are delaying the Task B of building Module 2 because you want to apply the learning of building Module 1 (of Task A), as shown in Figure 3.6. The use of leads and lag is purely based on technical requirements and constraints. It should not replace schedule logic.
Project Templates
We discussed about activity lists and sequencing in this chapter. Although no two projects can be the same, there can be similar projects. For example, different Mobile AppDevelopment projects can have same tasks and sequences. It means that you may use a template that includes much of the initial information you need, like task (activity) names and relationships, to jump-start project planning. This can help you to expedite the process of arriving at the activity list and sequencing the same. We will be discussing the same with an example in the next section.
Sources of templates can vary. Some templates installed during the installation of MS-Project templates are also available on MS-Office online website, www.office.com, and other industry-specific websites. To see such available templates online, click on File tab and then New. You also see a search box to facilitate the search. (You may require a change in security settings of MS-Project, for the same. Click on File Tab and select Options. Click on the Trust Center in Project Options Dialog that pops up, and click on the button Trust Center Settings. Ensure that the Allow office to connect to the Internet is selected under Privacy Options of the Trust Center.)
Templates may also be shared with you by other MS-Project users you know (who may be doing similar projects). Organizations also provide templates to the employees based on the typical projects they execute.
Example Problem: Using Templates
to Expedite the Planning
You can also create templates from your project plans for later use or to share with say your vendors or your organization. We will be discussing about the same in this example and also see how you can avoid passing sensitive information in the template file.
- Copy Sample Project file Porting-original.mpp from the Practice-
Files/Ch03 folder and rename as Porting.mpp. Double click and open the file. Take a look at the task list in the Gantt Chart view (Figure 3.7). View the resource information in the Resource sheet view. You will see information like resource name and resource rate (Figure 3.8). - On the File tab, click Save As. Navigate to the folder in which you want to save the new template. In the Save as Type box, select Project Template. In the File Name box, enter the template file name that you want, and then click Save (Figure 3.9).
- Information like Resource pay rates may be sensitive and you may be having concerns on sharing the same with say other departments, your suppliers, or business associates. When the Save As Template dialog box appears, select the type of information, such as resource rates (Figure 3.10), which you want to be removed from the template. Note that the original project plan is not affected. After selecting the data like resource rates using the check-box, click on Save. The template gets saved with an extension .mpt.
- As a last step, you may verify the Resource sheet of the template file you created. View the Gantt Chart. You will find all the tasks listed. When you view the Resource sheet of the template file (Click View Tab and then on Resource Sheet in the Resource Views Group), you will find that information like resource rates are listed as null as seen in Figure 3.11. Close both files.

Figure 3.7 Task list in the Gantt Chart view of the original file (typical project)

Figure 3.8 Resource sheet view of the original file (typical project)

Figure 3.9 Save the file as a project template

Figure 3.10 Save as template dialog enables you to remove data from the template when you are saving

Figure 3.11 Information like resource rate has been removed and is not available in the template
To conclude, we discussed about various processes related to scheduling and also looked at sequencing in detail, in this chapter. As an example, we saw how MS-Project templates can be used to jump-start the project planning with activity lists and sequencing.