What Is New in MS-Project Professional 2016?
MS-Project Professional has several new features, which include:
- Multiple time lines: You can use multiple time lines feature to highlight different phases of the project or categories of the work. You also have the flexibility of specifying the start and end dates of each of the time line.
- Tell me what you want to do: If you are stuck somewhere and do not know how to go ahead with doing something, enter the related words or phrases. Then you will be able to quickly get to features you want to use or actions you want to perform.
- New themes for project: You now have three office themes to apply to Project 2016: Colorful, Dark Gray, and White. To access these themes, first click File >Options >General to see all general options and then click the drop-down menu next to Office Theme to select the required theme.
- Better control over resources: In an enterprise environment, some resources may have their time scheduled by a resource manager because of limited availability. With MS-Project Professional 2016 and Project Online, project managers and resource managers can negotiate an agreement, called a resource engagement, to make sure that resources are being used appropriately and effectively in the organization.
Project management solutions of Microsoft can be broadly categorized in to two groups.
- Cloud-based solutions
- On-premises solutions
Project Online Essentials, Project Online Professional, and so on, are part of Cloud-based solutions.
Among On-premises solutions, MS-Project for the desktop is available in two editions:
- Project Standard: It is the entry-level application, for individual users, though you can manage multiple projects using the same. You can share documents over the cloud or a network drive.
- Project Professional: In addition to features of Project Standard, it has features like Team Planner view and Share-point task list synchronization. You can synchronize information with Project Online. You can also connect to Project server and collaborate, with MS-Project Professional. Project Server architecture has been described in Appendix F.
The book covers Project Standard and Project Professional, though all of the screen shots are of Project Professional. It does not cover the enterprise features available in MS-Project Professional and Project Server.
A Quick Introduction to MS-Project 2016
Introduction
Managing projects effectively is a challenge many managers face. MS-Project 2016 is a software that is designed to assist managers to more effectively manage their projects. It helps them by allowing them to simplify things such as linking tasks, defining work resources, assigning tasks to engineers, visualizing a project, analyzing a project progress, managing a budget, and generating reports. This appendix covers the essentials of MS-Project 2016, provides a brief overview of the graphical user interface, and covers creating and linking tasks, adding resources and assigning them to tasks, and scheduling. This section uses tasks and resources related to a small testing project of Information technology to build an example.
Understanding the User Interface
Microsoft Office Project 2016 incorporates the Ribbon (User interface based on the Fluent), Quick Access toolbar, Back-stage view. Menus and toolbars are context-sensitive. This makes working with MS-Project 2016 easier, for many of you, who are familiar with other MS-Office applications.
The Gantt Chart view is the default view and it has two main areas: the task table (left side of the view) and the timescale (right side of the view) as shown in Figure C.1. The tasktable lists the project tasks and their accompanying information like start date, duration. The timescale displays task bars that correspond to the tasks entered (or listed) in the tasktable. The task bars show the duration of each task, from their planned start dates to their planned finish dates, over time. You can move the separator bar between the timescale and the tasktable to the left or right to display more of either area. The time line, which is at the top (included optionally), provides a graphical view of a project along a single left-right axis.
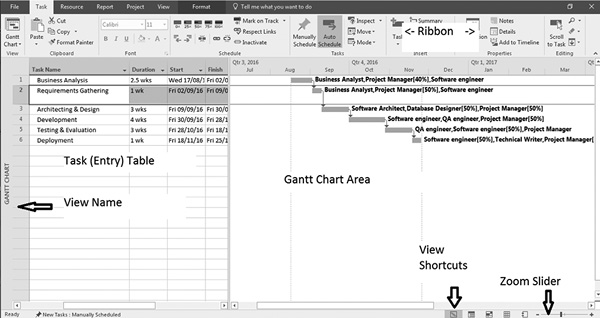
Figure C.1 MS-Project 2016 window with GanttChart view
Creating a New Project
To create a new project, you can start with the default blank project, or you can base your new project on an existing project or template. You also have the option of using task lists from other applications like MS-Excel. Let us create a new project from scratch. To create a new project:
- Click the Start button, click All Programs, and click Project 2016.
The Start screen appears (see Figure C.2).
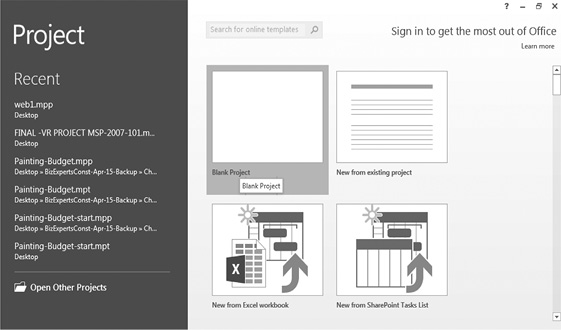
Figure C.2 Creating a new project
- In the right pane, click Blank Project a new, blank project opens in the program window in the Gantt Chart view. (You may also do the same by using the File tab on the ribbon and then selecting New if you are running MS-Project already.)
Most projects begin with a list of the tasks that need to be completed. Obviously, all the tasks cannot be started on the project start date. Once you create your task list, you have to define the relationships between the tasks.
Tasks can be manually scheduled or automatically scheduled, depending on the needs of the project and the information currently available. Generally, when you initiate the project, the information available is limited and you may have to do a macrolevel planning without exact duration and specific start or finish dates. Perhaps, manual scheduling becomes handy at that point of time. At any point during a project, you can change a task to automatic scheduling from manual scheduling, or vice versa.
Creating a Manually Scheduled Task
By default, all new tasks in MS-Project 2016 are set for manual scheduling. With manual scheduling, you can fully control the task’s duration, start date, and finish date. The duration can be entered in months (mo), weeks (w), days (d), hours (h), or even in minutes (m). Manually scheduled tasks are marked with the push pin icon, in the Task Mode field.
To create a manually scheduled task:
- In the first row of the task table, enter Planning & Preparation in the Task Name Field (see Figure C.3).
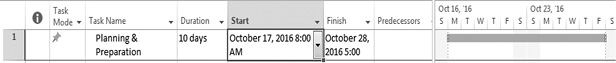
Figure C.3 Creating a manually scheduled task
- Enter 10d in the Duration field. This sets the duration of the task to two weeks, as there are five work days in a week.
- Enter October 17th, 2016 using the calendar pick in the Start field. MS-Project 2016 automatically calculates the finish date using the given information and fills in the Finish field. Also, a task bar appears in the timescale (on the same row as the task) showing the task’s time frame.
Creating an Automatically Scheduled Task
In automatically scheduled task mode, you can have MS-Project 2016 calculate dates and durations. Automatically scheduled tasks are marked with the Gantt-bar icon in the Task Mode field.
Let us create an auto-scheduled task in this plan. To create an automatically scheduled task:
- In the second row of the task table, in the task name column, enter Execute Manual Tests as shown in Figure C.4.
![]()
Figure C.4 Automatic scheduling
- Click in the Task Mode field, click the down arrow that appears, and then click Auto Scheduled. By default, Project2016 assigns the task an estimated duration of one day and automatically fills in the Duration, Start, and Finish fields. By default, the estimated duration is 1 day (with “?” indicating that you need to key in the data). Also, a task bar appears in the timescale showing the task’s time frame.
- To change the duration of the task to two days, enter 2d in the Duration field. Project 2016 recalculates the finish date and the Finish field gets updated accordingly.
- Similarly add five more Auto-scheduled tasks and respective durations shown in the Table C.1 (in the same order below the second task).
Table C.1 Tasks list (with durations)
|
Task number |
Task name |
Duration (days) |
|
3 |
Execute Automated Tests |
2 |
|
4 |
Execute Beta Tests |
2 |
|
5 |
Execute User Acceptance Tests |
2 |
|
6 |
Analyze Test Results |
2 |
|
7 |
Compile Test Statistics |
2 |
- Also add one last Manual task Build Approved as a milestone. Milestones are significant events with zero duration. For that, after entering all the previous tasks, click in the empty cell. In the Task Tab, Insert Group select Milestone (Diamond shape) and insert details like task name.
Linking Tasks
When you link tasks, you create a relationship between them. MS-Project 2016 supports four types of task relationships (which we have discussed in Chapter 3 of this book). By default, MS-Project 2016 creates finish-to-start links, which means that the first task has to be finished before the second task can start.
To link tasks:
- In the Task Name column, click to select the first task and then hold down the Ctrl key, and click to select the remaining tasks. As an alternative, you can select the first and the last tasks, using the Shift key, to select all tasks. The order in which the tasks are selected is important. It defines the order in which the tasks are linked.
- On the Task tab of the Ribbon, in the Schedule group, click the Link the Selected Tasks button (Figure C.5). Project 2016 fills in the Start and Finish fields of the task and links tasks by adding link lines between the task bars in the timescale.
(You may change the Finish to Start relationship which is set by default. For that, double click on the successor task. In the Task Information dialogue that appears select Predecessors tab. Next to the predecessor task name, you find the Type as Finish-to-Start. Click on the same. You may change the same by selecting a value from the pull down menu there.)

Figure C.5 Linking tasks
- Let us see how switching to automatic scheduling will be advantageous as we progress with the planning. For that, change the duration of the Compile Test Statistics task to five days instead of two days (Figure C.6). As you observe the start date of the manually scheduled task, Build Approved does not get automatically adjusted and will need to be adjusted manually.
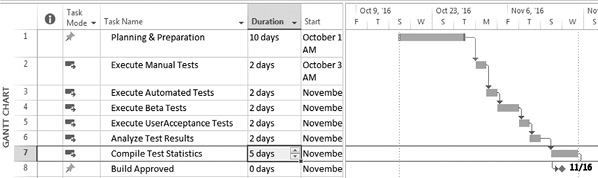
Figure C.6 Start and finish dates do not get adjusted automatically for manually scheduled tasks
- Change the duration of the Build Approved task back to two days.
Inserting a Summary Task
When organizing the tasks for a project, you can group tasks that share characteristics or that will be completed in the same time frame under a summary task. By default, the summary tasks are bold and out-dented, and the subtasks are indented beneath them.
To create a summary task:
- In the Task Name column, select tasks two to five (using Ctrl or Shift Key).
- On the Task tab of the Ribbon, in the Insert group, click the Insert Summary Task button (see Figure C.7). MS-Project 2016 inserts the new summary task above all the selected tasks, fills in the Task Name field with the text <NewSummaryTask>, and turns all tasks below it into subtasks.
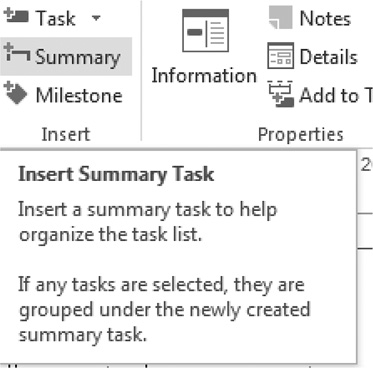
Figure C.7 Inserting summary task
- Enter Execute Tests in the Task Name field of the summary task.
Another way of creating a summary and sub tasks in a task list is by moving existing tasks a level up or down using outdent-indent buttons. These are there in the Task tab of the ribbon, in the Schedule group (with arrows pointing to left and right sides).
Updating Task Progress
A simple way of tracking task progress is to specify a percentage of completion. You can enter a value between 0 percent (for a task that has not started) and 100 percent (for a task that is finished).
To update a task’s percentage of completion:
- In the Task Name column, double-click the Execute Manual Tests. The Task Information dialog box opens.
- On the General tab, in the Percent complete box, enter 50 percent (see Figure C.8).
Click the OK button. In the timescale, a progress bar is added within the Execute Manual Tests task bar which shows the progress on the task (see Figure C.9).

Figure C.8 Entering percentage completion using the task information dialog
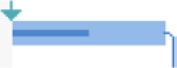
Figure C.9 Progress bar displaying the percentage completion
This way, you may set the percentage completion anywhere between 0 and 100 percent. Another quick (yet a limited) way to update is to set the tasks to 0, 25, 50, 75, or 100 percent complete by selecting the tasks in the task table and then clicking the corresponding button in the schedule group on the Task tab of the ribbon (see Figure C.10)
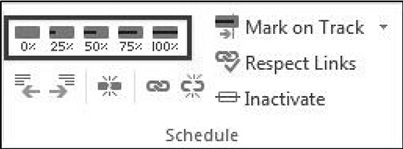
Figure C.10 Updating percentage completion using buttons in the Schedule Group (Task Tab)
Working with Resources
Resources are typically people or material assigned to tasks in a project. People, equipment, or machinery required to accomplish the task are categorized as Work resources. Resources can also include materials (like paper, pen drive) or cost (like travel costs, license fees), essential to complete the project.
Adding a Work Resource
You make resources available to assign to tasks within your project, by adding resources in the resource sheet.
To add a work resource:
- On the View tab of the Ribbon, in the Resource Views group, click the Resource Sheet button to switch to the Resource Sheet view.
- In the first row, enter Project Manager in the Resource Name field (see Figure C.11). Make sure that the Type field is set to Work. (P automatically appears in the Initials field).
You have the option of mentioning a Group Name (like Managers) in the Group field while entering the resource information.

Figure C.11 Entering resource details on the resource sheet
- Enter 20 in the Std. Rate field. This sets the hourly rate for that worker to $20.
- Similarly, add a second resource QA Engineer (with Initial Q), with a Std Rate $10.
Changing a Resource’s Work Hours
By default, a resource’s work hours are set to the project’s work hours. You can change a resource’s work hours to reflect his or her actual work schedule.
Let us change the work hours of QA Engineer. To do that:
- In the Resource Name column, double-click the QA Engineer resource. The Resource Information dialog box opens.
- On the General tab, click the Change Working Time button. The Change Working Time dialog box pops up.
- Click the Work Weeks tab in the lower section of the dialog box.
- In the Name column, double-click the [Default] work week. The Details for “[Default]” dialog box opens (see Figure C.12).
Figure C.12 Entering resource details on the resource sheet
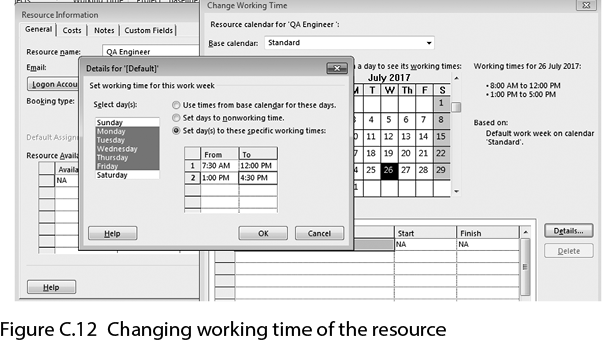
- In the Select day(s) box, select Monday through Friday by clicking Monday, holding down the Shift key, and then clicking Friday.
- Select the Set day(s) to these specific working times option.
- Change the From time in the first row to 7:30 AM and the To time in the second row to 4:30 PM.
- Click the OK button in each dialog box to apply the changes.
On similar lines you can change the project calendar too. To do that, select Project Tab on the ribbon and in the Properties group, click on the Change Working Time. You will get Change Working Time dialog, which can be used to define the Project Calendar.
Assigning a Resource to a Task
After you add resources to your project, the next step is to assign them to relevant tasks within your project. There are several ways of doing the same in MS-Project. Let us use one.
To assign a resource to a task:
- On the View tab of the Ribbon, in the Task Views group, click the Gantt Chart button
To switch to the Gantt Chart view.
- In the task table, click in the Resource Names field of the Execute Manual Tests task, click the down arrow that appears, and then select the check-box next to QA Engineer to assign him to the task (see Figure C.13). You may recall that we created QA Engineer. If you find that the Resource Names column is not displayed then use the scroll bar at the bottom of the task table, or move the separator between the Gantt chart area and the task table to display the same.
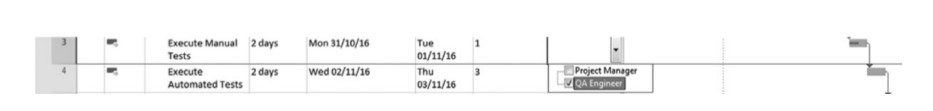
Figure C.13 Assigning a resource using “Resource Names” field
Note: A red person icon may appear in the Indicators field (in the first column) of the task if the resource is overallocated.
Assigning Multiple Resources to a task
Some tasks may require multiple resources to complete. However, multiple resources can be assigned to the same task some times, to reduce the amount of time needed to complete the task.
Let us assign multiple resources to an auto scheduled task and see how MS-Project gives you an option of adjusting the amount of the work or the duration. We shall also use the Assign Resources dialog box for the same. To assign multiple resources:
- In the Task Name column of the task table, click to select the Analyze Test Results task.
- On the Resource tab of the Ribbon, in the Assignments group, click the Assign Resources button. The Assign Resources dialog box opens.
- In the Resource Name column, click to select the QA Engineer resource, and then click the Assign button.
- Click to select the Project Manager resource, and in the Units column type 50 (for 50 percent or 0.5 units, indicating that the resource works for half a day), then click the Assign button (Figure C.14).
Click the Close button.

Figure C.14 Assign resources dialog box
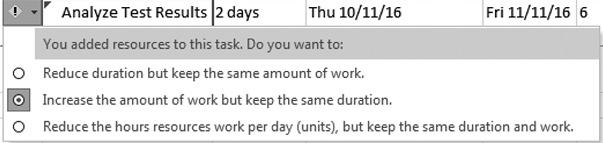
- Here the task required two work resources to be assigned and this was not done with the intent of just reducing the duration (crashing). Therefore click the exclamation icon that appears to the left of the cell and select the Increase the amount of work but keep the same duration option as the reason for assigning work resources to the task (see Figure C.15). A task must be set to Auto Scheduled to enable this option.
Figure C.15 Click on the exclamation icon and adjust work, resources, or duration
Setting a Scheduling Constraint
We saw how linking tasks can change the start dates of some tasks. We can restrict set on the start or finish date of a task, using constraints. There are several types of constraints that can be placed on a task. By default, As Soon As Possible constraint is placed on all tasks.
Let us set Start No Earlier Than constraint on a task. To set the scheduling constraint:
- Make sure that the Gantt Chart view is displayed. Select Compile Test Statistics.
- On the Task tab of the Ribbon, in the Properties group, click the Display Task Details button. The Task Details Form view displays below the Gantt Chart view. In the Constraint section, select Start No Earlier Than from the Constraint list (see Figure C.16).
Also set the corresponding constraint Date to one day after its original start date.
Figure C.16 Constraints list

- Click the OK button. The start and finish dates of the Compile Test Statistics task are updated in the task table.
We study about creating a project plan with a task list and assigning resources, in detail, in the book. However, in many situations, you may have to share project information like Gantt chart with a colleague, vendor, or a manager, who does not have MS-Project. For example, let us say your supervisor is preparing a presentation and if he or she does not have MS-Project, a slide with Gantt Chart may serve the immediate purpose. Similarly, a colleague may be interested to send a task list created in Microsoft Excel workbook, to help you in planning. If there are hundreds of tasks listed with information like duration, you may be interested in importing task lists directly from other applications like Excel. In this section, we will discuss some such scenarios and how MS-Project can be used with other MS-Office products like Excel and Word.
You can create a graphic-image snapshot of the active view and paste the image into any application that supports graphic images.
Example Problem: Copying
Views to Word and PowerPoint
You can create a graphic-image snapshot of the active view and paste the image into an application like MS-Word or PowerPoint that supports graphic images.
You are creating a word document titled Project-Progress-Report. In this exercise, you will edit the Word document to communicate the status of a project. You will take the snapshot of Tracking Gantt Chart from the project file enhancement-complete and paste it in a document you are preparing. This document can then be shared with your client or supervisor, and they will be able to understand the status of the project, in spite of not having access to MS-Project. To do this:
- Copy the MS-Word file Project-Progress-Report.doc and the project file enhancement-complete.mpp in your working directory from Practice-files/Ap-D. Open the document Project-Progress-Report.doc and take a look. It is a blank document only with the title.
- Double click and open the file enhancement-complete.mpp. You will view the Tracking Gantt Chart related to Software Enhancement as shown in Figure D.1. The Gantt bars for the enhancement summary task and its subtasks are displayed along with percentage completion, and so on.
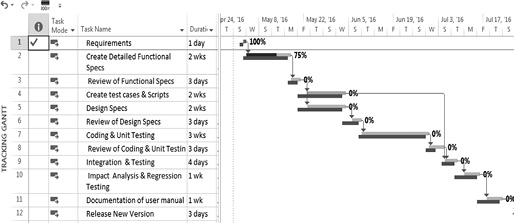
Figure D.1 Tracking Gantt view of the project, which needs to be copied
- You can view the entire project by selecting the View tab and then clicking the Zoom Entire Project button from the Zoom group. Also, you can move the separating line between the table and the chart, toward left to get a better view of the chart. You need to copy to the progress report (the Word document) the image of the chart visible.
- In the Task tab, clipboard group, click on the arrow next to Copy button (pull down) to select Copy Picture. The Copy Picture dialog box appears, which helps you to control the details of the plan you want to copy (Figure D.2). You have the option of saving the image as a GIF (Graphics Interchange Format) file too. The Copy option in the dialog helps you to specify the rows, and the timescale option helps you to specify time period for copying select portion of the plan. Accept the default options and click OK. Project copies a graphic image of the Gantt Chart for just the selected rows to the Windows Clipboard.

Figure D.2 Copy Picture dialog with different options
- As a last step you have to paste this image in the MS-Word document, Project-Progress-Report.doc that you had opened. Click on the document and place the cursor suitably below the title PROJECT PROGRESS REPORT. Using Ctrl + V or contextual menu (available on right click), paste the image (Figure D.3). Save the Word file and close both files (the Project and the Word files).

Figure D.3 Snapshot of the active view has been copied in the word file
You can quickly copy most views and reports from MS-Project to paste into e-mail messages and PowerPoint presentations. Some views like Team Planner and Resource Form cannot be directly copied from MS-Project . You may use a screen capture utility (or Print Screen button on your keyboard), if you need a visual snapshot of a view or report that cannot be directly copied from MS-Project.
Example Problem: Importing Task List
from MS-Office Excel
Let us say a colleague in your company has sent you an Excel workbook that contains her or his recommended tasks and durations of activities for some work related to mobile application development. You would like to import these data into MS-Project and create a Gantt Chart.
When saving data to or opening data from other formats, Project uses maps (also called import/export maps or data-maps) to transfer information from data file of one program to data file of another program. You use data maps to specify which individual fields in the source data file correspond to which individual fields in the destination data file. Once you set up an import/export map, you can use it over and over again, if required. When you have large number of files to be imported, saving the map with a suitable name can be of help.
You change the trust center settings, set up an import/export map, and then transfer task list–related data.
- Copy the AppDevelopment.xls file to your working directory from Practice-files/Ap-D. This is an Excel workbook. If you have Excel installed on your computer, open the workbook (Figure D.4). This is a file you will import into Project. Observe the names and order of the columns (field names), the presence of a header row (the labels at the top of the columns), in the worksheet named Task_Table1. Close the workbook file without saving the changes. Although this step is not a must, it helps in mapping fields.

Figure D.4 Task sheet in the Excel workbook
- You may not be able to open files of MS-Office applications like MS Excel and files from legacy MS-Project files in Project 2016 because of security settings. You have to change this setting to start the import. (You may restore it to its original setting, if required, once you are done with the import). To do that in MS-Project, on the File tab, click Options. The Project Options dialog box appears. Click Trust Center (on the left-hand side) as shown in Figure D.5. Click the Trust Center Settings button to open the Trust Center dialog box. Click Legacy Formats. Under Legacy Formats, select radio button Prompt when loading files with legacy or nondefault file format (Figure D.6). Click OK to close the Trust Center dialog box, and then click OK again to close the Project Options dialog box.
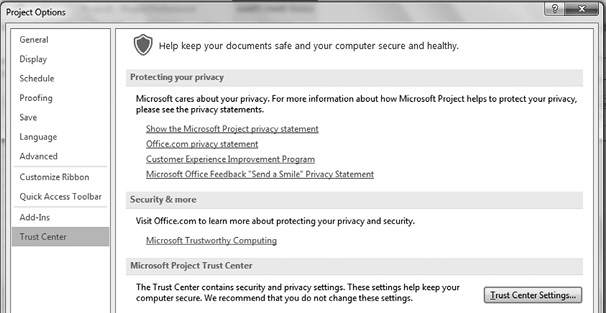
Figure D.5 Use the Project Options dialog to change the trust center–related settings
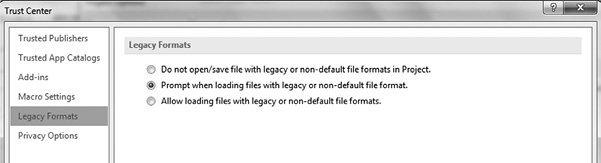
Figure D.6 Allow Legacy formats to open in MS-Project interactively, at the trust center
- With these changes in settings, now you are ready to import an Excel workbook. Click the File tab, then click New and New from Excel Workbook as shown in Figure D.7. Navigate to your working folder. In the file type box (initially labeled Projects), select Excel Workbook as shown in Figure D.8. To understand what all file formats can be imported in MS-Project just scroll through the file type box.
Select the AppDevelopment file, and then click Open. The Import Wizard appears as shown in Figure D.9. This wizard helps you import structured data from a different format to Project.

Figure D.7 Start creating a new project using Excel workbook
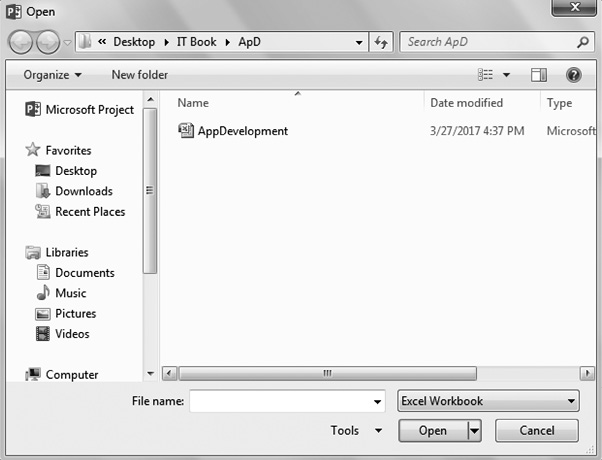
Figure D.8 Select appropriate Excel workbook format in the file type box
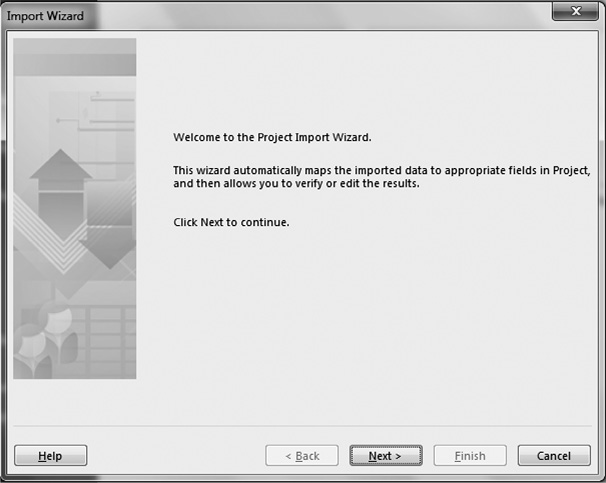
Figure D.9 Project import wizard helps to map the data in an intuitive and interactive manner
- Click Next. The second page of the Import Wizard appears.
The Import Wizard uses maps to organize the way that structured data from another file format is imported into MS-Project. For this exercise, you will create a new map. Ensure that New map is selected, and then click Next. The Import Mode page of the Import Wizard appears. Make sure that As a new project is selected, and then click Next. The Map Options page of the Import Wizard appears. Select the Tasks check-box, and make ensure that Import includes headers (column headings) is selected too.
- Click Next.
The Task Mapping page of the Import Wizard appears (Figure D.10). Here, you identify the source worksheet within the Excel workbook and specify how you want to map the data from the source worksheet to Project fields. In the Source worksheet name box, select Task_Table 1.
Task_Table 1 is the name of the sheet in the Excel workbook. Project analyzes the header row names from the worksheet and suggests the Project field names that are probable matches. You could change the mapping to other fields optionally over here.
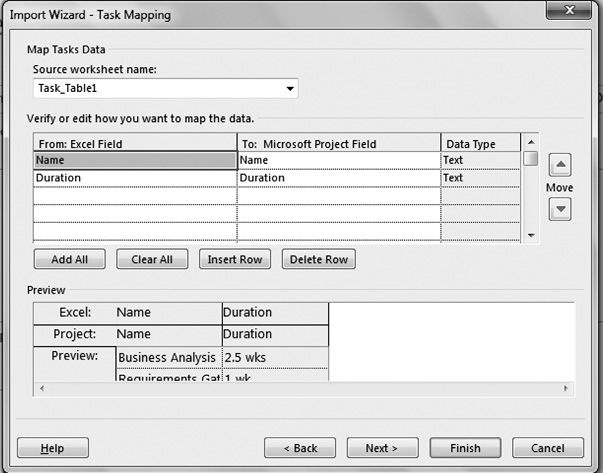
Figure D.10 Map the task information appropriately to relevant fields of MS-Project
- Click Next.
The last page of the Import Wizard appears. Here, you have the option of saving the settings for the new import map, which is useful when you anticipate importing similar data into MS-Project later on. You can skip this step over here, as you have only one file this time around.
Click Finish. Project imports the Excel data into a new plan. You will get a manually scheduled task list (unless you had changed the settings to automatic tasks) with the current date as the project start date in MS-Project as shown in Figure D.11. You may link the tasks, create resources, and further develop the plan in MS-Project.
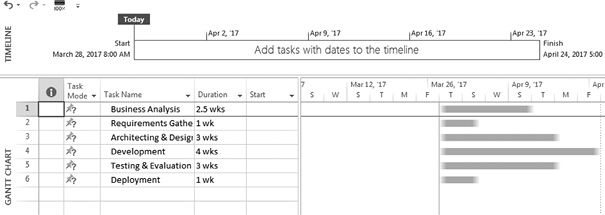
Figure D.11 Imported task list for the bridge project
Note
1. A simple task list with only Task names and duration is used to demonstrate the feature. However, one can import more complex data, with many fields like Start Date and Finish Date from Excel into MS-Project.
2. It is also possible (on similar lines) to transfer the resources and assignments data to Excel workbook, using the export feature of MS-Project.
Often you may need informal product support and a way to broaden your expertise of using MS-Project. There are many user groups that are active online. Some of these conduct events and meet locally too. You may be able to share tips and tricks with other users by being a part of these. The following are a few groups that may be of interest to you.
- MPUG stands for the Microsoft Project Users Group. It provides articles, webinars, discussion groups, and career opportunities. You may visit www.mpug.com for more information.
- Official site of Microsoft Products using the link products.office.com and then navigate to the Project link given at the bottom. Another useful link that provides links to discussion groups, and so on, is technet.microsoft.com
- Folks associated with the Microsoft Most Valuable Professional (MVP) program can be of help to you. You may visit project.mvps.org for more information. There are links to blogs, question–answers, and third-party software on the site.
- You may also become a member of the LinkedIn groups like Microsoft Certified Trainers and Microsoft Project Users and participate in the discussion.
Understanding the Project Server
Before discussing about the server let us look at the definitions of two important terms, namely program management and portfolio management. Program management is the process of managing several related projects together with the intention of improving an organization’s performance. Portfolio is a collection of programs, projects, and/or operations managed as a group. The components of a portfolio may not necessarily be interdependent or even related—but they are managed together as a group to achieve strategic objectives.
Now let us understand the functions of the Project Server in brief. Tools like Project Standard and Project Professional (in stand-alone mode) can help you to manage project from a stand-alone machine. You can do project planning, create tasks and sub tasks, assign those tasks to resources, track those tasks, and generate reports with these. However, it is not easy to manage multiple mega projects in a big organization, with hundreds of planners and managers. In an enterprise like that you need to use a server. Project Server is Microsoft’s Project Management software that allows one to do project management, portfolio management, program management work management, and related things for an organization.
Project Server is a multi tiered system built on SharePoint architecture as shown in Figure F.1. Project Server is made up of a server component (the “server” software) that can be accessed and operated from clients. The client can be a desktop application like Project Professional (about which we have discussed in the book) or Project Web App (PWA) browser–based software or a customized (proprietary or third party) app as shown in Figure F.1. Project Server 2016 runs as a service application in SharePoint Server 2016 Enterprise. In SharePoint 2016, Project Server is integrated into the platform making the deployment easier.
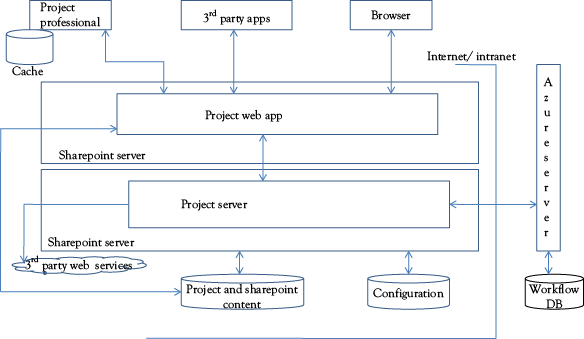
Figure F.1 Project server architecture
PWA is the browser-based interface to Project Server that project managers and team members can use. PWA can be used to manage Project Professional plans (MPP files), SharePoint task lists, and plans created directly in PWA.
Keyboard shortcuts are supported throughout MS-Project. To see the keyboard shortcuts for the available commands, press the Alt key (Figure G.1). Once you start using the keyboard shortcuts to access the tabs, the next level of keyboard shortcuts appear for other submenus. For example, if you select “U” for the resource tab, you will find that you may use “G” to get Assign Resources dialog. Continue pressing letters until you press the letter of the command or control that you want to use. In some cases, you must first press the letter of the group that contains the command. To cancel the action that you are taking and hide the Key-Tips, press Alt.
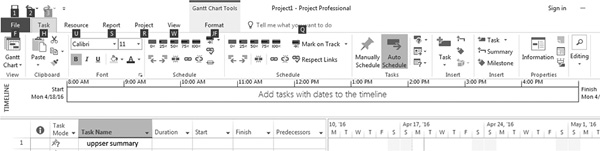
Figure G.1 Key stroke shortcuts are displayed with the Alt key
Other keyboard shortcuts, such as Save file (Ctrl + S), are generally available at all times. Table G.1 gives a select list of such commonly used keystrokes, although it is not a complete one. For keyboard shortcuts in which you press two or more keys at the same time, the keys to press are separated by a plus sign (+) in MS-Project 2016 Help.
Table G.1 Some useful commonly used keyboard shortcuts
|
To do this |
Press |
|
Save project file |
<Ctrl> + <S> |
|
Close current project |
<Ctrl> + <W> |
|
Open existing project in the backstage view |
<Ctrl> + <O> |
|
Open a project file (display the Open dialog box) |
<Ctrl> + F12 |
|
Print/Print preview |
<Ctrl> + <P> |
|
Task or resource information |
<Shift> + <F2> |
|
Go to selected task |
<Ctrl> + <Shift> + <F5> |
|
Link selected task |
<Ctrl> + <F2> |
|
Unlink selected task |
<Ctrl> + <Shift> + F2 |
|
Create a hyperlink |
<Ctrl> + <K> |
|
Zoom out |
<Ctrl> + <Shift> + < * > |
|
Zoom in |
<Ctrl> + </> |
|
Copy a picture of the screen to the clipboard |
Print Screen |
|
Copy a picture of the selected window to the clipboard |
Alt + Print Screen |
|
Undo |
<Ctrl> + <Z> |
|
Redo |
<Ctrl> + <Y> |