
Objectives
On completion of this chapter, you should be able to
- Understand the meaning and significance of critical path
- Understand the meaning and significance of float
- Use forward pass and backward pass to compute float
- Use Resource leveling feature in MS-Project
Once a suitable network is drawn, with durations for all activities, the next step is to find out whether it meets the target completion date and what kind of flexibility exists in starting or ending these activities. In Chapter 3, we discussed about using different network diagrams for scheduling. In this chapter, we discuss how to arrive at the target completion date and how to find out the flexibility associated with starting or ending activities. We shall do this at two levels. First, we understand how to do calculations by hand, by using the precedence diagram. Then, we go ahead and discuss how to use MS-Project to do these computations. You may wonder why it is necessary to know how to do these manually. It is important to know how computations are done to fully understand the meaning of the float, early and late dates, and so on. Before going ahead with discussions related to schedule computations, let us understand the relevance of some terms (see Table 5.1).
Table 5.1 Schedule computation: Relevant terms
|
Critical Path: Critical path is the longest path through a project network. It, therefore, determines the earliest completion of the work. Free Float: The amount of time an activity can be delayed without delaying the early start date of its successor. Total Float: The amount of time an activity can be delayed without delaying the project completion date. ES: Early start LS: Late start EF: Early finish LF: Late finish |
Understanding Relevant Terms
Critical Path
Let us say that you have determined the activities, work packages, and dependencies. You have drawn the network diagram. The sponsor expects it to be finished within a specific duration. How do you find out whether it is feasible to finish within the duration with the help of the network diagram? Critical path helps you there. Once you complete the critical path analysis, you will also be able to determine the flexibility that exists in delaying some of these activities in the network. Let us look at the network diagram depicted in Figure 5.1. There are two network paths in the diagram. One is Start-A-B-C-E-End and the other is Start-A-D-E-End. The former is of 19 weeks’ duration and the longer path. Hence, this is the critical path for the network.

Figure 5.1 Sample network used for critical path computations
Float, Forward Pass, and Backward Pass
Once you find out the critical path, you will also observe that you can delay the start date or end date of activities on a noncritical path to a limited extent, without affecting the start of the successor activity or the end date of the project. As we discussed in Table 5.1, the amount of time for which you can delay an activity without delaying the start date of the successor is called free float and the amount of time for which you can delay an activity without delaying the project completion date is called total float. Total float is often known as slack and on a critical path slack is zero.
To go ahead with the computation of the total float associated with the activity, let us consider the network shown in Figure 5.1 again. The total float associated with an activity is the difference between the late start and the early start (or late finish and early finish) as mentioned in the illustration in Figure 5.2.

Figure 5.2. Float computation formulae for total float
To complete hand calculations related to total float, the first step is to compute these terms. Let us again consider the sample network diagram discussed previously Figure 5.1. Starting from A, compute the early start and early finish for the activities’ upper path in the network diagram, that is, ABCE and note these on the top corners of each box (node), as shown in Figure 5.3. Similarly, do it for the path below, that is, activities ADE. This is called forward pass. It is important to look at where the paths converge in order to correctly perform the forward pass and the backward pass.

Figure 5.3 Forward and backward pass computations for the sample network
Keeping the earliest finish as the latest finish for the last activity in the network diagram, traverse backward to compute the latest finish and start dates for all activities. This is called backward pass. Here also, be careful at nodes where the backward computations converge (like A in this case).
The path ABCE is critical path; therefore it will not have slack. Since ADE is noncritical path, it can have slack. Activity A and E are on the critical path; therefore they will not have slack. Only activity D can have total float. Slack for D is either (8−3) or (14−9), and is 5 weeks.
It is important that a project manager knows the critical path and float associated with the activities on the noncritical path. It allows for better allocation of resources. We shall discuss this in subsequent chapters.
Example Problem: Calculating Critical Path and Float
Let us consider a small project of Math Library Development, which has two modules. Note that activities are represented by tasks in MS-Project as there is no terminology called “Activity” in MS-Project.
Now let us see step by step how we can use MS-Project to find out the critical path and activity floats.
- Copy sample project file Math Lib-orginal.mpp from the Practice-Files/Ch05 folder to your working folder and rename it as Math Lib.mpp. Double click and open the project file. The file will open as shown in Figure 5.4.

Figure 5.4 Gantt Chart for Math lib Project
- Next we identify the critical path using formatting. For that, first click on the Projects tab. Now click on the Format tab and, from the Bar styles group, click Critical Path check-box. The tasks (activities) on the critical path get highlighted in red (see gray task bars in Figure 5.5).
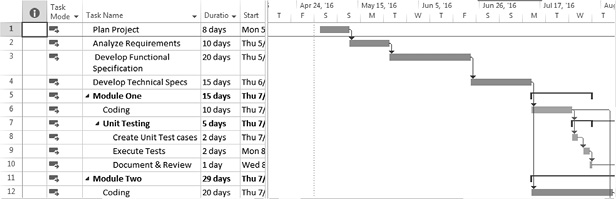
Figure 5.5 Critical path generated for the example file.
Note: Critical path gets highlighted in red (darker gray bars in picture)
- However, you may be interested to see the network diagram. Select the Task tab. In the View group, click on the arrow, to change the view (and you get a pull-down menu with different views). Select Network diagram. You will see the network diagram as shown in Figure 5.6.

Figure 5.6 Network view (partially displayed) for the example file
- Again display the Gantt Chart view. To find out the float of each task (float is also known as slack), first click on the Projects tab. Next, select the Format tab and then click the Slack check-box from the Bar Styles group. Lines indicating slack get displayed. If you move the cursor on these lines, the corresponding slack information gets highlighted (Figure 5.7).

Figure 5.7 Slack (float) computed by MS-Project for each task
- You can also insert a field indicating the slack. Double click on the title of any field in the table and select Finish Slack from the list displayed (you can start typing the word Finish.., to make your choice easier). Finish slack is the difference between the latest and earliest finishing dates of the task. Finish slack also gets displayed in the chart area. You may move the cursor on slack lines displayed in the chart area to get (flash) more information (Note: In this example, we demonstrate MS-Project features related to critical path and float, for a file without resources. However, in actual practice you will be doing this exercise for a resource loaded plan).
- Close the file using the File tab. You may save the file with a suitable name like Math lib_completed.
Resource Leveling
As you plan the schedule, you may find that the demand for resources exceeds the maximum number of available resources at times (Figure 5.8). This requires coming out with a resource-limited schedule. Resource leveling can be done in three ways. There are three options for resource leveling:

Figure 5.8 Without leveling, resource requirement may surpass the availability on some weeks
- Delay the activity, use the float
- Increase resources
- Delay the project completion date
Example Problem: Resource Leveling Using MS-Project
Let us say you have to test three modules of software, as a part of your project. The project plan has already been prepared. You have to analyze the resource overloading and level resources using MS-Project. The following steps demonstrate the same.
- Copy the file Resource-level-Start.mpp from the Practice-Files/Ch05 folder to your working directory and rename it as Resource-level. Open the project file Resource-level.mpp by double clicking on it. Observe the Gantt Chart. In case the file opens up with a different view, click on View tab Task Views group and click on the Gantt Chart. You will observe that the indicator column contains an indicator of a red person (also known as the Burning Man icon, indicating that the task has been assigned to overallocated resources)for tasks like Study Test Plan and Execute Tests subtasks (Figure 5.9).

Figure 5.9 Gantt Chart of the project before leveling
- Switch to Resource Sheet view. For this, click on the Resource Sheet button on the right-hand bottom of the screen. You will observe the project has two units of a resource called Installer. The Resource details are highlighted in red (Figure 5.10). If you move the cursor over the indicator, a message The resource is over allocated appears. (Note: The default currency gets assigned in a project file based on the country in which you do the installation of MS-Project. However, the currency used in a project, say in case of Resource Rates can be changed. To do that click on the File tab and select Options. Project Options dialog appears. Select Display tab and in the Currency Options for the Project use the dropdown Currency to assign appropriate currency.)

Figure 5.10 Resource Sheet of the project before leveling
- The extent of resource overloading can be confirmed by using the Resource Graph view (Figure 5.11). For this, click on the Resource tab and select Resource Graph from the pull-down menu in the Views group. You will observe bars crossing Peak Units available and turning red as shown in Figure 5.11 (note that the graph you view may differ slightly from the one illustrated here in the chapter, based on the zoom factor and timescale).

Figure 5.11 Resource Graph of the project before leveling
- Click on the Views tab, and in the Task Views group, click on the arrow of the Gantt Chart button and select More Views. From the More Views dialog that appears, select Leveling Gantt and click on Apply. Now you will find that task bars become thin and the file is ready for leveling. Although this step is not a must, it will help us to visualize the changes that would occur during leveling.
- Now select the Resource tab. Click on Level Resource from the Level group. You will get the Level Resource dialog (Figure 5.12). Select the Resource Tester and click on Level Now button. MS-Project creates a resource-leveled schedule (Figure 5.13).
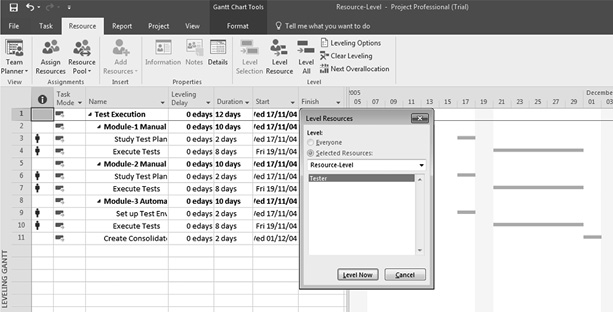
Figure 5.12 Use Level Resources dialog to select resources to be leveled in the leveling Gantt Chart

Figure 5.13 Tasks in the Gantt Chart, after leveling
Note: You can set various options to control leveling using Leveling Options button in the Level group.
Although the project end date gets shifted to a later date, you find that the Burning Man icon has disappeared from the Gantt chart. You can go to the Resource graph view of the project plan again (as explained in earlier steps) and observe how the resource leveling has been achieved (Figure 5.14). Close the file.

Figure 5.14 Resource graph after leveling
To conclude, we discussed about the Critical path and Float as a part of schedule development in this chapter. At the end, we also saw an example of achieving resource-leveled schedule using MS-Project.