
Chapter 6: Using the ACROSS Option to Create a Weekly Sales Report
Goals for Creating a Weekly Sales Report
Implementation: Creating the ODS Style Template
Obtain Calendar Grid and Merge With Sales
Place Holders for Data Not Yet Available
Introduction
Some reports are better displayed once the data is transposed. While we could use PROC TRANSPOSE, PROC REPORT provides the advantage of allowing us to simultaneously transpose the data and summarize rows. This ability is provided with PROC REPORT’s ACROSS and GROUP usage options. The variable we want transposed becomes the ACROSS variable, and the rows to be consolidated are the GROUP variables. Once the ACROSS option is applied, the variable’s values become the columns of the report.
Example: Weekly Sales Report
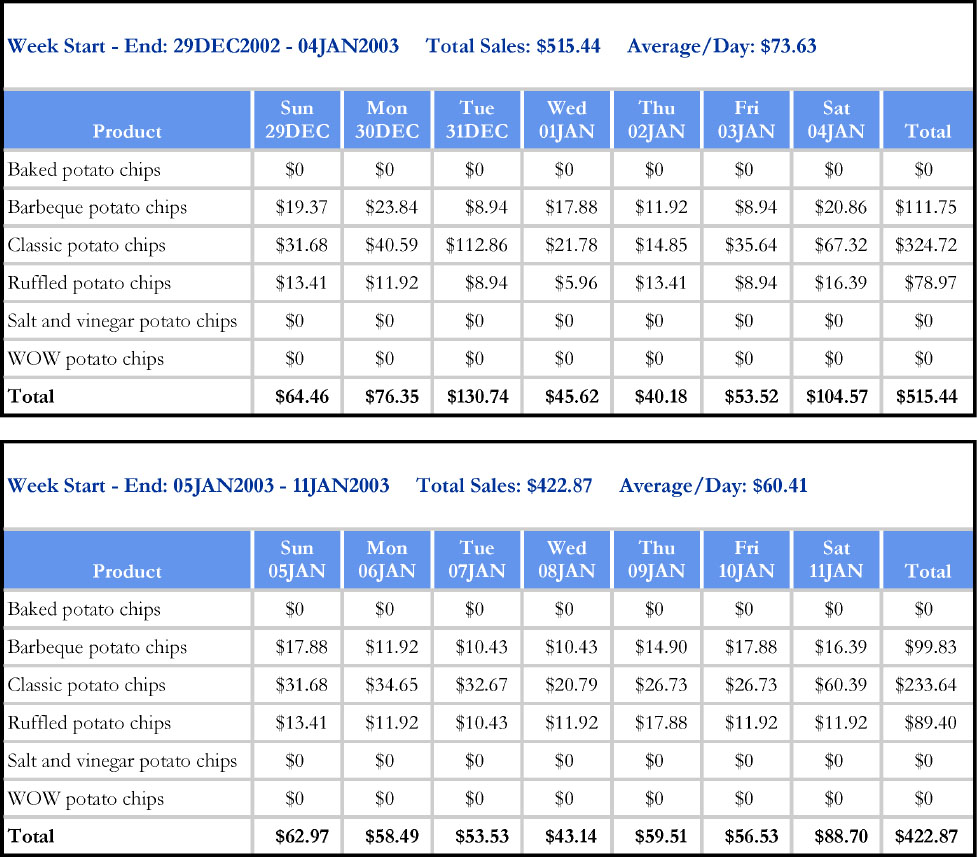
A weekly report is provided to summarize Potato Chip sales from each Sunday to Monday period. The report is in a calendar format, with each weekday and its corresponding date across the top of the table, and product types displayed as the rows. A summary line is displayed above each table that shows the period reported (week start to week end), the total sales for that week, and the average sales amount per day.
Figure 6.1 displays the first page of the report.
Figure 6.1 Partial Print of a Weekly Sales Report
Goals for Creating a Weekly Sales Report
Creating a weekly sales report requires developing a dynamic (data driven) template. Other than specifying the desired reporting period, the programmer can simply run the report weekly and the tables will populate as new data arrives.
Key Steps
Preprocessing steps include creating a data set containing the desired reporting dates and merging this with the actual sales data.
PROC REPORT is then used to:
• Transpose dates across the top
• Consolidate rows
• Create total column and rows
• Display text above each table containing summary information
Source Data
The source data is a subset of the SASHELP data set “SNACKS”. Table 6.1 displays a partial PROC PRINT of the data set. Table 6.2 displays the contents of SNACKS.
Table 6.1 Partial Print of SNACKS Data
QtySold |
Price |
Date |
Product |
13 |
1.49 |
29DEC2002 |
Barbeque potato chips |
16 |
1.49 |
30DEC2002 |
Barbeque potato chips |
6 |
1.49 |
31DEC2002 |
Barbeque potato chips |
12 |
1.49 |
01JAN2003 |
Barbeque potato chips |
8 |
1.49 |
02JAN2003 |
Barbeque potato chips |
6 |
1.49 |
03JAN2003 |
Barbeque potato chips |
14 |
1.49 |
04JAN2003 |
Barbeque potato chips |
12 |
1.49 |
05JAN2003 |
Barbeque potato chips |
8 |
1.49 |
06JAN2003 |
Barbeque potato chips |
7 |
1.49 |
07JAN2003 |
Barbeque potato chips |
7 |
1.49 |
08JAN2003 |
Barbeque potato chips |
10 |
1.49 |
09JAN2003 |
Barbeque potato chips |
12 |
1.49 |
10JAN2003 |
Barbeque potato chips |
11 |
1.49 |
11JAN2003 |
Barbeque potato chips |
11 |
1.49 |
12JAN2003 |
Barbeque potato chips |
6 |
1.49 |
13JAN2003 |
Barbeque potato chips |
9 |
1.49 |
14JAN2003 |
Barbeque potato chips |
6 |
1.49 |
15JAN2003 |
Barbeque potato chips |
17 |
1.49 |
16JAN2003 |
Barbeque potato chips |
Table 6.2 Contents of SNACKS Data
# |
Variable |
Type |
Len |
Format |
Label |
1 |
QtySold |
Num |
8 |
Quantity sold |
|
2 |
Price |
Num |
8 |
Retail price of product |
|
3 |
Date |
Num |
8 |
DATE9. |
Date of sale |
4 |
Product |
Char |
40 |
Product name |
ODS Style Template Used
A custom ODS style template is created. As a start, the ODS style template “SASWEB” is used as the parent style. The modified template is named “SASWEBR.”
Programs Used
The program for this chapter is titled CH6CAL.SAS.
Implementation: Creating the ODS Style Template
We make slight modifications to the SAS-supplied “SASWEB” ODS style template and name the new template “SASWEBR”.
Proc Template Code
** Make Modifications to SASWEB ODS Style Template;
proc template;
define style styles.saswebr;
parent=styles.sasweb;
class fonts /
"docfont" = ("Garamond", 12 pt) /* Data in Table Columns */
"EmphasisFont" = ("Garamond",12.5 pt, Bold) /* Line Statements */
"headingfont" = ("Garamond", 12 pt, Bold) ; /* Column Headers */
class table /
borderwidth=2 pt
cellspacing=1.97 pt;
class body /
bottommargin = .25in
topmargin = .25in
rightmargin = .75in
leftmargin = .75in;
** Apply Emphasis Font to Line Statements;
class NoteContent /
font=fonts("EmphasisFont");
end;
run;
Figure 6.2 shows the PROC REPORT output using the SASWEB template, or, prior to making PROC TEMPLATE modifications.
Figure 6.2 PROC REPORT Output Prior to Making PROC TEMPLATE Modifications
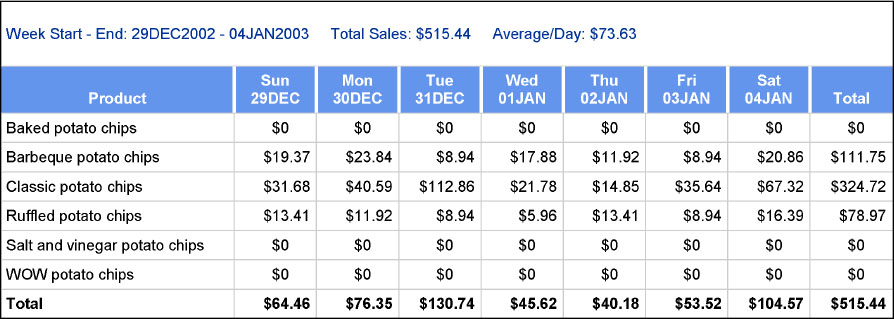
Figure 6.3 shows the PROC REPORT output using the SASWEBR template, or, after making PROC TEMPLATE modifications.
Figure 6.3 PROC REPORT Output After Making PROC TEMPLATE Modifications
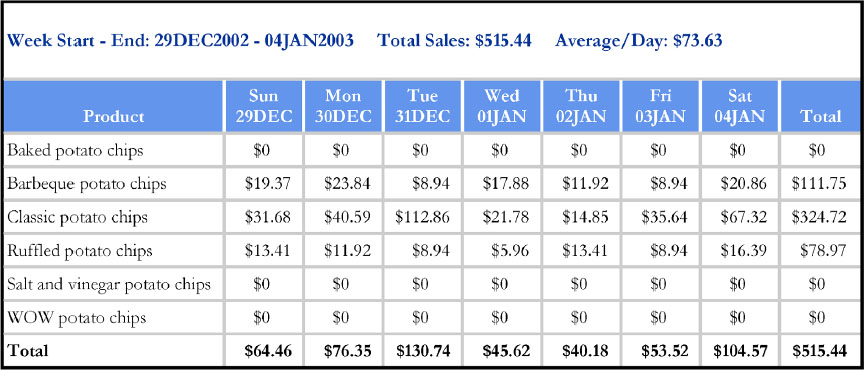
Fonts are modified for the Table, Header, and NoteContent portions of the report. The “NoteContent” modifications allow us to obtain the desired font for the COMPUTE block lines (the text above the table) and summary rows (“Total” rows).
The table borders are made wider with the borderwidth and cellspacing style attributes, providing greater distinction between tables and data cells than occurs with the default SASWEB ODS Style Template.
• The borderwidth (see table frame) is widened to 2 pt width.
• The space between cells in the inner table is increased to 1.97 pt width (kept slightly smaller than the white left and right borderwidths of the Day/Date headers so the grey background color does not overtake the white).
Obtain Calendar Grid and Merge With Sales
After the style template is developed, we need to create placeholder dates for the desired reporting period. For this example, the reports will cover December 29, 2002 through April 5, 2003. Once the start and end dates of the reporting period are specified (via macro variables), a CALDATES data set is created to contain a record for each date of the period. CALDATES is then merged with the sales data set (SNACKS).
** Identify Period to be Reported; ➊
%let startdt='29Dec2002'D;
%let enddt ='05Apr2003'D;
** Subset Source Data; ➋
data sales;
set sashelp.snacks(keep=Product Date QtySold Price
where=(&startdt <= date <= &enddt and
find(product,'potato','i')>0));
run;
** Create Calendar Data Set; ➌
data caldates;
do date = &startdt to &enddt by 1;
format date wkstart wkend date9.;
chday = put(date,weekdate3.);
wkstart=intnx('week',date,0);
wkend =intnx('week',date,1)-1;
output;
end;
run;
** Merge Sales with Caldates; ➍
proc sort data=sales;
by date;
run;
proc sort data=caldates;
by date;
run;
data sales2;
length wksten $60;
merge sales
caldates;
by date;
** Derive WKSTEN and SALEAMT Variables;
wksten =
catx(' - ',strip(put(wkstart,date9.)),strip(put(wkend,date9.)));
if nmiss(QtySold,price)=0 then saleamt = QtySold * price;
run;
➊ Macro variables are created to specify start and end dates for the report. In this case, the reporting period is from December 29, 2002 to April 5, 2003.
➋ The SAS-supplied data set sashelp.snacks is subset on dates between Dec 29, 2002 through April 05, 2003 and snacks containing the word “potato.” The “i” argument tells SAS to ignore case when searching for the string “potato”.
➌ Via a DO loop, the following variables are derived and a record is output for each date:
• DATE – Dates will range from our Start Date to our End Date, as specified in the DO loop with the macro variables &STARTDT and &ENDDT. Although we may not yet have sales data all the way through &ENDDT, we create the template that will be populated when data becomes available.
• CHDAY – The three-letter abbreviation for the day that the date falls on (Sun, Mon, Tue, Wed…)
• WKSTART – Each week’s Start Date (Start ‘day’ is always Sunday).
• WKEND – Each week’s End Date (End ‘day’ is always Saturday).
• The INTNX function is used to determine Week Start and End Dates. The default WEEK Start interval for INTNX is Sunday, so no shift in days is needed.
∘ Using the date of Tuesday, December 31, 2002 as an example, wkstart = intnx('week','31dec2002'd,0);
– translates into: “Determine the date of the start of the week (Sunday) that is 0 weeks from the week of December 31, 2002. The result is Sunday, December 29, 2002.”
∘ Using the date of Tuesday, December 31, 2002, as an example, wkend = intnx('week','31dec2002'd,1) - 1;
– translates into: “Determine the date of the start of the week (Sunday) that is 1 week after the week of December 31, 2002, minus 1 day. The result is Saturday, January 4, 2003.”
Table 6.3 displays an example of the calendar data.
Table 6.3 Partial Print of CALENDAR Data
Date |
wkstart |
wkend |
chday |
29DEC2002 |
29DEC2002 |
04JAN2003 |
Sun |
30DEC2002 |
29DEC2002 |
04JAN2003 |
Mon |
31DEC2002 |
29DEC2002 |
04JAN2003 |
Tue |
01JAN2003 |
29DEC2002 |
04JAN2003 |
Wed |
02JAN2003 |
29DEC2002 |
04JAN2003 |
Thu |
03JAN2003 |
29DEC2002 |
04JAN2003 |
Fri |
04JAN2003 |
29DEC2002 |
04JAN2003 |
Sat |
05JAN2003 |
05JAN2003 |
11JAN2003 |
Sun |
06JAN2003 |
05JAN2003 |
11JAN2003 |
Mon |
07JAN2003 |
05JAN2003 |
11JAN2003 |
Tue |
08JAN2003 |
05JAN2003 |
11JAN2003 |
Wed |
09JAN2003 |
05JAN2003 |
11JAN2003 |
Thu |
10JAN2003 |
05JAN2003 |
11JAN2003 |
Fri |
11JAN2003 |
05JAN2003 |
11JAN2003 |
Sat |
12JAN2003 |
12JAN2003 |
18JAN2003 |
Sun |
13JAN2003 |
12JAN2003 |
18JAN2003 |
Mon |
14JAN2003 |
12JAN2003 |
18JAN2003 |
Tue |
15JAN2003 |
12JAN2003 |
18JAN2003 |
Wed |
16JAN2003 |
12JAN2003 |
18JAN2003 |
Thu |
17JAN2003 |
12JAN2003 |
18JAN2003 |
Fri |
18JAN2003 |
12JAN2003 |
18JAN2003 |
Sat |
➍ Sales data and Calendar data are merged by DATE. Two new variables are derived. WKSTEN, contains the header to be place above each week, for example, “29DEC2002 - 04JAN2003.” SALEAMT multiplies QtySold times Price to arrive at a total sales amount for each record.
Table 6.4 displays a partial print of the merged data set.
Table 6.4 Partial Print of Combined CALENDAR and SALES Data
Date |
wkstart |
wkend |
chday |
wksten |
Product |
saleamt |
QtySold |
Price |
29DEC2002 |
29DEC2002 |
04JAN2003 |
Sun |
29DEC2002 - 04JAN2003 |
Baked potato chips |
0.00 |
0 |
1.99 |
29DEC2002 |
29DEC2002 |
04JAN2003 |
Sun |
29DEC2002 - 04JAN2003 |
Barbeque potato chips |
19.37 |
13 |
1.49 |
29DEC2002 |
29DEC2002 |
04JAN2003 |
Sun |
29DEC2002 - 04JAN2003 |
Classic potato chips |
31.68 |
32 |
0.99 |
29DEC2002 |
29DEC2002 |
04JAN2003 |
Sun |
29DEC2002 - 04JAN2003 |
Ruffled potato chips |
13.41 |
9 |
1.49 |
29DEC2002 |
29DEC2002 |
04JAN2003 |
Sun |
29DEC2002 - 04JAN2003 |
Salt and vinegar potato chips |
0.00 |
0 |
2.49 |
29DEC2002 |
29DEC2002 |
04JAN2003 |
Sun |
29DEC2002 - 04JAN2003 |
WOW potato chips |
0.00 |
0 |
2.99 |
30DEC2002 |
29DEC2002 |
04JAN2003 |
Mon |
29DEC2002 - 04JAN2003 |
Baked potato chips |
0.00 |
0 |
1.99 |
30DEC2002 |
29DEC2002 |
04JAN2003 |
Mon |
29DEC2002 - 04JAN2003 |
Barbeque potato chips |
23.84 |
16 |
1.49 |
30DEC2002 |
29DEC2002 |
04JAN2003 |
Mon |
29DEC2002 - 04JAN2003 |
Classic potato chips |
40.59 |
41 |
0.99 |
30DEC2002 |
29DEC2002 |
04JAN2003 |
Mon |
29DEC2002 - 04JAN2003 |
Ruffled potato chips |
11.92 |
8 |
1.49 |
30DEC2002 |
29DEC2002 |
04JAN2003 |
Mon |
29DEC2002 - 04JAN2003 |
Salt and vinegar potato chips |
0.00 |
0 |
2.49 |
30DEC2002 |
29DEC2002 |
04JAN2003 |
Mon |
29DEC2002 - 04JAN2003 |
WOW potato chips |
0.00 |
0 |
2.99 |
31DEC2002 |
29DEC2002 |
04JAN2003 |
Tue |
29DEC2002 - 04JAN2003 |
Baked potato chips |
0.00 |
0 |
1.99 |
31DEC2002 |
29DEC2002 |
04JAN2003 |
Tue |
29DEC2002 - 04JAN2003 |
Barbeque potato chips |
8.94 |
6 |
1.49 |
31DEC2002 |
29DEC2002 |
04JAN2003 |
Tue |
29DEC2002 - 04JAN2003 |
Classic potato chips |
112.86 |
114 |
0.99 |
31DEC2002 |
29DEC2002 |
04JAN2003 |
Tue |
29DEC2002 - 04JAN2003 |
Ruffled potato chips |
8.94 |
6 |
1.49 |
Produce the Report
Some highlights of what is accomplished via the REPORT procedure include:
• Picture formats are applied to style the column header appearance (e.g. Sun 29DEC) and the sale amounts in the table cells (e.g., $0 rather than $0.00, “*” rather than a blank).
• The report is run BY WKSTART (each week’s Start Date).
• DATE is defined as an ACROSS variable.
• Total rows are obtained with a BREAK AFTER each new WKSTART.
• A Total column is derived as a COMPUTEd variable.
• A summary line displayed above each page consists of a text variable that contains concatenated information from both report and temporary variables.
Code for Producing the Report
** Create Dollar and Date Picture Formats;
proc format;
picture saleamt (round)
. = "*"
0 = "$0" (noedit)
0< - high = "000,000,009.00" (prefix="$"); ➊
picture datefmt (default=100)
low-high ='%a %0d%b' (datatype=date); ➋
run;
** Macro Variables for COMPUTE Block Array to Align Numbers and
Asterisks in Cells;
%let _c4_ = _c4_;
%let _c5_ = _c5_;
%let _c6_ = _c6_;
%let _c7_ = _c7_;
%let _c8_ = _c8_;
%let _c9_ = _c9_;
%let _c10_ = _c10_;
** Specify ODS Information;
ods escapechar='^';
options nonumber nobyline nodate orientation=landscape; ➌
ods _all_ close;
ods rtf file='C:UsersUserMy DocumentsSASBOOKProgramsCh6Across.rtf' style=saswebr STARTPAGE=NO bodytitle; ➍
** REPORT Procedure;
proc report data=sales2 nowd nocenter split='|' missing
out=chkdat
style(column)=[cellwidth=.7 in];
by wkstart; ➎
column wkstart=wkstart2 ("Product" product) wksten date, saleamt
("Total" total); ➏
** DEFINE Specifications; ➐
define wksten / group ' ' noprint;
define wkstart2 / group ' ' noprint;
define date / " " across format=datefmt. order=internal
style(header)=[borderleftwidth=2 pt
borderleftcolor=white
borderrightwidth=2 pt
borderrightcolor=white];
define saleamt / " " analysis format=saleamt.;
define product / group ' ' style(column)=[cellwidth=2 in];
define total / "" computed format=saleamt.
style(column)=[just=d];
** COMPUTE BLOCKS;
** Create Column Variable TOTAL; ➑
compute total;
if product ne ' ' then
do;
** Determine number of non-missing days with sales data;
numday = n(_c4_,_c5_,_c6_,_c7_,_c8_,_c9_,_c10_);
** Get total if at least one day has sales;
if numday>=1
then total = sum(_c4_,_c5_, _c6_,_c7_,_c8_,_c9_,_c10_);
end;
** If all data is missing hide the asterisks by applying white
font color;
if total=. then
call define(_row_,'style','style={foreground=white}'),
endcomp;
** Obtain Total Rows;
break after wkstart / summarize; ➒
** Initialize Temporary Variable for Later Use; ➓
compute BEFORE wkstart;
dstotal=total;
endcomp;
** Summarize Sales Data Above Page (Since STARTPAGE=NO, multiple
REPORT pages appear on one RTF page); ![]()
compute before _page_ /style={just=l};
length text $120;
if dstotal ne . then
do;
text= 'Week Start - End: ' || strip(wksten)
|| ' Total Sales: '
|| strip(put(dstotal,saleamt.))
|| ' Average/Day: '
|| strip(put(dstotal/numday,saleamt.));
** Additional Note for Weeks with Some Missing Data;
if 1 <= numday < 7 then text = strip(text)
|| "^n* = Data Not Yet Available";
end;
** Above Page Text for Weeks with All Missing Data;
else
do;
text= 'Week Start - End: ' || strip(wksten)
|| ' Total Sales: '
|| "Data Not Yet Available";
end;
line ' ' ;
line text $120.;
line ' ' ;
endcomp;
** Fill in Product Column for Total Row and Conditionally Format; ![]()
compute product /char length=30;
if product ne ' ' then product=product;
else if _break_='wkstart' then
do;
product='Total';
call define(_row_,'style','style={font_weight=bold}'),
end;
endcomp;
** Decimal Align Numbers and Center Align Asterisks; ![]()
compute date;
array colname (7) $ ("&_c4_" "&_c5_" "&_c6_" "&_c7_" "&_c8_"
"&_c9_" "&_c10_");
array coln (7) _c4_ _c5_ _c6_ _c7_ _c8_
_c9_ _c10_;
do i=1 to dim(colname);
if coln(i) > .z then
call define(colname(i),'style','style={just=d}'),
else call define(colname(i),'style','style={just=c}'),
end;
endcomp;
run;
ods rtf close;
ods html;
Picture formats are used to create templates for printing dollar amounts and dates.
Two types of pictures are applied for formatting the dollar amounts.
• Digit selectors - these are numeric characters (0 through 9) that correspond to positions for numeric variables. A nonzero versus a zero digit selector basically tells SAS whether leading zeros are applied.
∘ Nonzero digit selectors print leading zeros. We use 9 as the nonzero digit selector in the SALEAMT format.
∘ Zero digit selectors do not print leading zeros.
• Message characters – these are nonnumeric characters that print as specified in the picture.
➊ For the dollar amounts, we want:
• Values rounded. The ROUND option rounds the sales amount to the nearest decimal value given in the format specification, before formatting. This prevents truncation of the values.
• Missing values printed as “*”. The “*” is a “message character” and the format prints as it appears in the picture format.
• “$0.00” printed as “$0”. The NOEDIT option tells SAS to treat $0 as a message character and the format should print as it appears in this assignment. Without the NOEDIT option, numbers are treated as digit selectors (digit placeholders) and “$0.00” values would display as blanks in the report.
• Values greater than 0 are assigned the picture "000,000,009.00". The PREFIX= statement adds a US dollar sign before the sales amount. We make the format picture wide enough to contain the sales amounts and the “$” prefix.
• The 0s and 9s are the digit selectors and these are important in designating the desired level of leading zeros. We do not want leading zeros in this report.
∘ A helpful reminder about digit selectors is offered in a paper by Andrew Karp, “Getting in to the Picture (Format)” who sources Pete Lund with the saying “nines print zeros and zeros print blanks.”
Table 6.5 demonstrates how the amounts 19.37 and 5.96 would display after various picture formats are applied.
Table 6.5 Application of Picture Formats
Picture Format |
|
Original: 19.37 |
Original: 5.96 |
009.99 |
Displays number as -> |
19.37 |
5.96 |
099.99 |
Displays number as -> |
19.37 |
05.96 |
999.99 |
Displays number as -> |
019.37 |
005.96 |
➋ For the date format, we want dates to appear in a form such as “Sun 05JAN”. The length for the format is set with DEFAULT= option. The (DATATYPE=DATE) is necessary to create a date format.
• %a specifies an abbreviated (3-letter) day (Mon, Tue, Wed).
• %d specifies the day of the month, and the 0 before the d adds a leading zero to numbers < 10.
• %b specifies the abbreviated month name (DEC, JAN, FEB).
➌ The NOBYLINE option is specified because we will create custom headers within each BY table.
➍ The ODS style template SASWEBR is selected. STARTPAGE=NO prevents each BY WKSTART (Week Start) table from being printed on a separate page. Note that we have no titles or footnotes for this report. The bodytitle option, which specifies to put titles and footnotes directly above or below a table, is used here simply to create more space on the page for the tables.
➎ The BY statement gives us separate tables for each week rather than one very large table.
➏ Because WKSTART is used as a BY variable, an alias for WKSTART (named WKSTART2) is created so we can GROUP the variable and then use it for BREAK AFTER and COMPUTE BEFORE statements. If we did not create the alias, SAS would automatically create an alias and add log NOTEs.
SALEAMT follows the comma after the ACROSS variable and it is these values that are reported in the cells under the DATE values. If multiple variables were to be nested under DATE, these would be enclosed in a parentheses immediately following the comma. For example, if we wanted to nest TOTAL as well as SALEAMT, the code would read
column wkstart=wkstart2 ("Product" product) wksten
date, (saleamt total);
This is not what we want. In this example, TOTAL is a standalone column (i.e. not nested). The parentheses are applied only to create the header “Total” for the TOTAL column.
column wkstart=wkstart2 ("Product" product) wksten
date, saleamt ("Total" total);
➐ DEFINE SECTION
Since we want the sales to be summed, all of the character variables are defined as GROUP variables. The SALEAMT column is defined as ANALYSIS, for which SUM is the default statistic. The NOPRINT option is applied to variables used only for the purpose of grouping, breaking, or computing. Table 6.5 provides more explanation on each DEFINE statement.
Table 6.5 Descriptions of DEFINE Statements
Statement |
Use |
define wksten / group ' ' noprint; |
Variable used in the compute before _page_ line statement
|
define wkstart2 / group ' ' noprint; |
Alias created for ability to break and compute before/after WKSTART
|
define date / " " across format=datefmt. order=internal |
DATE is our across variable. Each value of DATE within the BY period will have its own column. The picture format DATEFMT is applied to achieve the desired headers. The ORDER is specified as internal because we want the dates displayed in chronological order. We want the left and right borders for the DATE portion of the header to be white. Therefore, header style overrides are applied in the DATE DEFINE statement.
|
define saleamt / " " analysis format=saleamt. |
This is our Sales amount variable to be summed and printed according to the SALEAMT picture format |
define product / group ' ' style(column)=[cellwidth=2 in]; |
The Product column to be GROUPED and printed |
define total / "" computed format=saleamt. style(column)=[just=d];
|
The Computed Total column sums across days displayed at the rightmost of the report |
Note that as an ACROSS variable, DATE will be transposed by PROC REPORT so that individual date values become columns. In the case of ACROSS variables, the column names take the form _Cn_, where n is the absolute column number. Our seven date/day values become _C4_ through _C10_, for columns 4 through 10. These are the column names that need to be referenced in any compute block.
Table 6.6 shows a partial print of the PROC REPORT output data set. Note that the BY variable (wkstart) is not counted in the column numbers in the output data set (see gray row in Table 6.6).
Table 6.6 Partial Print (Observations and Variables) of PROC REPORT Data Set
BY VARIABLE |
Column 1 |
Column 2 |
Column 3 |
Column 4 (Sun 29DEC) |
Column 5 (Mon 30DEC) |
Column 6 (Tue 31DEC) |
wkstart |
wkstart2 |
Product |
wksten |
_C4_ |
_C5_ |
_C6_ |
29DEC2002 |
29DEC2002 |
Total |
|
64.46 |
76.35 |
130.74 |
29DEC2002 |
29DEC2002 |
Baked potato chips |
29DEC2002 - 04JAN2003 |
0.00 |
0.00 |
0.00 |
29DEC2002 |
29DEC2002 |
Baked potato chips |
29DEC2002 - 04JAN2003 |
0.00 |
0.00 |
0.00 |
29DEC2002 |
29DEC2002 |
Barbeque potato chips |
29DEC2002 - 04JAN2003 |
19.37 |
23.84 |
8.94 |
29DEC2002 |
29DEC2002 |
Classic potato chips |
29DEC2002 - 04JAN2003 |
31.68 |
40.59 |
112.86 |
29DEC2002 |
29DEC2002 |
Ruffled potato chips |
29DEC2002 - 04JAN2003 |
13.41 |
11.92 |
8.94 |
29DEC2002 |
29DEC2002 |
Salt and vinegar potato chips |
29DEC2002 - 04JAN2003 |
0.00 |
0.00 |
0.00 |
29DEC2002 |
29DEC2002 |
WOW potato chips |
29DEC2002 - 04JAN2003 |
0.00 |
0.00 |
0.00 |
➑ The COMPUTED column TOTAL, containing the weekly sales sum is created. A temporary variable, NUMDAY, is created to obtain the number of days with non-missing sales data. A TOTAL is obtained if at least one date (NUMDAY >= 1) in the row has sales. For cases where a week has no data, i.e. where TOTAL = ., a white foreground is applied to turn the asterisks white so they do not show in the table.
➒ The BREAK after WKSTART along with the summarize option creates a TOTAL row for each weekly reporting period.
➓ COMPUTE BEFORE WKSTART initializes the temporary variable DSTOTAL to equal TOTAL before each new week start. The DSTOTAL value will be carried forward due to temporary variables’ automatic retain property. The DSTOTAL information is used for the summary line above each table.
![]() The COMPUTE BEFORE _PAGE_ block produces the summary information above each page. Recall that multiple REPORT pages are placed on one page of the report because we requested STARTPAGE=NO in the ODS RTF statement.
The COMPUTE BEFORE _PAGE_ block produces the summary information above each page. Recall that multiple REPORT pages are placed on one page of the report because we requested STARTPAGE=NO in the ODS RTF statement.
We use the DSTOTAL variable we created in the COMPUTE BEFORE WKSTART block, and the NUMDAY variable created in the COMPUTE TOTAL block to determine what text will display above each page.
• If there is a sales total for that week, the temporary variable TEXT will contain the start and end date information along with Total and Average Sales. For example:
“Week Start - End: 29DEC2002 04JAN2003 Total Sales: $515.44 Average/Day: $73.63”
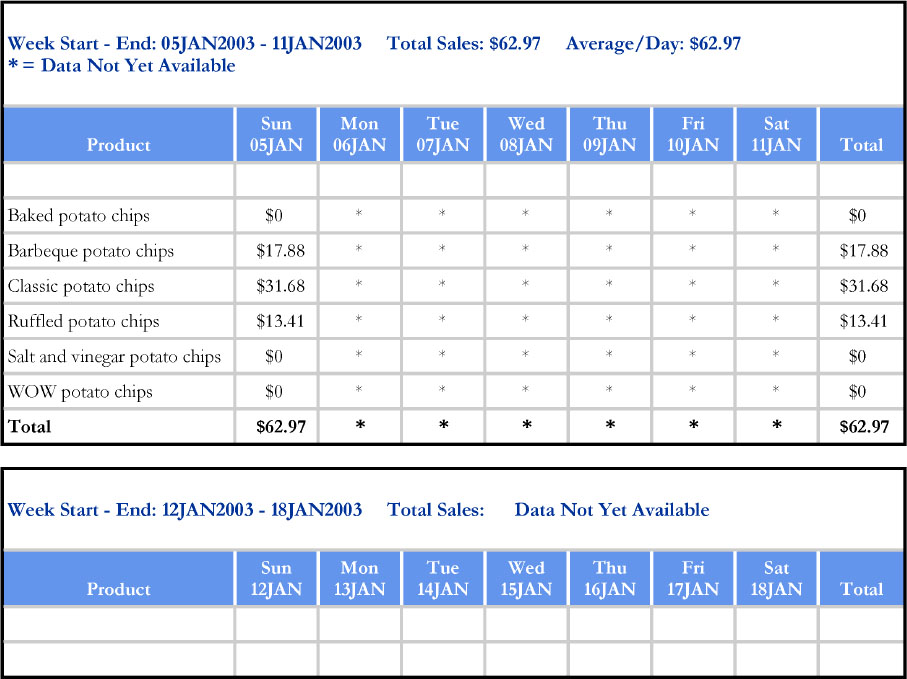
• If a given week has some missing sales, an asterisk will appear in the missing data cell and the text “* = Data Not Yet Available” will become an additional line of header text using our designated escape character with the newline function (^n). (See Figure 6.4 first report)
• If a given week has no sales data yet, TEXT will contain only the start and end date information, along with the note “Data Not Yet Available.” (See Figure 6.4 second report)
The temporary variables DSTOTAL and NUMDAY are used to populate the Total Sales and Average/Day amounts, where Average/Day = DSTOTAL/NUMDAY. The picture format SALEAMT is applied to these character strings.
![]() The report variable PRODUCT already exists, and we want to keep the existing values for the detail rows. The purpose of this compute block is to assign a value of ‘Total’ for the summary row that we obtained with the summarize option. This assignment is made specifically “if _break_='wkstart' .” Table 6.7 displays a partial PRINT of the PROC REPORT data set.
The report variable PRODUCT already exists, and we want to keep the existing values for the detail rows. The purpose of this compute block is to assign a value of ‘Total’ for the summary row that we obtained with the summarize option. This assignment is made specifically “if _break_='wkstart' .” Table 6.7 displays a partial PRINT of the PROC REPORT data set.
Table 6.7 Partial Print of PROC REPORT Data Set Showing _BREAK_ Column and Total Rows
Wkstart |
wkstart2 |
Product |
wksten |
_Cn_ Columns… |
total |
_BREAK_ |
29DEC2002 |
29DEC2002 |
Total |
515.44 |
wkstart |
||
29DEC2002 |
29DEC2002 |
Baked potato chips |
29DEC2002 - 04JAN2003 |
0.00 |
_PAGE_ |
|
29DEC2002 |
29DEC2002 |
Baked potato chips |
29DEC2002 - 04JAN2003 |
0.00 |
||
29DEC2002 |
29DEC2002 |
Barbeque potato chips |
29DEC2002 - 04JAN2003 |
111.75 |
||
29DEC2002 |
29DEC2002 |
Classic potato chips |
29DEC2002 - 04JAN2003 |
324.72 |
||
29DEC2002 |
29DEC2002 |
Ruffled potato chips |
29DEC2002 - 04JAN2003 |
78.97 |
||
29DEC2002 |
29DEC2002 |
Salt and vinegar potato chips |
29DEC2002 - 04JAN2003 |
0.00 |
||
29DEC2002 |
29DEC2002 |
WOW potato chips |
29DEC2002 - 04JAN2003 |
0.00 |
||
29DEC2002 |
29DEC2002 |
Total |
515.44 |
wkstart |
||
05JAN2003 |
05JAN2003 |
Total |
62.97 |
wkstart |
||
05JAN2003 |
05JAN2003 |
05JAN2003 - 11JAN2003 |
. |
_PAGE_ |
![]() We want decimal alignment for numbers, and center alignment for asterisks. CALL DEFINE statements are used to conditionally apply the desired alignment. An array is used so we do not need to write separate IF-THEN-ELSE sections for each DATE column (_C4_ through _C10_).
We want decimal alignment for numbers, and center alignment for asterisks. CALL DEFINE statements are used to conditionally apply the desired alignment. An array is used so we do not need to write separate IF-THEN-ELSE sections for each DATE column (_C4_ through _C10_).
Place Holders for Data Not Yet Available
The program is set up to put an asterisk (“*”) in empty cells, if one or more of the date columns in a given week can be populated with sales data. If there is no data for the entire week, the note “Data Not Yet Available” is simply printed above the table rather than populating the entire table with asterisks.
Figure 6.4 displays what our tables would have looked like if we only had sales data through 05JAN.
Figure 6.4 Display for Data Not Yet Available
Chapter 6 Summary
This chapter demonstrated how to create a weekly sales report in a calendar format, using PROC REPORT ACROSS and GROUP usage options.
• A dynamic reporting program was set up so that only start and end dates need specification for a given reporting period. The programmer can then run each weekly report without programming modifications until the next reporting period.
• The start and end dates indicate the reporting period for which the calendar data set should create records, and the period on which the sales data set should be subset.
Some other highlights of this chapter included:
• The calendar data was merged with the sales data
• PROC REPORT steps included:
∘ Specifying Date as the ACROSS variable and grouping other incoming variables
∘ Picture formats were used for the presentation of dates across the top of the report, and dollar amounts within the cells, including the unavailable sales data
∘ A weekly (per product) Total column variable was created by a COMPUTE block
∘ Total rows were created via a BREAK statement to provide each daily and the weekly sales total
∘ Key summary amounts were also displayed (via a LINE statement) above each weekly table