Interpretation of Financial Statements
Financial statements highlight more about a company than what it earned, what it owes, and the historical value of its assets. Thus to demonstrate the economics of a company, you need to study and deeply analyze its financial statements.
It is important to note that no individual figures on a financial statement are useful in isolation. Let us assume that Company A1’s income statement indicates a net income of $100,000 and Company B2’s a net income of $300,000. It is apparent that Company B2 made twice the profit of Company A1.
However, does that really mean that Company B2 is twice as profitable? Is it operated more efficiently? Would you want to invest in Company B2 rather than Company A1? What if we know that Company A1 had assets of $400,000 and Company B2 had assets of $3,000,000?
We can clearly see that Company A1 had a return on assets (ROA) of 25 percent ($100,000 ÷ $400,000 = 0.25) and Company B2 a return of only 10 percent ($300,000 ÷ $3,000,000 = 0.10). This basic analysis changes the entire picture of the company’s performances noticeably and suggests a difference between profit and profitability, see the table that follows.

Company B2 made twice the profit but it was less than half as profitable as measured by ROA. Why? The ratio suggests that it used its assets less efficiently than in comparison to Company A1. This simple ratio was useful in providing us with a deeper understanding of these two companies.
7.1 Ratio Analysis
Ratios express a relationship between items in the financial statements that can be quantified, although we are still not in a position to undertake informed judgments about the operation or financial wellbeing of a company. To further our analysis and understanding of the company, we need to compare the results of our computations with a series of benchmarks. Commonly we will use four benchmarks: past performance of the company (i.e., horizontal/trend analysis), performance of leading or star companies in the same industry, industry averages, and a pre-set targets or Key Performance Indicators (KPIs), i.e., we are comparing.
Trend analysis compares the current year’s results with past years’ results and is useful in highlighting the direction, rate, and extent of trends. It allows us to compare trends in related items in the financial statements. For example, we can compare the rate of change in purchases with the rate of change in accounts payable which would normally change at approximately the same rate. If the rate of change in accounts payable is significantly greater than the rate of change in purchases, we should ask why. Perhaps the company is experiencing a cash flow problem and is taking longer to pay its suppliers or it has found new suppliers who are offering more favorable credit terms.
If we are comparing current results with those of the past several years, it is important that we exclude those years where there were abnormal events such as a workers’ strike or severe weather conditions which badly affected the company. Otherwise, the data are likely to be distorted and comparisons will be worthless if not disingenuous.
When we compare the results of one company with others, they should be in the same industry and be similar in size. The local company with 12 employees that makes computer hardware and Dell are in the same industry but not comparable. The difference in their size makes their financial statements too disparate for comparison.
Ideally we would want comparable companies to use similar accounting methods which can be gauged by reviewing the notes to their financial statements. Hence, if both companies have large closing inventory balances and one company uses FIFO and the other LIFO to value their closing inventory, they may not be comparable without initially making changes.
If we benchmark our results against KPIs, we need to understand how they were established and ensure that they are specific, measureable, achievable, realistic, and timely (SMART).
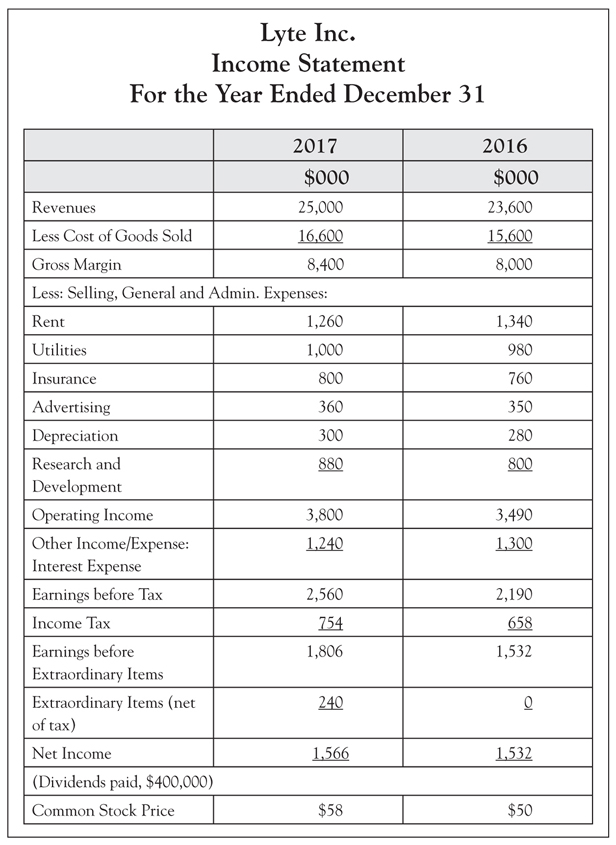
To further illustrate liquidity, financial leverage, activity, and profitability ratios, we will use the financial statements of Lyte Inc:

Liquidity ratios are designed to measure a company’s ability to honor its current and ongoing financial commitments such as paying short-term creditors, meeting pay-roll, and maintaining sufficient inventory.
Current ratio = current assets ÷ current liabilities
Current assets can be usually converted into cash or are consumed during a company’s normal accounting cycle. Current liabilities are obligations that are expected to be fulfilled with the use of current assets within one year or the firm’s normal accounting cycle. As a firm normally finances its current liabilities from current assets, there is an important relationship between the two. Thus, the higher the current ratio, the more liquid the company, i.e., the easier it will be for the company to honor its current financial commitments.
On the other hand being too, liquid namely having too much cash, a growing accounts receivable balance and too much inventory are not necessarily sound business. A large cash/bank balance suggests that it is not earning a very good return. A large accounts receivable indicates that a firm is owed a lot of money, some of which may go bad, and a large closing inventory may mean slow moving or obsolete inventory that is not being turned into cash.
A “good” current ratio is dependent on the nature of the company. So a ratio of 1.5:1 means a company has 1.5 times more current assets than its current liabilities. If a company can consistently forecast cash inflows and outflows, it may not need a high current ratio. Thus, it is not surprising that a company’s suppliers and short-term lenders are especially interested in its liquidity. If a company does not have satisfactory liquidity, it will probably have trouble paying for inventory and find that suppliers are not willing to extend credit and only conduct business on a cash-on-delivery (C.O.D.) basis. The current ratio for Lyte Inc. in 2017 and 2016 is detailed in the table that follows:

The current ratio has improved because Lyte Inc. has more cash, less inventory, but higher accounts receivable and prepaid expenses in comparison with 2016.
Quick ratio = “quick assets” ÷ current liabilities
This ratio is also known as the acid–test ratio, since it is the acid–test of a company’s liquidity. Quick assets include cash, accounts receivable, and short-term marketable securities, i.e., those assets that can quickly be turned into cash and used to pay current liabilities. Inventory and prepaid expenses (e.g., prepaid rent) are excluded from the numerator because they are not necessarily liquid. For example, to raise cash quickly by selling inventory may require a significant reduction in prices, and rent paid in advance will not usually be refunded.
According to most analysts, a quick ratio of 1:1 is adequate for most companies. The quick ratio for Lyte Inc. in 2017 and 2016 is detailed in the table that follows:

The quick ratio has improved because Lyte Inc. has more cash, in comparison with 2016 and is closer to the 1:1 target.
Another measure of liquidity is not a ratio and is known as working capital. Working capital = current assets – current liabilities. Working capital is the surplus of current assets over current liabilities, and the excess is considered as a cushion. This cushion is vital for a company to giving it, enough current assets to satisfy its current obligations and to cover potential contingencies and uncertainties.
The working capital for Lyte Inc. in 2017 and 2016 is detailed in the table that follows:

The working capital has improved because Lyte Inc. has enjoyed higher sales albeit on credit and thus more cash, in comparison with 2016.
7.3 Financial Leverage Ratios
Financial leverage ratios represent the use of debt rather than owners’ equity in financing a company’s assets. Significant debt in relation to owners’ equity results in a much higher degree of financial leverage but involves a risk–reward trade-off. Thus increased leverage presents the likelihood of a greater return, but at the price of greater risk. The level of risk depends on the attitude of the board of directors or owners of the business. Some owners will be risk averse, while others are risk neutral, and gamblers tend to be risk-seekers. However, investors and long-term lenders are risk averse and interested in the amount of leverage a company holds. It is also important to remember that extra debt results in higher fixed costs in the shape of interest. Thus a struggling company will still have to make principal and interest payments on existing and on any new debt. Also creditors are interested in a company’s leverage. Hence, the greater the degree of leverage a company has, the less protection its creditors will have.
The debt to equity ratio ((current liabilities + Long-term debt) ÷ equity)) for Lyte Inc. in 2017 and 2016 is detailed in the table that follows:

In 2016, the debt to equity ratio for Lyte Inc. was 0.75 or 75% of owners’ equity. So for every $1 of financing provided by the company’s owners, creditors supplied approximately 75 cents.
The debt to equity ratio for Lyte Inc. has improved because long-term debt has fallen and net income has risen.
Another method of measuring a company’s leverage is to calculate the debt to total assets ratio ((current liabilities + long-term debt) debt/total assets)). The debt to total assets ratio for Lyte Inc. in 2017 and 2016 is detailed in the table that follows:

In 2016, Lyte Inc. financed 43 percent of its assets through debt. Creditors are very interested in a firm’s leverage.
The debt to total assets ratio for Lyte Inc. has improved because long-term debt has fallen and total assets have increased.
Although times interest earned is not considered a leverage ratio, it is important to lenders. This ratio measures the number of times that net income before interest expense and income taxes exceeds interest expense. It is calculated as operating income ÷ interest expense. The times interest earned ratio for Lyte Inc. in 2017 and 2016:

The times interest earned ratio for Lyte Inc. has improved because operating income has increased and interest expense has fallen.
Activity ratios determine the extent to which a company uses various assets. The correct level of assets is difficult if not impossible to state. The answer depends on environmental factors such as the industry in which the company operates and internal factors such as the company’s business strategy. For example, there is a “right” level of cash to have on hand, and if a company has too much cash on hand, it may be foregoing profitable investment opportunities. On the other hand, if it has too little, the company will struggle to honor short-term obligations such as payroll. The inventory turnover of a tractor dealer will be slower than a toy store. Also, some manufacturing companies may operate a just-in-time inventory policy, while others prefer to carry large inventories.
Inventory Turnover
This ratio is calculated as cost of goods sold divided by inventory (cost of goods sold ÷ inventory). The inventory turnover ratio for Lyte Inc. in 2017 and 2016:

The inventory turnover has improved as Lyte Inc. is selling more.
A related ratio is the number of days’ sales in inventory and is calculated as 365 ÷ inventory turnover. The number of days’ sales in inventory for Lyte Inc. in 2017 and 2016:

In 2016, Lyte Inc. had 108 days or approximately three months’ worth of inventory on hand. In 2017, Lyte Inc. is holding less inventory and selling more, consequently the ratio has improved.
Accounts Receivable Turnover
This is calculated as sales divided by accounts receivable (sales ÷ accounts receivable). The accounts receivable turnover for Lyte Inc. in 2017 and 2016:

The accounts receivable turnover has improved as Lyte Inc. is selling more.
A related ratio is the accounts receivable days as 365 ÷ accounts receivable turnover. The number of days’ sales in inventory for Lyte Inc. in 2017 and 2016:

In 2016, it took approximately 40 days to collect monies from receivables, and it is virtually the same in 2017.
Ideally receivables should be constant or falling but there are other factors such as credit terms, the efficiency of collecting receivables, and what the industry average is to consider. If a company has a credit policy that is too tight then it will lose business to competitors, and if the credit terms are too generous, this can cause problems. If Lyte Inc. offers a 2% discount for full payment within 10 days and the balance of receivables pay within 30 days, then it clearly has a challenge and has to work hard to collect old receivables.
This is calculated as purchases divided by accounts payables (purchases ÷ accounts payable). (If purchases are not given then the cost of goods sold figure can be used). The accounts payable turnover for Lyte Inc. in 2017 and 2016:

The accounts payable turnover has improved as Lyte Inc. is settling payables quicker.
A related ratio is the accounts payables days as 365 ÷ accounts turnover. The number of days’ sales in inventory for Lyte Inc. in 2017 and 2016:

In 2016, it took approximately 45 days to pay suppliers but it has improved in 2017 as Lyte Inc. is selling more and pays quicker to ensure a regular supply that meets demand.
Cash Conversion Cycle (CCC)
The CCC measures the number of days a company’s cash is tied up in the production and sales process of its normal operations and the advantage it obtains from credit terms from its payables. The shorter the CCC, the more liquid the company’s working capital position is. The CCC is also known as the “cash” or “operating” cycle and is calculated: [(number of days’ sales in inventory + accounts receivable days) – accounts payable days]
The CCC is an important indicator of the company’s efficiency in managing its working capital assets and its ability to honor its current liabilities. It also examines how quickly the company changes its inventory into revenues, and its revenues into cash, which is then used to finance its payables. The CCC for Lyte Inc. in 2017 and 2016:

The CCC has improved by 10 days in 2017 indicating a better liquidity position, which should enable the owners of Lyte Inc. to borrow less, greater opportunities to achieve trade discounts when purchasing raw materials, and more power to fund the growth of the company.
7.5 Profitability Ratios
Profitability ratios are used to assess a company’s ability to generate earnings compared to its expenses and other relevant costs incurred during a specific period. Return on Assets (ROA)
ROA compares net income to total assets and calculated as net income divided by total assets (net income ÷ total assets). It is important to note that different analysts use different measures of net income and total assets. Some analysts use net income minus interest (net of taxes) in the numerator; some use operating income and many use average assets in the denominator. Irrespective of how the numerator and denominator are defined, the ROA should be calculated consistently and ultimately relates the income earned during a period of time to the assets that were invested to generate those earnings. ROA for Lyte Inc. in 2017 and 2016:

In 2016, for every $1 of profit produced approximately $10 (100/9.75) was invested in its assets as was the case in 2017.
Return on Equity (ROE)
ROE measures the amount of net income returned as a percentage of common stockholder’s equity. ROE highlights how much profit a company generates with the money stockholders or shareholders have invested. It is calculated net income minus preferred dividends to common stockholders’ equity [(net income – preferred stock dividends) ÷ common stockholders’ equity].
ROE for Lyte Inc. in 2017 and 2016

In 2016, every $1 invested in Lyte Inc. resulted in approximately 17 cents return. There was a marginal decline in 2017; however, any figure between 15 and 20% is considered a sound investment.
ROA v ROE for Lyte Inc. in 2017 and 2016

The difference in ROA and ROE is due to leverage and this is supported by the debt to asset ratio, see previous table. It appears that Lyte Inc. has used debt wisely and to the benefit of stockholders.
This ratio relates net income to sales (net income ÷ sales). It highlights the percentage of each sales dollar that causes net income. Profit margin for Lyte Inc. in 2017 and 2016:

The profit margin has worsened although revenues were higher in 2017, because there was an extraordinary item in 2017 that resulted in lower net income.
Earnings per Share (EPS)
EPS (net income – preferred dividends ÷ average number of common shares outstanding including Paid-in-Capital) determines the market value of a share of common stock. Consequently EPS is of specific interest to stockholders and potential investors.
The basic EPS is simple. However, if the company’s capital structure or how the company finances its assets is complex (for example, the structure may have issues of preferred stock and stock warrants and long-term bonds), then the calculation of fully diluted EPS becomes necessary. It is calculated [(net income – preferred dividend) ÷ weighted average number of shares outstanding – impact of convertible securities – impact of options, warrants and other dilutive securities]. As Lyte Inc. has a simple capital structure, we will only calculate a basic EPS. (NB: Lyte’s preferred dividends were $6,000 for both 2017 and 2016 ($100 × 1,000 × 0.06)

EPS means every share of the common stock earned 3.05 dollars (2016) and 3.12 dollars (2017) of net income. The higher EPS for 2017 is the sign of higher earnings, strong financial position, and potentially a sound company to invest money in.
Price/Earnings Ratio (P/E Ratio)
The P/E ratio compares the price of a company’s common stock on any given day with its EPS for the recent year (current market price ÷ EPS). The P/E ratio is also known as a company’s earnings multiple.
The major driver of the price of a company’s stock is investors’ expectations about the future profit of the company. If investors believe a company’s future earnings are positive, then both the price of the stock and P/E ratio will increase and vice versa. Investors can pay more than 30 times earnings for the stock of some companies and less than 10 times for others. Therefore, investors collectively can be more buoyant about the future of some companies rather than others. PE ratio for Lyte Inc. in 2017 and 2016:

In 2016, an investor was willing to pay $16.39 for $1 of current earnings. The 2017 P/E ratio was higher as Lyte’s revenues and net income continue to increase.
7.6 Limitations of Ratio Analysis
Ratio analysis is widely used in business, and its major strength is that it advances a systematic approach to analyzing company performance. However, it is also important to note some of the deficiencies of ratio analysis:
•Ratios function with numbers but do not address qualitative issues such as customer service which has an important impact on the financial performance.
•Ratios are historic in nature but investment analysts will make assumptions about future performance using ratios.
•Ratios are very useful when they are used to compare performance over a number of successive periods andor against comparable businesses and industry standards but this information is not always available.
•Accounting information can be manipulated in many ways to make the figures used for ratios more attractive. For example, businesses can delay payments to payables at the end of the financial year to make the cash balance stronger than normal and thus improve working capital.