Chapter 15: Creating Customized Reports
15.3 Selecting the Variables to Include in Your Report
15.4 Comparing Detail and Summary Reports
15.5 Producing a Summary Report
15.6 Demonstrating the FLOW Option of PROC REPORT
15.7 Using Two Grouping Variables
15.8 Changing the Order of Variables in the COLUMN Statement
15.9 Changing the Order of Rows in a Report
15.10 Applying the ORDER Usage to Two Variables
15.11 Creating a Multi-Column Report
15.13 Using a Nonprinting Variable to Order a Report
15.14 Computing a New Variable with PROC REPORT
15.15 Computing a Character Variable in a COMPUTE Block
15.16 Creating an ACROSS Variable with PROC REPORT
15.17 Using an ACROSS Usage to Display Statistics
Although you can customize the output produced by PROC PRINT, there are times when you need a bit more control over the appearance of your report. PROC REPORT was developed to fit this need. Not only can you control the appearance of every column of your report, you can produce summary reports as well as detail listings. Two very useful features of PROC REPORT, multiple-panel reports and text wrapping within a column, are often the deciding factor in choosing PROC REPORT over PROC PRINT.
First, let’s look at a listing of a data set called Medical using PROC PRINT. You can then see how this listing can be enhanced using PROC REPORT:
Program 15.1: Listing of Medical Using PROC PRINT
title "Listing of Data Set Medical from PROC PRINT";
proc print data=Learn.Medical;
id Patno;
run;
This program produces the following listing:
Figure 15.1: Output from Program 15.1

Here is a report, using the same data set, produced by PROC REPORT:
Program 15.2: Using PROC REPORT (All Defaults)
title "Using the REPORT Procedure";
proc report data=Learn.Medical;
run;
Here is the output:
Figure 15.2: Output from Program 15.2

One thing to notice about PROC REPORT is that if a variable is associated with a label, the default action is to use the variable label in the report rather than the variable name (which is the default in PROC PRINT). Another difference between PROC REPORT and PROC PRINT relates to column widths. Default column widths with PROC REPORT are computed as follows:
For character variables, the column width is either the length of the character variable or the length of the formatted value (if the variable has a format). For numeric variables, the default column width is 9 or the width of a format (if the variable is formatted). The bottom line is that when you use PROC REPORT instead of PROC PRINT, you will usually be defining the width of each column and not be bothered about what the default widths are. You will see in a moment how to control the width of each column in the report.
To specify which variables you want to include in your report, use a COLUMN statement. The COLUMN statement serves a similar function to the VAR statement of PROC PRINT—it allows you to select which variables you want in your report and the order that they appear. In addition, you need to list variables that you create in COMPUTE blocks (discussed later in this chapter). As an example, look at Program 15.3.
Program 15.3: Adding a COLUMN Statement to PROC REPORT
title "Adding a COLUMN Statement";
proc report data=Learn.Medical;
column Patno DX HR Weight;
run;
Here you are selecting four variables (Patno, DX, HR, and Weight) to be included in the report (in that order). Here is the output:
Figure 15.3: Output from Program 15.3

Because the variable HR was associated with a label when the data set was created, you see the heading "Heart Rate" instead of the variable name HR. As a reminder, PROC REPORT uses variable labels (if they exist) as column headings.
Unlike PROC PRINT, PROC REPORT is capable of producing both detail reports (listings of all observations) and summary reports (reporting statistics such as sums and means).
By default, PROC REPORT produces detail reports for character variables and summary reports for numeric variables. However, when you include a mix of both types of variables in a single report (as in Program 15.3), you obtain a detail listing showing all observations. To help understand this somewhat complex idea, look at what happens when you include only numeric variables in a report.
Program 15.4: Using PROC REPORT with Only Numeric Variables
title "Report with Only Numeric Variables";
proc report data=Learn.Medical;
column HR Weight;
run;
The resulting summary report is as follows:
Figure 15.4: Output from Program 15.4

These numbers represent the SUM of the heart rates and weights for all the observations in data set Medical. You have learned two things here: first, the default usage for numeric variables is ANALYSIS (which produces a summary report), and second, the default summary statistic is SUM.
Learning how to control whether to produce a detail listing or a summary report and what statistics to produce leads you to the DEFINE statement. You can use a DEFINE statement to specify the usage for each variable; use DISPLAY to create a listing of all the observations, and use ANALYSIS to create a summary report. Suppose you want a detail listing of every person in the Medical data set instead of a summary report. You could use the following program:
Program 15.5: Using DEFINE Statements to Define a Display Usage
title "Display Usage for Numeric Variables";
proc report data=Learn.Medical;
column HR Weight;
define HR / display "Heart Rate" width="5";
define Weight / display width="6";
run;
Several things have been added to this program. First, notice that there is now a DEFINE statement for each of the two numeric variables. Next, attributes for the variables are entered as options in the DEFINE statement (thus, they follow a slash after the variable name). The DEFINE option DISPLAY is an instruction to produce a detailed listing of all observations. Besides defining the usage as DISPLAY, the DEFINE statement for HR adds a label (placed in quotes) and a column width. Look at the output here to see the effect of these two DEFINE statements:
Figure 15.5: Output from Program 15.5

You now see a detailed listing of every observation rather than a single summary statistic.
For this example, you want to list the mean heart rate and mean weight for each clinic in the Medical data set. To do this, you need to use the GROUP usage for the variable Clinic. In addition, you need to specify MEAN as the statistic for heart rate and weight. Program 15.6 does the trick:
Program 15.6: Specifying a GROUP Usage to Create a Summary Report
title "Demonstrating a GROUP Usage";
proc report data=learn.medical;
column Clinic HR Weight;
define Clinic / group width="11";
define HR / analysis mean "Average Heart Rate" width="12"
format=5.;
define Weight / analysis mean "Average Weight" width="12"
format=6.;
run;
The MEAN statistic, along with a format, is specified for each of the numeric variables. The keyword ANALYSIS is optional because this is the default usage for numeric variables. You may place these options (label, width, format, and so on) in any order you like. The report is shown next:
Figure 15.6: Output from Program 15.6

The figures in the report show the average heart rate and average weight for each of the two clinics.
One of the nice features of PROC REPORT is its ability to wrap lines of text within a column when you have long values. To demonstrate this feature, here is a report that includes a variable called Comment that is 50 characters long. Because a value this long would take up most of the width of a page, you can use the FLOW option to improve the appearance of your report.
Note: This option affects only the listing output. It has no effect on other ODS destinations such as HTML or PDF. For other ODS destinations, long text fields will wrap automatically.
Here is the code to accomplish this:
Program 15.7: Demonstrating the FLOW Option with PROC REPORT
title "Demonstrating the FLOW Option";
proc report data=Learn.Medical headline
split=' ' ls=74;
column Patno VisitDate DX HR Weight Comment;
define Patno / "Patient Number" width="7";
define VisitDate / "Visit Date" width="9" format=date9.;
define DX / "DX Code" width="4" right;
define HR / "Heart Rate" width="6";
define Weight / width="6";
define Comment / width="30" flow;
run;
This program has several new features. First, the FLOW option was added to the DEFINE statement for the Comment variable. This wraps the comment field within the defined column width of 30. The SPLIT= option is required to tell the program that you want to split the comments between words (blanks). Without this option, PROC REPORT would use other characters such as the slashes in the dates as possible line breaks. The LS= option allows you to select a line size.
The option RIGHT, used for the DX variable, right-aligns the DX values. The default alignment for character variables is LEFT. Alignment options are LEFT, RIGHT, and CENTER. Here is the report:
Figure 15.7: Output from Program 15.7

This is a detail report, showing all the observations in the data set. You may wonder why this is so, when the default usage for numeric variables is ANALYSIS (with SUM as the default statistic). Because patient number (Patno) is a character variable (with a default usage of DISPLAY) and it is included in the report, the usage for the numeric variables in the report also has to be DISPLAY. Having one DISPLAY usage variable in the report forces the usage to be DISPLAY for the other variables. Some programmers prefer to explicitly code the usage for every variable in a report. Thus, Program 15.7 could be written like this:
Program 15.8: Explicitly Defining Usage for Every Variable
title "Demonstrating the FLOW Option";
proc report data=Learn.Medical headline
split=' ' ls=74;
column Patno VisitDate DX HR Weight Comment;
define Patno / display "Patient Number" width="7";
define VisitDate / display "Visit Date" width="9"
format=date9.;
define DX / display "DX Code" width="4" right;
define HR / display "Heart Rate" width="6";
define Weight / display width="6";
define Comment / display width="30" flow;
run;
To demonstrate how you can nest one group within another, we use a data set called Bicycles. This data set contains the country where the bicycles were sold, the model of bicycle (road, mountain, or hybrid), the manufacturer, the number of units sold, and the total sales. The goal here is to see the sum of total sales broken down by country and model. To do this, both the Country and Model variables are defined with a GROUP usage. The order of these variables in the COLUMN statement (Country first, followed by Model) specifies that Country comes first and that Model is nested within Country. Here is the program:
Program 15.9: Demonstrating the Effect of Two Variables with GROUP Usage
title "Multiple GROUP Usages";
proc report data=Learn.Bicycles headline ls=80;
column Country Model Units TotalSales;
define Country / group width="14";
define Model / group width="13";
define Units / sum "Number of Units" width="8"
format=comma8.;
define TotalSales / sum "Total Sales (in thousands)"
width="15" format=dollar10.;
run;
The option HEADLINE was added to PROC REPORT. This option places a line between the column headings and the remainder of the report (only for listing output). Notice that Country comes before Model in the COLUMN statement. Output from this program is shown next:
Figure 15.8: Output from Program 15.9

The values of both Country and Model are printed only when the value changes (thus making for a more readable report). The values in the last two columns are the sums of the two variables (Units and TotalSales) for each combination of Country and Model.
Here is the same report, except that the order of the two variables Country and Model is reversed in the COLUMN statement and the manufacturer (Manuf) is added.
Program 15.10: Reversing the Order of Variables in the COLUMN Statement
title "Multiple GROUP Usages";
proc report data=Learn.Bicycles headline ls=80;
column Model Country Manuf Units TotalSales;
define Country / group width="14";
define Model / group width="13";
define Manuf / width="12";
define Units / sum "Number of Units" width="8"
format=comma8.;
define TotalSales / sum "Total Sales (in thousands)"
width="15" format=dollar10.;
run;
Notice that Model now comes first in the report and that Country is nested within Model.
Figure 15.9: Output from Program 15.10 (Partial Listing)

If you want a listing in sorted order using PROC PRINT, you must first sort the data set with PROC SORT. PROC REPORT allows you to request a report in sorted order within the procedure itself. This is accomplished by requesting the ORDER usage as an option in your DEFINE statement.
As an example, suppose you want a listing of your Sales data set with the variables EmpID, Quantity, and TotalSales. In addition, you want this listing to be arranged in EmpID order. Here is the program:
Program 15.11: Demonstrating the ORDER Usage of PROC REPORT
title "Listing from SALES in EmpID Order";
proc report data=Learn.Sales headline;
column EmpID Quantity TotalSales;
define EmpID / order "Employee ID" width="11";
define Quantity / width="8" format=comma8.;
define TotalSales / "Total Sales" width="9"
format=dollar9.;
run;
The keyword ORDER in the DEFINE statement for EmpID produces the report in order of ascending EmpID. This saves you the trouble of having to sort your data set prior to requesting the report. The resulting report is shown next:
Figure 15.10: Output from Program 15.11

You can apply the ORDER usage to several variables. For example, suppose you want the same report as the one produced by Program 15.11, but you want to see the total sales for each employee in decreasing order of total sales. Here is the program:
Program 15.12: Applying the ORDER Usage for Two Variables
title "Applying the ORDER Usage for Two Variables";
proc report data=Learn.Sales headline;
column EmpID Quantity TotalSales;
define EmpID / order "Employee ID" width="11";
define TotalSales / descending order "Total Sales"
width="9" format=dollar9.;
define Quantity / width="8" format=comma8.;
run;
Because you want the report to show total sales for each employee in descending order, you precede ORDER with the keyword DESCENDING. Remember, the order of the ORDER variables in the report is controlled by their order in the COLUMN statement.
Here is the report:
Figure 15.11: Output from Program 15.12 (partial listing)

The report is in ascending order of employee ID and decreasing order of total sales.
PROC REPORT can create telephone book style, multi-column reports. This is especially useful when you have only a few variables to report and you want to save paper. Data set Assign contains subject numbers (Subject) and groups (A, B, or C). Using the PANELS= option of PROC REPORT, you can print this report with multiple columns. If you specify a large number for the number of panels, PROC REPORT fits as many panels as possible for a given line size.
Note: As with the FLOW option, this option affects only the listing output. It has no effect on other ODS destinations such as HTML or PDF. If your output destination is PRINTER, PDF, or RTF, you can use a COLUMNS= option in the ODS statement.
Here is the program:
Program 15.13: Creating a Multi-column Report
title "Random Assignment - Three Groups";
proc report data=Learn.Assign panels=99
headline ps=16;
columns Subject Group;
define Subject / display width="7";
define Group / width="5";
run;
The page size (PS) is set to 16 (which limits the number of lines per page to 16) so that you can see the effect of the PANELS= option. In this program, a DISPLAY usage was used for Subject (a numeric variable). This was not necessary because the default usage for Group (a character variable) is DISPLAY, and you would have obtained a detail report anyway. However, it is fine to include it. Here is the report:
Figure 15.12: Output from Program 15.13

PROC REPORT can produce totals and subtotals on ANALYSIS variables by using BREAK and RBREAK statements. RBREAK, which stands for report break, is used to report summary statistics (typically sums or means) at the top or bottom of a report. The BREAK statement is used to report summary statistics each time a GROUP or ORDER variable changes value. Let’s look at a few examples.
Using the Sales data set, you want to see totals for Quantity and TotalSales at the bottom of the report. The following program produces this report:
Program 15.14: Requesting a Report Break (RBREAK Statement)
title "Producing Report Breaks";
proc report data=Learn.Sales;
column Region Quantity TotalSales;
define Region / order width="6";
define Quantity / sum width="8" format=comma8.;
define TotalSales / sum "Total Sales" width="9"
format=dollar9.;
rbreak after / summarize;
run;
Following the keyword RBREAK is a location, either BEFORE or AFTER. BEFORE places the summary statistics at the beginning of the report; AFTER places them at the end. The option SUMMARIZE prints a statistic (the one requested in the DEFINE statements) at the top or bottom of the report (depending on whether you request the break before or after). The report is shown below:
Figure 15.13: Output from Program 15.14

To display summary statistics for each value of one or more GROUP or ORDER variables, use the BREAK statement. For example, if you want to see the total Quantity and TotalSales for each region in the Sales data set, use the following program:
Program 15.15: Demonstrating the BREAK Statement of PROC REPORT
title "Producing Report Breaks";
proc report data=Learn.Sales;
column Region Quantity TotalSales;
define Region / order width="6";
define Quantity / sum width="8" format=comma8.;
define TotalSales / sum "Total Sales" width="9"
format=dollar9.;
break after region / summarize;
run;
The BREAK statement uses the same location keywords as the RBREAK statement. With the BREAK statement, you also need to specify one or more GROUP or ORDER variables that determine where to print the summary statistics. The option SUMMARIZE prints the appropriate summary statistic after the break. In Program 15.15, a line showing the sum of Quantity and TotalSales is printed for each change in the Region value. The output from this program is as follows:
Figure 15.14: Output from Program 15.15

If you don’t want the summary line to contain the values of the BREAK variable(s), use the SUPPRESS option, like this:
break after region / summarize suppress;
This results in a cleaner looking report:
Figure 15.15: Demonstrating the SUPPRESS Option

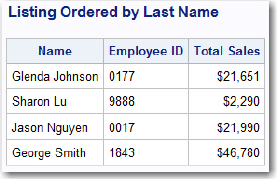
PROC REPORT can use a variable to order the rows of a report without including the variable in the report. For example, in data set Sales, the Name variable stores names as first name followed by last name. Now, if you want a report showing this variable but you want to arrange the rows alphabetically by last name, you can run the following program:
Program 15.16: Using a Nonprinting Variable to Order the Rows of a Report
data Temp;
set Learn.Sales;
length LastName $ 10;
LastName = scan(Name,-1,' ');
run;
title "Listing Ordered by Last Name";
proc report data=Temp;
column LastName Name EmpID TotalSales;
define LastName / order group noprint;
define Name / group width="15";
define EmpID / "Employee ID" group width="11";
define TotalSales / sum "Total Sales" width="9"
format=dollar9.;
run;
In the short DATA step, the SCAN function extracts the last name from the Name variable. The second argument to the SCAN function tells the system which “word” to extract from the first argument. A negative value says to start scanning from the right; the third argument defines the word delimiters—in this case, a space.
The LastName variable must be listed in the COLUMN statement, even if you are not planning to include it in the report. In the DEFINE statement for LastName, you need to use the NOPRINT option. This option allows the report to be sorted by last name but removes this variable from the report. In the listing from Program 15.16, notice that the rows of the report are ordered by the last name:
Figure 15.16: Output from Program 15.16
One powerful feature of PROC REPORT is its ability to compute new variables. This makes PROC REPORT somewhat unique among SAS procedures. With most SAS procedures, you need to run a DATA step first if you want to perform any calculations.
Suppose you want to report the weights of the patients in your Medical data set, but instead of reporting the weights in pounds (the units used in the data set), you want to see the weights in kilograms. Program 15.17 uses a compute block to accomplish this:
Program 15.17: Computing a New Variable with PROC REPORT
title "Computing a New Variable";
proc report data=Learn.Medical;
column Patno Weight WtKg;
define Patno / display "Patient Number" width="7";
define Weight / display noprint width="6";
define WtKg / computed "Weight in Kg"
width="6" format=6.1;
compute WtKg;
WtKg = Weight / 2.2;
endcomp;
run;
Notice several things about this program:
● The new variable (WtKg) and the variable used to compute it (Weight) are both listed in the COLUMN statement. It is important that you list Weight before WtKg in this statement—a computed value must follow the variable or variables used to define it. If you don’t want to include the original value of weight in the report, you use the keyword NOPRINT in the DEFINE statement for Weight.
● Use a usage of COMPUTED in the DEFINE statement for your new variable.
● Use COMPUTE and ENDCOMP statements to create a COMPUTE block. You define your new variable inside this block.
As you will see in the next example, this block can contain programming logic as well as arithmetic computations.
Here is the output:
Figure 15.17: Output from Program 15.17

As we mentioned in the previous example, you can include programming logic within a COMPUTE block. In this example, you want to create a new character variable (Rate) that has a value of Fast, Normal, or Slow, based on the heart rate (HR). Here is the program:
Program 15.18: Computing a Character Variable in a COMPUTE Block
title "Creating a Character Variable in a COMPUTE Block";
proc report data=Learn.Medical;
column Patno HR Weight Rate;
define Patno / display "Patient Number" width="7";
define HR / display "Heart Rate" width="5";
define Weight / display width="6";
define Rate / computed width="6";
compute Rate / character length=6;
if HR gt 75 then Rate = 'Fast';
else if HR gt 55 then Rate = 'Normal';
else if not missing(HR) then Rate='Slow';
endcomp;
run;
As before, you include the variable you are computing in the COLUMN statement. The COMPUTE statement now includes the keyword CHARACTER to tell SAS that Rate is a character variable. The option LENGTH=6 defines the storage length for this variable.
Next, the logical statements to compute Rate are sandwiched between the COMPUTE and ENDCOMP statements. Here is the output:
Figure 15.18: Output from Program 15.18

The new variable (Rate) is now included in the report.
Besides creating simple column reports, PROC REPORT can also create a tabular style report with each unique value of a variable forming a new column in your report.
This is accomplished by using an ACROSS usage for your variable. In the example that follows, each type of bicycle (hybrid, mountain, and road) in the Bicycle data set is used to create a separate column in the report:
Program 15.19: Demonstrating an ACROSS Usage in PROC REPORT
***Demonstrating an Across Usage;
title "Demonstrating an ACROSS Usage";
proc report data=Learn.Bicycles;
column Model,Units Country;
define Country / group width="14";
define Model / across "Model";
define Units / sum "# of Units" width="14"
format=comma8.;
run;
Besides defining Model as an Across variable, you need to tell the procedure what value you want to display for each row of the table. Notice the Model,Units term in the COLUMN statement. This is an instruction to PROC REPORT to report the number of units within each category of Model. The listing here should help clarify how this works:
Figure 15.19: Output from Program 15.19

You can use an ACROSS usage to create a report showing a summary statistic for each level of the ACROSS variable. Here is an example.
You want to see the average white and red blood cell counts for each combination of gender, blood type, and age group in the Blood data set. You also want the age group variable to be displayed in separate columns of the report. Here is the program:
Program 15.20: Using ACROSS Usage to Display Statistics
title "Average Blood Counts by Age Group";
proc report data=Learn.Blood;
column Gender BloodType AgeGroup,WBC AgeGroup,RBC;
define Gender / group width="8";
define BloodType / group width="8" "Blood Group";
define AgeGroup / across "Age Group";
define WBC / analysis mean format=comma8.;
define RBC / analysis mean format=8.2;
run;
The COLUMN statement shows that the mean value of WBC (white blood cells) and RBC (red blood cells) should be displayed for each value of AgeGroup. You also need to define WBC and RBC with an ANALYSIS usage with MEAN as the desired statistic. Here is the output:
Figure 15.20: Output from Program 15.20

You should be aware that PROC TABULATE is well-suited for creating tables such as this. Many programmers, including this author, find PROC TABULATE easier to use when creating more complicated two-way tables.
This chapter is only the “tip of the iceberg” as far as PROC REPORT is concerned. If you would like to learn more, there are excellent SAS Press books and SAS online Docs devoted to PROC REPORT.
Solutions to odd-numbered problems are located at the back of this book. Solutions to all problems are available to professors. If you are a professor, visit the book’s companion website at support.sas.com/cody for information about how to obtain the solutions to all problems.
1. Use PROC REPORT to create a report, as shown here:
Note: The data set is Blood, and the variables to be listed are Subject, WBC, and RBC. All three variables are numeric (be careful).

2. Using the Blood data set, produce a summary report showing the average WBC and RBC count for each value of Gender as well as an overall average. Your report should look like this:

3. Using the Hosp data set, create the report shown here. Age should be computed using the YRDIF function and rounded to the nearest integer:

4. Using the SAS data set BloodPressure, compute a new variable in your report. This variable (Hypertensive) is defined as Yes for females (Gender=F) if the SBP is greater than 138 or the DBP is greater than 88 and No otherwise. For males (Gender=M), Hypertensive is defined as Yes if the SBP is over 140 or the DBP is over 90 and No otherwise. Your report should look like this:

5. Using the SAS data set BloodPressure, produce a report showing Gender and Age, along with a new variable called AgeGroup. Values of AgeGroup are <= 50 or > 50 depending on the value of Age. Label this variable “Age Group.” Your report should look like this:

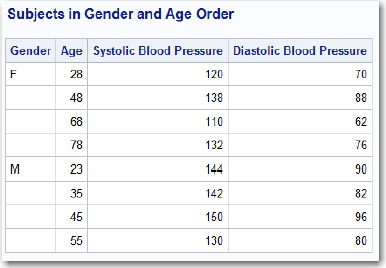
6. Using the SAS data set BloodPressure, produce a report showing Gender, Age, SBP, and DBP. Order the report in Gender and Age order as shown here:
7. Using the SAS data set Blood, produce a report showing the mean cholesterol (Chol) for each combination of Gender and blood type (BloodType). Your report should look like this:

8. Using the data set Blood, produce a report like the one here. The numbers in the table are the average WBC and RBC counts for each combination of blood type and gender.

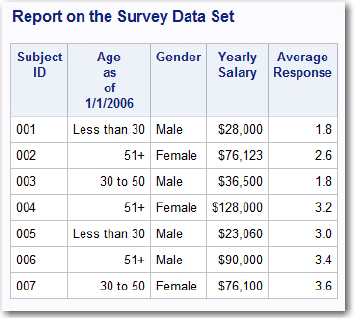
9. Using the SAS data set Survey, produce a report showing the ID, Gender, Age, and Salary variables and the average of the five variables Ques1–Ques5. Your report should look like this: