
Not everything is numeric, and often non-numeric data has to be handled differently, as we saw in the chapter on statistics and the chapter on data mining. For example, a scatter plot doesn't make much sense unless the data is naturally ordered in some way.
In this recipe, we'll use a bar chart to display how many items have a possible value each for a field of categorical data.
We'll use the same dependencies in our project.clj file as we did in Creating scatter plots with Incanter.
We'll also use this set of imports in our script or REPL:
(require '[incanter.core :as i]
'[incanter.charts :as c]
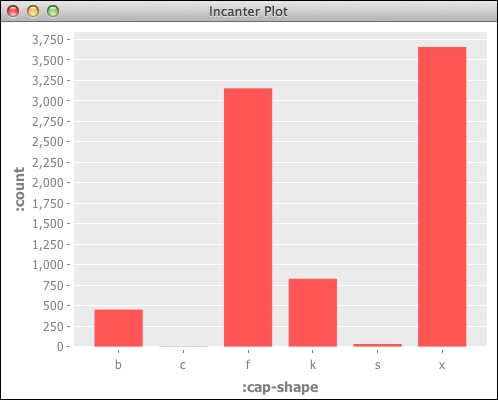
'[incanter.io :as iio])For this chart, we'll use the mushroom dataset from the UCI machine learning archive. The web page with the information about this dataset is at http://archive.ics.uci.edu/ml/datasets/Mushroom, and we can download a copy of it with the header names directly from http://www.ericrochester.com/clj-data-analysis/data/agaricus-lepiota.data. I've downloaded it in a data directory, so I can load it with this expression:
(def shrooms
  (iio/read-dataset "data/agaricus-lepiota.data"
:header true))In order to graph this, we need to summarize the data in some way:
- Here, we'll get the number of mushrooms with a cap shape and create a bar chart with that data:
(def shroom-cap-bar (i/with-data (->> shrooms (i/$group-by :cap-shape) (map (fn [[k v]] (assoc k :count (i/nrow v)))) (sort-by :cap-shape) i/to-dataset) (c/bar-chart :cap-shape :count))) - Now we view it:
(i/view shroom-cap-bar)
In the output of the preceding line, we see something like the following screenshot:
The most complicated part of this recipe is the transformation of the data to get the counts. Let's break that apart line-by-line:
- We start with the dataset we loaded from the CSV file:
(->> shrooms
- We group that by the
:cap-shapefield. This produces a hash map going from a map like{:cap-shape 0.0}to a dataset:(i/$group-by :cap-shape)
- We take each key-value pair in the group hash map and add the number of rows in the dataset to the key. The output of this operation is a sequence of maps, such as
{:cap-shape 0.0, :count 452}:(map (fn [[k v]] (assoc k :count (i/nrow v))))
- We sort that by the cap shape:
(sort-by :cap-shape)
- Then we convert it to a new dataset:
i/to-dataset)
We implicitly pass the output of that expression to the incanter.charts/bar-chart using incanter.core/with-data, and we have our chart.