
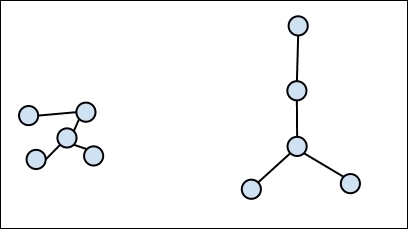
One popular way to visualize graphs of data is to use a force-directed layout. This employs a physical simulation of charged particles and springs to create an aesthetically pleasing visualization. It minimizes crossed lines while keeping all the edges more or less of the same length. This makes the relationships in the graph immediately clear, at the expense of expressing the distances between nodes. For example, consider the following diagram. On the left, we have a graph that is randomly laid out. On the right, it's laid out using a force-directed layout. Each of the edges is approximately as long as the others, and each node is as far away from its neighbors as it can get:
In this recipe, we'll create a force-directed graph visualization for a K-Means cluster of the US census race data aggregated by state.
We'll use the same dependencies and plugins in our project.clj file as we did in the Creating scatter plots with NVD3 recipe.
As I just mentioned, we'll use a graph of clusters of US census race data by state. I've already compiled this, and you can download it from http://www.ericrochester.com/clj-data-analysis/data/clusters.json. Place it in the resources/data/ directory of your project and you should be ready.
This recipe will follow the same pattern that we've seen in the last few recipes. We'll define a handler, routes, and then the ClojureScript. To do this, perform the following steps:
- The handler is similar to what we've seen so far, and it uses the
d3-pagefunction too:(defn force-layout-plot [] (d3-page "Force-Directed Layout" "webviz.force.force_layout();" [:div#force.chart [:svg]])) - The routes are also as we'd expect them to be:
(defroutes
  site-routes
  (GET "/force" [] (force-layout-plot))
  (GET "/force/data.json" []
       (redirect "/data/clusters.json"))
  (route/resources "/")
  (route/not-found "Page not found"))
- We'll also need some style. Open
resources/css/style.cssand add these lines:#force { width: 650px; height: 500px; } #force .node { stroke: #fff; stroke-width: 1.5px; } #force .link { stroke: #999; stroke-opacity: 1; } - Now, let's create the ClojureScript file. Open
src-cljs/webviz/force.cljsand add this for the namespace declaration:(ns webviz.force)
- First, we'll create the force diagram, as shown here:
(defn create-force [width height] (-> js/d3 .-layout (.force) (.charge -120) (.linkDistance 30) (.size (array width height)))) - Now, we'll create the SVG element to contain it:
(defn create-svg [width height] (-> js/d3 (.select "#force svg") (.attr "width" width) (.attr "height" height))) - With the force diagram, we need to set the nodes and edges and start the animation:
(defn start-force [force graph] (-> force (.nodes (aget graph "nodes")) (.links (aget graph "links")) .start)) - We also need to create the lines for the edges and the circles for the nodes:
(defn create-links [svg graph] (-> svg (.selectAll "line.link") (.data (aget graph "links")) (.enter) (.append "line") (.attr "class" "link") (.style "stroke-width" #(.sqrt js/Math (inc (aget % "value")))))) (defn create-nodes [svg force color graph] (-> svg (.selectAll "circle.node") (.data (aget graph "nodes")) (.enter) (.append "circle") (.attr "class" "node") (.attr "r" 5) (.attr "data-n" #(aget % "n")) (.style "fill" #(color (aget % "group"))) (.call (aget force "drag")))) - The
tickhandler transfers the animation from the force chart's objects to the SVG elements, displaying them:(defn on-tick-handler [link node] (fn [] (-> link (.attr "x1" #(-> % .-source .-x)) (.attr "y1" #(-> % .-source .-y)) (.attr "x2" #(-> % .-target .-x)) (.attr "y2" #(-> % .-target .-y))) (-> node (.attr "cx" #(aget % "x")) (.attr "cy" #(aget % "y"))))) - We'll add a
titleelement to the nodes for a tooltip:(defn set-title [node] (-> node (.append "title") (.text #(aget % "name")))) - Now, we use all of these to render the graph. We'll also save the input graph that we are visualizing. We'll query this to make the visualization interactive in the next recipe, Creating interactive visualizations with D3. If you don't care about that, you can remove the call to
swap!:(def census-graph (atom nil)) (defn render-graph [color force svg graph] (swap! census-graph (fn [] graph)) (start-force force graph) (let [link (create-links svg graph) node (create-nodes svg force color graph)] (set-title node) (.on force "tick" (on-tick-handler link node)))) - Here's the function that we'll export. It makes the AJAX call to download the JSON, creates the base objects, and calls
render-graph:(defn ^:export force-layout [] (let [width 650, height 500] (.json js/d3 "force/data.json" (partial render-graph (.category20c (aget js/d3 "scale")) (create-force width height) (create-svg width height)))))
When we visit http://localhost:3000/force, we will get the following visualization:
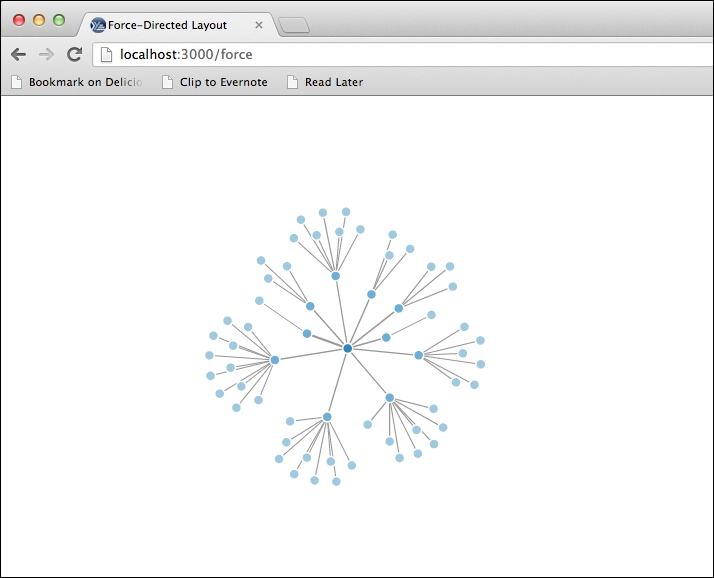
This is a good example of a pure D3 visualization, without NVD3. We've broken the task up into functions to make them easier to understand, but let's take a look at the typical D3 visualization process that we outlined at the end of the Creating time series charts with D3 recipe and see how the functions in this recipe fit into it, as follows:
- Create the chart:
create-forcetakes care of creating the controller for the chart. - Call select on the container:
create-svgselects the SVG elements to render the graph. - Call selectAll on the element we want created to contain each data point: Two functions,
create-linksandcreate-nodes, start by callingselectAllon line nodes and circle nodes. - Associate the data with the chart: This happens in three places. The
create-linksandcreate-nodesfunctions associate the edges and nodes with their elements, andstart-forcepasses a copy of both to theforceobject. - Enter each data point and create the HTML using append and attr: Again, the
create-linksandcreate-nodesfunctions do this for their respective data types.
All of these work together to create the graph. Additionally, since the force-directed layout is animated, we also create a tick handler to update the browser with the latest positions of the objects.
For more about D3, see its website at http://d3js.org/.