Data that includes a regular timestamp, or time series data, is very common. Stock prices and weather are just two examples of this. These datasets track values that change over the course of seconds, hours, days, weeks, months, or even years.
Incanter includes a namespace (incanter.zoo) that makes working with time series data very easy. We can use that to compute running averages and to map other functions over a moving window of the data.
For this, we'll take a look at some stock data for IBM. You can get this from a number of sources, but I downloaded a decade's worth of data from Google Finance (http://www.google.com/finance). You can download the same data from http://www.ericrochester.com/clj-data-analysis/data/ibm.csv.
First, we need to list the dependencies we'll need in our Leiningen project.clj file. Notice that incanter-zoo has been included as a separate dependency since it's not distributed with the core Incanter packages:
(defproject statim "0.1.0"
  :dependencies [[org.clojure/clojure "1.6.0"]
                 [incanter "1.5.5"]
                 [incanter/incanter-zoo "1.5.5"]])
We'll need to require those namespaces in our script or REPL:
(require '[incanter.core :as i]
         'incanter.io
         '[incanter.zoo :as zoo]
         '[clj-time.format :as tf])
We'll also need the data I mentioned in the introduction to this recipe. I've downloaded mine to a file named data/ibm.csv, and I'll bind that to the name data-file:
(def data-file "data/ibm.csv")
Unfortunately, Incanter doesn't convert the dates in the data file, so we'll need to do this ourselves. This isn't difficult to do, but it will take a few lines. Once that's done, we can calculate the rolling averages.
- First, we'll write a function to parse the dates:
(def ^:dynamic *formatter* (tf/formatter "dd-MMM-yy"))
(defn parse-date [date] (tf/parse *formatter* date))
- Now we can open the data file, convert the appropriate rows to dates, and merge the results back into the original dataset:
(def data (i/add-derived-column :date [:date-str] parse-date (i/col-names (incanter.io/read-dataset data-file) [:date-str :open :high :low :close :volume]))) - To use this with
incanter.zoo, we have to convert the dataset to a Zoo object. When we do this, we'll tell it which column contains the time data (:date). From this point on, we'll need to refer to this column with the key (:index):(def data-zoo (zoo/zoo data :date))
- Now, to compute a rolling five-day average, we just call the
incanter.zoo/roll-meanfunction. This will merge the five-day rolling average back into the dataset as the column (:five-day):(def data-roll5 (->> (i/sel data-zoo :cols :close) (zoo/roll-mean 5) (i/dataset [:five-day]) (i/conj-cols data-zoo)))
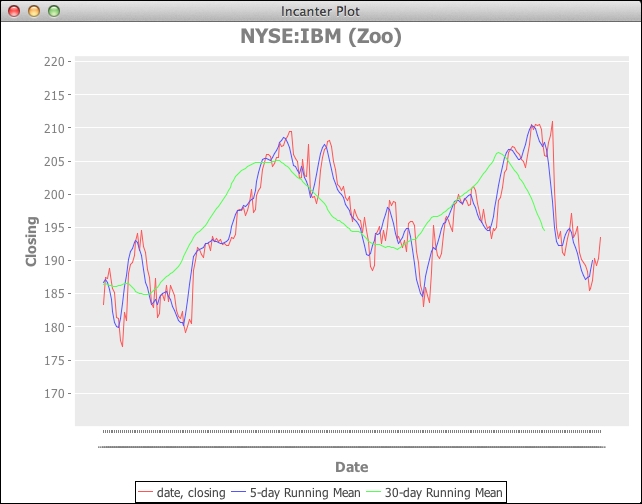
If we look at a graph of the observations for last year's data using incanter.core/sel, we can see how much the rolling dates smoothed the input. Especially looking at the line of the 30-day average, it's clear that the data is capturing a larger trend, not the day-to-day fluctuations of the raw data: