
While using neural networks in regression problems (that include prediction), there is no fixed number of hidden neurons, so usually, the solver chooses an arbitrary number of neurons and then varies it according to the results produced by the networks created. This procedure may be repeated a number of times until a network with a satisfying criterion is found.
In order to attest the neural network's capability to properly respond to new data, it is useful to have two separate datasets, called training and test datasets. In this application, we worked with two distinct periods, one for each dataset.
|
Period |
Begin |
End |
Type |
Number of records |
% |
|---|---|---|---|---|---|
|
1 |
01/01/2013 |
31/12/2014 |
Training |
730 |
93.8 |
|
2 |
30/04/2015 |
16/06/2015 |
Test |
48 |
6.2 |
|
Total |
778 |
100 | |||
The recommendation is for the training set to have at least 75% of the overall dataset.
Experiments can be performed on the same training and test datasets, but by varying the other network parameters, such as the learning rate, normalization, and the number of hidden units. In this case, we performed 12 experiments, whose parameters were chosen as shown in the following table:
|
Experiment |
Number of neurons in hidden layer |
Learning rate |
Data normalization type |
|---|---|---|---|
|
1 |
2 |
0.1 |
MAX_MIN |
|
2 |
MAX_MIN_EQUALIZED | ||
|
3 |
0.5 |
MAX_MIN | |
|
4 |
MAX_MIN_EQUALIZED | ||
|
5 |
0.9 |
MAX_MIN | |
|
6 |
MAX_MIN_EQUALIZED | ||
|
7 |
4 |
0.1 |
MAX_MIN |
|
8 |
MAX_MIN_EQUALIZED | ||
|
9 |
0.5 |
MAX_MIN | |
|
10 |
MAX_MIN_EQUALIZED | ||
|
11 |
0.9 |
MAX_MIN | |
|
12 |
MAX_MIN_EQUALIZED |
The objective is to choose a neural network that presents the best performance from the experiments. The best performance is assigned to the network that presents the lowest MSE error, but an analysis of generalization with the test data is also useful.
After running the 12 experiments, we found the following MSE errors:
|
Experiment |
MSE training error |
|---|---|
|
1 |
3.6551720491360E-4 |
|
2 |
0.3034120360203837 |
|
3 |
3.8543681112765E-4 |
|
4 |
0.3467096464653794 |
|
5 |
4.6319274448088E-4 |
|
6 |
0.4610935945738937 |
|
7 |
2.6604395044000E-4 |
|
8 |
0.2074979827120087 |
|
9 |
2.7763926432754E-4 |
|
10 |
0.2877786584371894 |
|
11 |
3.4582006086257E-4 |
|
12 |
0.4610935945709355 |
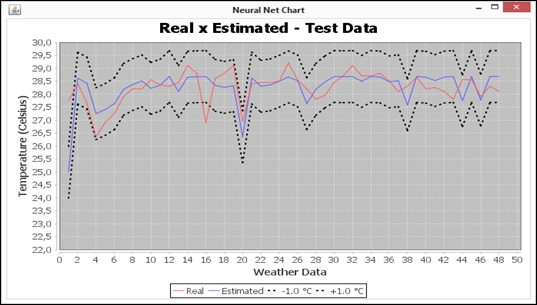
The following graph exhibits neural net 5th experiment's comparison between real and estimated values, and the respective margins of error:
The following graph shows that the same results as those discussed in the previous paragraph, but for neural network 10th experiment:
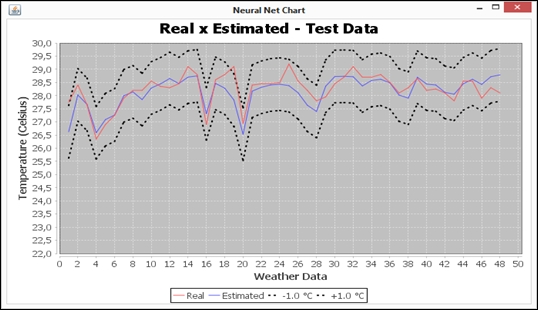
Although experiment 10 has a larger MSE than experiment 5 and 10's chart presents a better generalization behavior. Therefore, we can conclude the following:
- Considering only the final MSE value to decide about the neural net quality is not recommended.
- Estimated value from experiment 10 follows the real value closer than that from experiment 5.
- Neural net obtained in experiment 10 preserves the trending by ascent and descent better than that obtained in 5, as may be viewed between weather data 1 and 17.
Therefore, by viewing the corresponding charts, we chose network 10 to be the most suitable for weather prediction.