Stagemonitor has a monitoring agent built with support for clustered application stacks. The purpose of the tool is to monitor applications running on a number of servers, which is a usual production scenario. Stagemonitor is optimized for integration with time series databases. It is optimized for time series data management, which includes arrays of numbers, indexed by time. Such databases include elasticsearch, graphite, and InfluxDB. Stagemonitor can also be set up in private networks. It uses the open tracking API to correlate requests in distributed systems. It features defining thresholds for the metrics. Stagemonitor also supports creating new plugins and integrating third-party plugins.
Stagemonitor contains a Java-based agent. The agent sits in the Java application. The agent connects to the central database and sends metrics and request traces and statistics. Stagemonitor requires one instance for monitoring all applications, instances, and hosts.
In the browser, on the monitoring side, we can see historical or current data from the cluster. We can also create custom alerts. It is also possible to define a threshold for each metric. Stagemonitor has a dashboard. The dashboard is utilized for visualizing and analyzing different metrics and requests of interest. Stagemonitor supports creating custom dashboards, writing custom plugins, and using third-party plugins. It has in-browser widget support, as well. The widget does not require a backend and is injected automatically into the monitored web page.
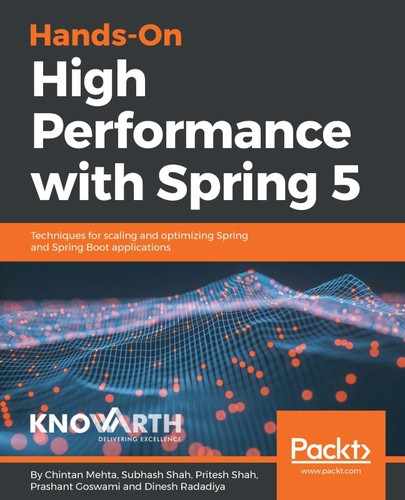
Following is the screenshot of Stagemonitor dashboard for reference:
