
Chapter 2: Installing and Running the Elastic Stack
Now that you know about the core components of the Elastic Stack and what they do, it is time to get them installed and running. As described in the previous chapter, there are a few options available to orchestrate the stack. All core components can be run on multiple platforms (such as Linux, Windows, containers, and so on). This chapter will look at the most common platforms for installation, rather than exhaustively covering all installation options supported by the components.
While it is good to understand how the different installation options work, you can choose your preferred method to run your lab environment to follow along with the examples in future chapters of this book.
In this chapter, we will specifically look at the following:
- Manual installation of Elasticsearch, Kibana, Logstash, and Beats
- Automating the installation of components using Ansible
- Using Elastic Cloud Enterprise to orchestrate Elasticsearch and Kibana
- Running components on Kubernetes
- Configuring your lab environment
Technical requirements
The following technical requirements should be considered in order to follow the instructions in the following sections:
- Access to a cloud platform to provision compute instances and managed Kubernetes clusters is recommended. Most cloud providers provide free tiers for those interested.
- Ansible installed on your machine. Instructions to install Ansible can be found in the Ansible installation guide: https://docs.ansible.com/ansible/latest/installation_guide/intro_installation.html.
- The kubectl command-line tool installed for running on Kubernetes. Instructions to install kubectl can be found in the Kubernetes documentation guide: https://kubernetes.io/docs/tasks/tools/install-kubectl/.
- Access to code samples for Chapter 2 of this book's git clone can be found at https://github.com/PacktPublishing/Getting-Started-with-Elastic-Stack-8.0/tree/main/Chapter2.
Manual installation of the stack
Elastic Stack components can be run on both Linux and Windows environments easily. The components are run as standalone products and do not offer any type of orchestration or automation capabilities. We will focus on Linux environments in this book; instructions for Windows-based environments can be found on the Elasticsearch reference guide:
https://www.elastic.co/guide/en/elasticsearch/reference/8.0/zip-windows.html
In order to complete the setup of the lab Elasticsearch cluster, please complete both the installation and configuration steps for your operating system/installation method of choice.
Elastic Stack components are often installed on dedicated hosts/machines depending on architecture, resource, and performance requirements. This chapter looks at installation while Chapter 13, Architecting Workloads on the Elastic Stack, delves into the architectural considerations around each component.
Elastic Stack components support various Linux distributions, including CentOS, RHEL, Ubuntu, and Debian. Product versions and supported operating systems can be found at https://www.elastic.co/support/matrix#matrix_os.
Note
The commands in this chapter install Elastic Stack version 7.10.0. You can alter the version in the commands to install your desired version.
Installing on Linux
On Linux operating systems, it is recommended to use package managers such as RPM or Debian to install Elasticsearch. Package-based installs are done consistently and repeatedly while ensuring best practices such as the following:
- The creation of systemd services
- The creation and configuration of specific user accounts used to run executables
- Correct filesystem permissions on config files, keystore files, and data directories
Other installation options that may work on Linux operating systems can be found on the Elastic downloads page:
https://www.elastic.co/downloads/
Using the Debian package
The following instructions describe the procedure to install Elastic Stack components on a Debian-based instance. Similar instructions are available on the online guide for each product.
Installation option 1 – using an APT repository
Execute the following commands to install using an APT repository:
- Import the Elasticsearch PGP key. This key is used to verify the integrity of the package downloaded from the APT repository:
wget -qO - https://artifacts.elastic.co/GPG-KEY-elasticsearch | sudo apt-key add –
- Install apt-transport-https to download the Debian package using a secure TLS connection:
sudo apt-get install apt-transport-https
- Add the Elastic APT repository to the sources list:
echo "deb https://artifacts.elastic.co/packages/8.x/apt stable main" | sudo tee /etc/apt/sources.list.d/elastic-8.x.list
- Install the Elasticsearch package:
sudo apt-get update && sudo apt-get install elasticsearch
Note that APT will automatically install the latest available package in the APT repository. To install a specific version, the version number can be explicitly defined in the install command:
sudo apt-get install elasticsearch=8.0.0
- Install the Kibana package:
sudo apt-get install kibana
- Install the Logstash package:
sudo apt-get install logstash
- Install the Beats packages.
You can install the desired Beat as follows:
sudo apt-get install <beat>
- To install Filebeat, run this:
sudo apt-get install filebeat
- To install Metricbeat, run this:
sudo apt-get install metricbeat
Elastic Stack components should now be installed on the system.
Installation option 2 – downloading and installing the Debian package
Execute the following commands to install using a Debian package:
- Download the Debian package:
wget https://artifacts.elastic.co/downloads/elasticsearch/elasticsearch-8.0.0-amd64.deb
- Download the checksum for the package:
wget https://artifacts.elastic.co/downloads/elasticsearch/elasticsearch-8.0.0-amd64.deb.sha512
- Verify the integrity of the downloaded package:
shasum -a 512 -c elasticsearch-8.0.0-amd64.deb.sha512
- Install Elasticsearch:
sudo dpkg -i elasticsearch-8.0.0-amd64.deb
- Download the Kibana package:
wget https://artifacts.elastic.co/downloads/kibana/kibana-8.0.0-amd64.deb
- Install Kibana:
sudo dpkg -i kibana-8.0.0-amd64.deb
- Download the Logstash package:
wget https://artifacts.elastic.co/downloads/logstash/logstash-8.0.0-amd64.deb
- Install Logstash:
sudo dpkg -i logstash-8.0.0-amd64.deb
- Download the Beats packages:
The desired Beats package can be downloaded as follows:
wget https://artifacts.elastic.co/downloads/beats/<beat>/<beat>-8.0.0-amd64.deb
For example, the Filebeat package can be downloaded as follows:
wget https://artifacts.elastic.co/downloads/beats/filebeat/filebeat-8.0.0-amd64.deb
- Install Beats.
You can install the desired Beat as follows, where <beat-name> is the name of the Beat you want to install:
sudo dpkg -i <beat-name>-<version>-amd64.deb
Filebeat can be installed as follows:
sudo dpkg -i filebeat-8.0.0-amd64.deb
You can also optionally prevent a package from being automatically updated by APT by holding a package. This can be important in production environments where you do not want to inadvertently trigger an upgrade of Elasticsearch without planning for it:
sudo apt-mark hold elasticsearch
You can remove the hold on the package by running this:
sudo apt-mark unhold elasticsearch
Elastic Stack components should now be installed on the system.
Using the RPM package
Please follow the following instructions on your Red Hat CentOS instance to install Elasticsearch. Similar instructions are available on the Elasticsearch reference guide online.
Installation option 1 – using an RPM repository
Execute the following commands to install using an RPM repository:
- Import the Elasticsearch PGP key. This key is used to verify the integrity of the RPM package downloaded:
sudo rpm --import https://artifacts.elastic.co/GPG-KEY-elasticsearch
- Add the RPM repository into yum.
Create a file called elasticsearch.repo in the /etc/yum.repos.d/ directory and copy the following text into the file:
[elasticsearch]
name=Elasticsearch repository for 8.x packages
baseurl=https://artifacts.elastic.co/packages/8.x/yum
gpgcheck=1
gpgkey=https://artifacts.elastic.co/GPG-KEY-elasticsearch
enabled=0
autorefresh=1
type=rpm-md
- Install the Elasticsearch package:
sudo yum install --enablerepo=elasticsearch elasticsearch
Yum will install the latest version of Elasticsearch available on the RPM repository by default. A specific version of Elasticsearch can be installed as follows:
sudo yum install --enablerepo=elasticsearch elasticsearch-8.0.0
- Install Kibana using yum:
sudo yum install kibana
- Install Logstash using yum:
sudo yum install logstash
- Install Beats using yum:
sudo yum install <beat-name>
sudo yum install filebeat
Elastic Stack components should now be installed on the system.
Installation option 2 – downloading and installing the RPM package
Execute the following commands to install using an RPM package:
- Download the Elasticsearch RPM package:
wget https://artifacts.elastic.co/downloads/elasticsearch/elasticsearch-8.0.0-x86_64.rpm
- Download the checksum for the RPM package:
wget https://artifacts.elastic.co/downloads/elasticsearch/elasticsearch-8.0.0-x86_64.rpm.sha512
- Verify the integrity of the RPM package:
shasum -a 512 -c elasticsearch-8.0.0-x86_64.rpm.sha512
- Install Elasticsearch:
sudo rpm --install elasticsearch-8.0.0-x86_64.rpm
- Download the Kibana RPM package:
wget https://artifacts.elastic.co/downloads/kibana/kibana-8.0.0-x86_64.rpm
- Install Kibana:
sudo rpm --install kibana-8.0.0-x86_64.rpm
- Download the Logstash RPM package:
wget https://artifacts.elastic.co/downloads/logstash/logstash-8.0.0-x86_64.rpm
- Install Logstash:
sudo rpm --install logstash-8.0.0-x86_64.rpm
- Download the Beats RPM packages:
wget https://artifacts.elastic.co/downloads/beats/<beat-name>/<beat-name>-8.0.0-x86_64.rpm
To download Filebeat, use the following:
wget https://artifacts.elastic.co/downloads/beats/filebeat/filebeat-8.0.0-x86_64.rpm
- Install Beats:
sudo rpm –install <beat-name>-8.0.0-x86_64.rpm
sudo rpm –install filebeat-8.0.0-x86_64.rpm
If you want to lock the version of Elasticsearch to prevent inadvertent or unplanned version upgrades, you can use yum-versionlock to do so.
- Install yum-versionlock:
yum -y install yum-versionlock
- Add elasticsearch to versionlock:
yum versionlock add elasticsearch
- Remove elasticsearch from versionlock when planning to upgrade:
yum versionlock remove elasticsearch
Elastic Stack components should now be installed on the system.
Using systemd to run Elasticsearch
systemd makes it easier to manage and run components on Linux-based hosts. A primary benefit is being able to automatically start processes on OS startup:
- Reload the systemd daemon:
systemctl daemon-reload
- Enable the elasticsearch service:
systemctl enable elasticsearch
- Start or stop Elasticsearch:
systemctl start elasticsearch
systemctl stop elasticsearch
This can be repeated for any of the other components that you wish to run as a service. For example, you can enable and start Kibana via systemd as follows:
systemctl enable kibana
systemctl start kibana
You should now have your components running as a systemd service.
Confirming Elasticsearch is running
Hit the Elasticsearch endpoint on port 9200 to confirm it is running.
On a shell, run the following:
curl localhost:9200
The output should look as follows:
{
"name":"test",
"cluster_name":"elasticsearch",
"cluster_uuid":"D9HthzrVRTS4yKgSNEfrjg",
"version":{
"number":"8.0.0",
"build_flavor":"default",
"build_type":"deb",
"build_hash":"51e9d6f22758d0374a0f3f5c6e8f3a7997850f96",
"build_date":"2020-11-09T21:30:33.964949Z",
"build_snapshot":false,
"lucene_version":"8.7.0",
"minimum_wire_compatibility_version":"6.8.0",
"minimum_index_compatibility_version":"6.0.0-beta1"
},
"tagline":"You Know, for Search"
}
The cluster health API can also be used to ensure the Elasticsearch instance is green and has no unassigned shards.
On a shell, run the following:
curl localhost:9200/_cluster/health
The output should look as follows:
{
"cluster_name":"elasticsearch",
"status":"green",
"timed_out":false,
"number_of_nodes":1,
"number_of_data_nodes":1,
"active_primary_shards":0,
"active_shards":0,
"relocating_shards":0,
"initializing_shards":0,
"unassigned_shards":0,
"delayed_unassigned_shards":0,
"number_of_pending_tasks":0,
"number_of_in_flight_fetch":0,
"task_max_waiting_in_queue_millis":0,
"active_shards_percent_as_number":100.0
}
This means that Elasticsearch is running.
Confirming Kibana is running
Navigate to http://localhost:5601 on your web browser to confirm that Kibana is running successfully. The following screenshot shows the home page of Kibana:
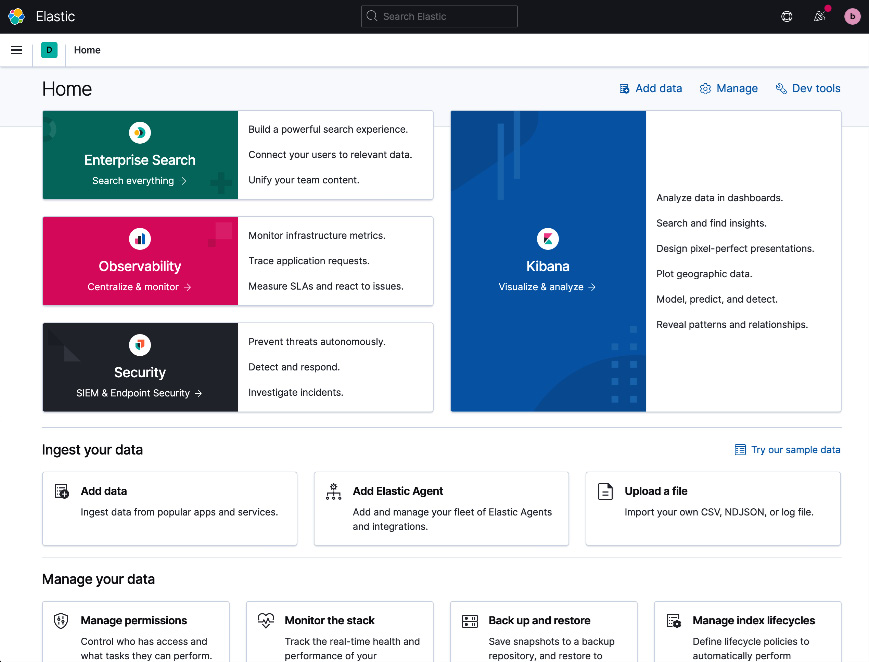
Figure 2.1 – Standalone Kibana instance running
If everything has gone to plan, you should now have Elasticsearch and Kibana running and ready to use.
Configuring the components
Elastic Stack components can generally run with minimal configuration changes once installed. This makes it quick and easy to get a dev or test environment up and running. The following sections describe the main configuration files, and some common settings for each component.
The primary configuration file for each Elastic Stack component is defined using the YAML format.
Configuring Elasticsearch
Elasticsearch runs on a Java Virtual Machine (JVM). JVM settings can be tweaked using the jvm.options file (/etc/elasticsearch/jvm.options). While most JVM settings will rarely have to be changed, you will almost always need to set the heap size for production clusters.
Elasticsearch heavily utilizes heap memory to index and search through data. Production clusters should specify the appropriate heap size (depending on the cluster size required) on every Elasticsearch node to ensure sufficient memory is available for use. Chapter 13, Architecting Workloads on the Elastic Stack, of this book looks at sizing Elasticsearch clusters for production use.
It is recommended to set the minimum and maximum heap size to the same value to avoid resource-intensive memory allocation processes during node operations. It is also a good idea to allocate no more than half the available memory on a node to the JVM heap; the remaining memory will be utilized by the operating system and the filesystem cache. As such, a node with 8 GB RAM, for example, should therefore have 4 GB allocated to the heap:
- Configure the jvm.options file (/etc/elasticsearch/jvm.options) by adding the following lines:
-Xms4g # Minimum heap size
-Xmx4g # Maximum heap size
- Configure the node settings using the elasticsearch.yml file (/etc/elasticsearch/elasticsearch.yml).
Some common node settings are highlighted in the following code block. While a single-node Elasticsearch cluster will start up without any changes to the config file, the following settings need to be put in place to create an Elasticsearch cluster:
# All nodes in a cluster should have the same name
cluster.name: lab-cluster
# Set to hostname if undefined
node.name: node-a
# Port for the node HTTP listener
http.port: 9200
# Port for node TCP communication
transport.tcp.port: 9300
# Filesystem path for data directory
path.data: /mnt/disk/data
# Filesystem path for logs directory
path.logs: /mnt/disk/logs
# List of initial master eligible nodes
cluster.initial_master_nodes:
# List of other nodes in the cluster
discovery.seed_hosts:
# Network host for server to listen on
network.host: 0.0.0.0
The filesystem paths used for the path.data and path.logs settings should point to existing directories on the host, where the Elasticsearch process has read and write permissions.
We will look at multi-node and dedicated node type clusters in Chapter 3, Indexing and Searching for Data.
- Dynamic settings on Elasticsearch can be controlled using the _cluster/settings API rather than editing the elasticsearch.yml file. On Kibana Dev Tools, you can try the following to update the dynamic action.auto_create_index setting.
This setting will allow Elasticsearch to automatically create indices that start with the word logs if a document is received for a target index that doesn't exist:
PUT _cluster/settings
{
"persistent": {
"action.auto_create_index": "logs*"
}
}
An exhaustive list of all cluster settings and configuration options is available in the Elasticsearch reference guide: https://www.elastic.co/guide/en/elasticsearch/reference/8.0/settings.html.
Configuring Kibana
The kibana.yml file can be used to control Kibana configuration options. Some common Kibana configuration settings are highlighted as follows:
# Port for Kibana webserver to listen on
server.port: 5601
# Address/interface for Kibana to bind to.
server.host: 0.0.0.0
# List of Elasticsearch nodes for Kibana to connect to.
# In a multi node setup, include more than 1 node here (ideally a data node)
elasticsearch.hosts: ["http://elasticsearch1.host:9200", "http://elasticsearch2.host:9200"]
# Credentials for Kibana to connect to Elasticsearch if security is setup
elasticsearch.username: "kibana_system"
elasticsearch.password: "kibana_password"
An exhaustive list of all Kibana configuration options is available in the Kibana reference guide:
https://www.elastic.co/guide/en/kibana/8.0/settings.html
Beats and Logstash configuration options heavily depend on the data that is being collected and processed. We will look at these settings in more detail in Chapter 6, Collecting and Shipping Data with Beats, and Chapter 7, Using Logstash to Extract, Transform, and Load Data, later in the book.
Summary of configuration file locations
This table summarizes the location of config files and home directories for each Elastic Stack component:

Table 2.1 - Overview of configuration file locations
Note
You can optionally choose to run Elastic Stack components from tar archives instead of using package managers. This can be especially useful during development and testing but would not be recommended in production environments.
We looked at various options for installing Elastic Stack components manually in this section. The next section will focus on using automation to install and run Elastic Stack components.
Automating the installation
Configuration management tools such as Ansible and Puppet can be used to automate the installation and configuration of Elasticsearch clusters and other components. Using automation for installation comes with the following benefits:
- Quick deployment times, especially for large clusters.
- Reduces the risk of the misconfiguration of nodes.
- Automation configuration can be tracked in source control and integrated as part of your CI/CD processes.
- Automation can be run at regular intervals in an idempotent manner to revert any manual configuration changes to the environment.
- Components can be easily replicated in other environments (such as dev/staging before rolling out to production).
- Can be used as part of a disaster recovery strategy to quickly re-create the cluster and components in an alternate cloud region or data center in the event of a disaster.
You can use the tool and framework of your choice to automate the installation of Elasticsearch. In this book, we look at using Ansible to implement automation.
Using Ansible for automation
Ansible is a popular open source configuration management tool, primarily used in Unix-based environments. Ansible works over SSH and does not need an agent to be deployed on target hosts.
Important Ansible concepts
We will regularly use Ansible in this book to quickly deploy test environments. The following concepts are worth understanding, especially when adapting the sample code provided for your own requirements:
- A control node is the host that runs Ansible. Control nodes connect to "managed nodes" over SSH to execute automation tasks.
- A managed node is a host that is managed by a control node. This node will often run your workloads (such as Elasticsearch).
- A task is a single Ansible action that can be executed on a managed node. For example, the instruction to copy a file over to the managed node would be a single Ansible task.
- An inventory is a list of managed nodes. Inventories can be grouped using labels in order to run tasks against a subset of inventory nodes as required.
- A playbook is an ordered list of tasks that can be run against an inventory of hosts in a consistent and repeatable manner.
- A role is a convenient way to structure and share automation code. A role will often focus on a single objective (such as installing Elasticsearch) and can group together all related tasks, variables, files, and templates.
Pre-requisites for Ansible deployments
We will look at installing and configuring a three-node Elasticsearch cluster using Ansible:
- The first step is provisioning an infrastructure to run Elasticsearch.
You can use your preferred cloud provider to provision three compute instances to run Elasticsearch on. You can provision test instances with the following or similar specifications:
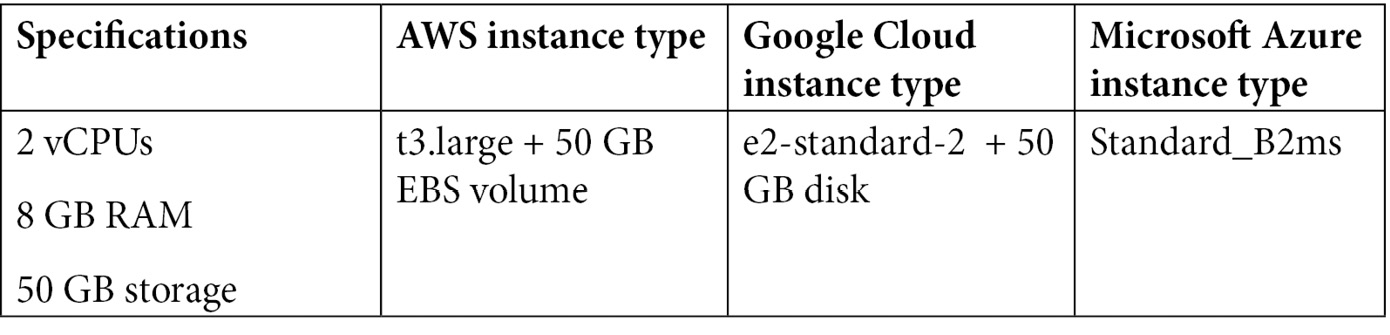
Table 2.2 - Infrastructure requirements for deployment
You can also use tools such as Terraform to provision and manage compute instances by declaratively defining infrastructure as code. Tools such as Terraform can work across multiple cloud providers.
- Install Ansible on your computer. Instructions to install Ansible can be found at https://docs.ansible.com/ansible/latest/installation_guide/intro_installation.html.
Ensure you can SSH to the managed nodes using public-key authentication. Have the following command-line tools installed on the control host:
- git – used to clone the Ansible role from GitHub
- curl – used to interact with the Elasticsearch REST API
- jq – used to process and format JSON responses
Running the Ansible playbook
This section will look at using Ansible to install Elasticsearch.
Note
This section omits part of the code for readability. The complete code can be found in Chapter2/elasticsearch-playbook in this book's GitHub repository.
Follow these instructions to create and run Ansible playbooks to deploy Elasticsearch:
- Create your playbook directory and clone the Ansible Elasticsearch role:
mkdir elasticsearch-playbook && cd elasticsearch-playbook
mkdir -p roles/ansible-elasticsearch
git clone https://github.com/elastic/ansible-elasticsearch.git roles/ansible-elasticsearch
- Create your inventory file:
touch test_inventory
- Add the hosts provisioned (with a reference name and their IP address) to the test_inventory file as shown here:
[node1]
35.244.101.47
[node2]
35.244.118.143
[node3]
35.189.50.32
[elasticsearch:children]
node1
node2
node3
Please note that the IP addresses used here are example values and must be replaced with your own values.
- Create your playbook file:
touch playbook.yml
- Add the following configuration to the playbook.yml file as shown in the preceding code block (replacing the values for IP addresses with your node IPs). Note that spaces and indentation in YAML files are part of the syntax; incorrect indentation may result in errors being reported. The code repository contains this file with the correct indentation:
- name: Bootstrap node
hosts: node1
roles:
- role: ansible-elasticsearch
vars:
es_config:
cluster.name: "test-cluster"
cluster.initial_master_nodes: ["35.244.101.47", "35.244.118.143", "35.189.50.32"]
discovery.seed_hosts: ["35.244.101.47:9300", "35.244.118.143:9300", "35.189.50.32:9300"]
es_heap_size: 4g
- name: Node 2 and 3
hosts: [node2, node3]
roles:
- role: ansible-elasticsearch
vars:
es_config:
cluster.name: "test-cluster"
cluster.initial_master_nodes: ["35.244.101.47", "35.244.118.143", "35.189.50.32"]
discovery.seed_hosts: ["35.244.101.47:9300", "35.244.118.143:9300", "35.189.50.32:9300"]
es_heap_size: 4g
- Run your playbook:
ansible-playbook -i test_inventory playbook.yml
You should see the following output once Ansible has finished running your playbook:
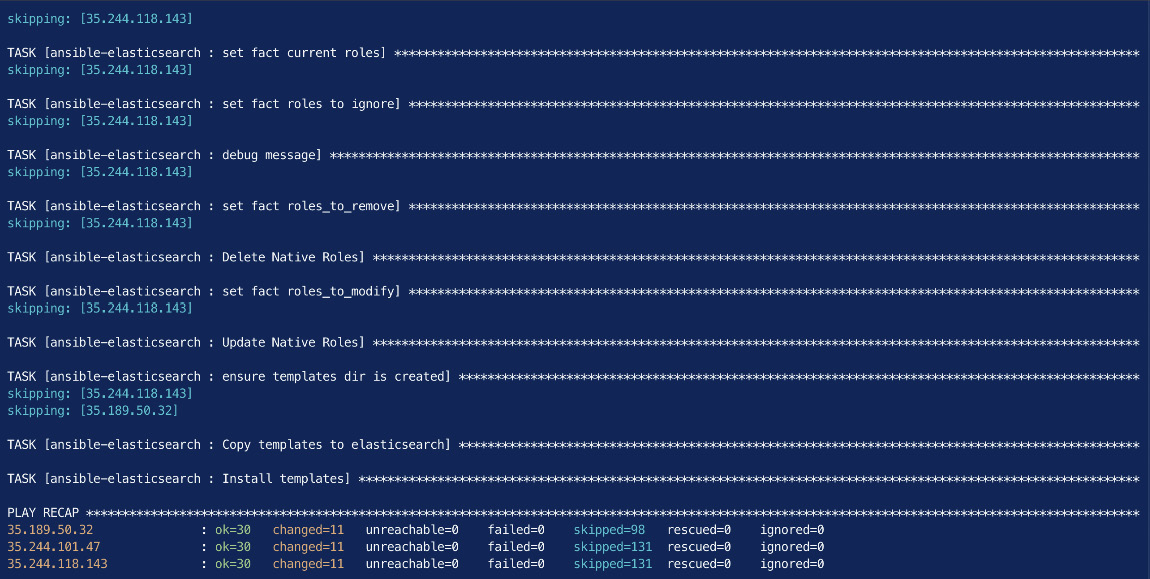
Figure 2.2 – Successful completion of the Ansible playbook to install Elasticsearch
- Verify Elasticsearch is running, and a cluster has formed (replacing node1-ip with the IP address for node 1):
curl http://node1-ip:9200/
curl http://node1-ip:9200/_cluster/health
curl http://node1-ip:9200/_cat/nodes
The output should look as follows:
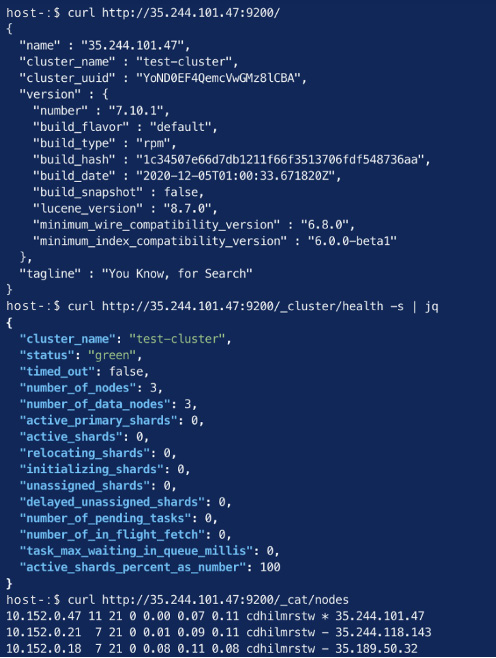
Figure 2.3 – Elasticsearch running and displaying cluster health
While we only look at the Ansible role for Elasticsearch in this book, roles for Kibana, Logstash, and Beats have been created by the community and can be found online if required.
Using Elastic Cloud Enterprise (ECE) for orchestration
Managing large Elasticsearch clusters manually can often require a lot of work. Scaling clusters and managing version upgrades and so on requires administrators to plan and execute changes, often in sensitive environments. This effect can be compounded if a team is managing multiple Elasticsearch deployments within an organization. Orchestration capabilities can significantly help in such scenarios.
ECE is a subscription product offered by Elastic, giving teams the ability to provision and manage Elasticsearch deployments using an easy-to-use API or a web interface. ECE can handle rolling upgrades to deploy changes in configuration, stack version upgrades, and deployment scaling events without any manual intervention. It also supports multi-zone setups to provide high availability to Elasticsearch deployments.
ECE architecture
ECE uses Docker to run platform services as virtualized components. It relies on the following components to orchestrate and manage Elasticsearch deployments.
The control plane
The control plane is responsible for the management of the ECE platform. The control plane performs the following tasks:
- Managing memory usage and capacity on ECE allocator nodes (allocator nodes are described in the next subsection)
- Storing and managing the routing and proxy configurations for allocator nodes and the Elasticsearch deployments on the platform
- Acting as the single source of truth for deployment configuration and state
- Serving the cloud UI and ECE API
- Monitoring new requests from the API and acting on them as necessary
- Assigning Elasticsearch cluster nodes to allocators to maximize resource utilization while enforcing availability zone compliance
Allocators
Allocators on ECE are hosts that run Elasticsearch and Kibana instances. Elasticsearch and Kibana run as Docker containers on the allocator hosts. Capacity on ECE can be scaled by adding in more allocators; allocators should usually contain enough memory to run multiple Elasticsearch instances.
In addition to hosting instances, allocators also perform the following tasks:
- Creating, restarting, or terminating instance containers when required by the control plane
- Communicating memory capacity to the control plane to maximize resource utilization
Proxies
As Elasticsearch/Kibana deployments can be hosted across multiple allocators on ECE, proxies act as the ingress point for any ingest/search clients and users wanting to access these instances. Proxies perform the following tasks:
- Routing requests to the correct Elasticsearch/Kibana instance using the deployment ID that is part of the request. UUID/container mappings are stored within the control plane but cached by the proxies to reduce the impact of any control plane downtime on the workloads.
- Performing health checks on availability zones and routing requests away from unhealthy zones.
- Enabling zero-downtime rolling upgrades by routing requests to new Elasticsearch nodes only after shard migration has been completed.
ECE installation size
Your ECE deployment can be architected depending on the scale and the availability you would like to run it with. The different installation options determine where each of the ECE architectural components is installed:
- A small installation can have three hosts with each host running all three components (control plane, proxy, and allocator).
- A medium installation can have six hosts. Three hosts run the control plane and the proxy roles, while the other three hosts run the allocator role. Having three hosts running the control plane makes the deployment highly available; the failure of a single node will mean that the two remaining hosts can still reach quorum and continue operating. Additional allocators can be added to this topology to increase capacity.
- A large installation will require a minimum of nine hosts: three hosts for the control plane, three hosts for proxies, and three or more hosts for allocators. Three hosts for the control plane and proxy nodes are recommended for high availability in case of node failure. Additional allocator hosts can be added to increase platform capacity.
As installation sizes increase, ECE components are deployed on individual hosts to improve resiliency in the event of host failure while increasing available resources to each component.
Hardware recommendations for each component size can be found in the ECE documentation guide:
https://www.elastic.co/guide/en/cloud-enterprise/current/ece-hardware-prereq.html
The following diagram illustrates how ECE components interact with each other in the architecture:
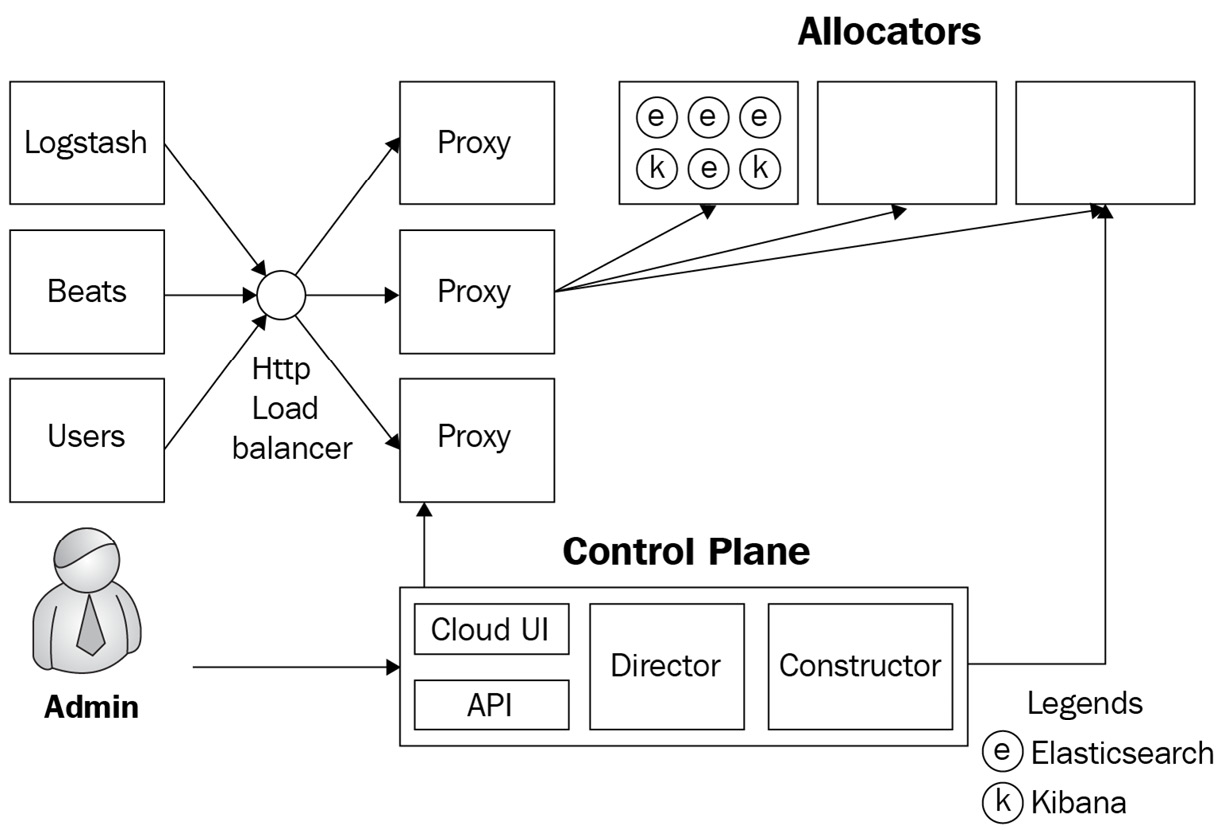
Figure 2.4 – ECE component architecture
The next section will look at installing ECE.
Installing ECE
ECE can be installed on a single instance in test environments, or across multiple instances in production setups. Multi-instance installations provide high availability and better scalability for ECE components.
Before proceeding with the installation, do the following:
- Provision three compute instances or virtual machines with at least four virtual CPUs and 8 GB RAM each.
- Ensure Ansible is installed on your local machine as specified in the Technical requirements section earlier in the chapter.
- Install the ecctl command-line tool from the following GitHub repository:
https://github.com/elastic/ecctl
The code for the Ansible playbooks can be found in Chapter2/ece-playbook in this book's GitHub repository. Execute the following instructions to install ECE using the Ansible role:
- Create your playbook directory and clone the Ansible Elasticsearch role:
mkdir ece-playbook && cd ece-playbook
mkdir -p roles/ansible-ece
git clone https://github.com/elastic/ansible-elastic-cloud-enterprise.git roles/ansible-ece
touch test_inventory
touch playbook.yml
- Create your inventory file.
Add your hosts to the test_inventory file as follows with the corresponding IP or hostname for your instances:
[primary]
host1-ip
[secondary]
host2-ip
[tertiary]
host3-ip
[ece:children]
primary
secondary
tertiary
- Create your playbook file. Add the following configuration to the playbook.yml file as shown in the preceding code block. Replace the value for <path_to_ssh_key> with the file path to your public SSH key. This key will be configured on the remote hosts for SSH login using the elastic user account:
---
- hosts: primary
become: yes
gather_facts: true
roles:
- ansible-ece
vars:
ece_primary: true
elastic_authorized_keys_file: "<path_to_ssh_key>"
availability_zone: "zone-1"
- hosts: secondary
become: yes
gather_facts: true
roles:
- ansible-ece
vars:
ece_roles: [director, coordinator, proxy, allocator]
elastic_authorized_keys_file: elastic_authorized_keys_file: "<path_to_ssh_key>"
availability_zone: "zone-2"
- hosts: tertiary
become: yes
gather_facts: true
roles:
- ansible-ece
vars:
ece_roles: [director, coordinator, proxy, allocator]
elastic_authorized_keys_file: elastic_authorized_keys_file: "<path_to_ssh_key>"
availability_zone: "zone-3"
- Run your playbook as follows. The –skip-tags command-line flag is used to instruct Ansible to skip all tasks in the role with the setup_filesystem tag as this example uses the root filesystem on the host:
ansible-playbook -i test_inventory playbook.yml –skip-tags setup_filesystem
This screenshot shows the output from running the Ansible playbook:
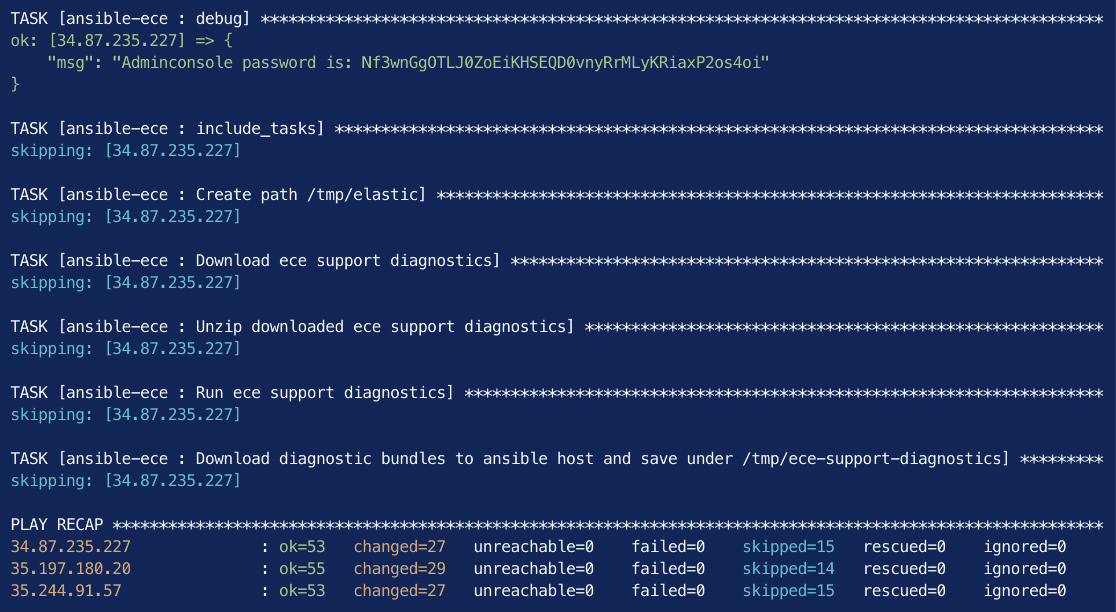
Figure 2.5 – Successful completion of the Ansible playbook to install ECE
You can navigate to the ECE admin console by following the link from the Ansible output. The admin console will be reachable at https://<your-host-ip>:12443. The following screenshot shows some system deployments on ECE that exist on a fresh installation:
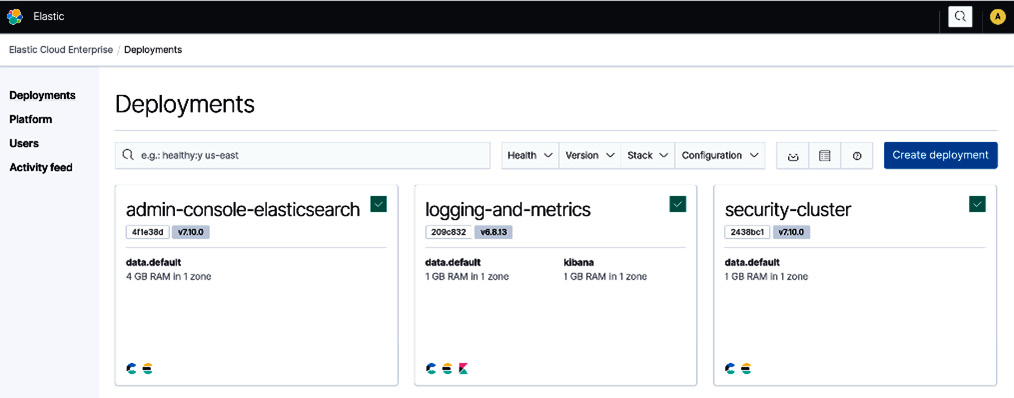
Figure 2.6 – ECE home page showing current deployments
You can verify ECE platform topology such as the number of instances, zones they're in, and the roles they have by navigating to the platform summary page as shown here:

Figure 2.7 – ECE platform summary page showing current capacity and number of nodes
You should now have a running installation of ECE.
Creating your deployment on ECE
A deployment on ECE consists of an Elasticsearch cluster (containing one or more nodes) and one or more instances of Kibana that are connected to the cluster. You can create a new deployment on ECE by clicking on the Create deployment button from the Deployments page. When creating a deployment, you can do the following:
- Select a preconfigured template (Security, Enterprise Search, or Observability) if you have a specific use case or proceed with Elastic Stack if you need a generic deployment.
- Select whether the deployment needs custom hardware profiles for Elasticsearch nodes (such as hot/warm nodes). We will look at custom hardware profiles and architectures such as cross-cluster search in Chapter 13, Architecting Workloads on the Elastic Stack.
- Select the version of Elastic Stack for the deployment.
- Configure the deployment monitoring settings.
- Configure the deployment security settings.
The Create deployment screen looks as follows:
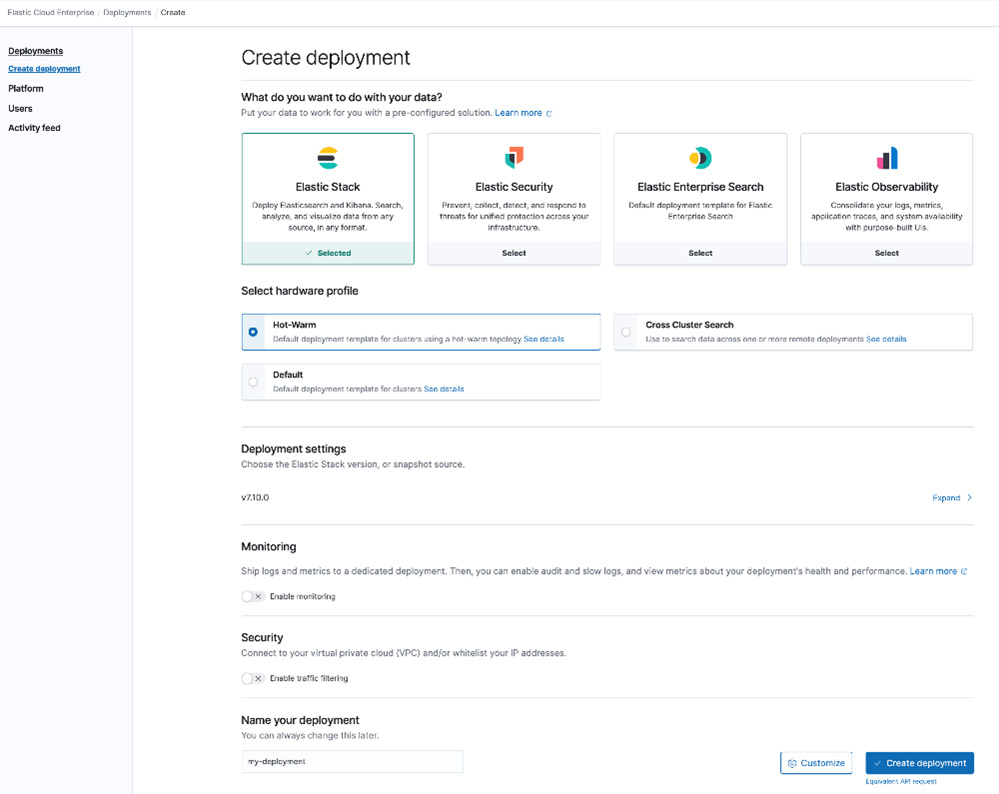
Figure 2.8 – Create deployment page on ECE
Once you create a deployment, ECE will orchestrate the Elasticsearch and Kibana instances. You should be able to see your deployment created as shown in the following screenshot:
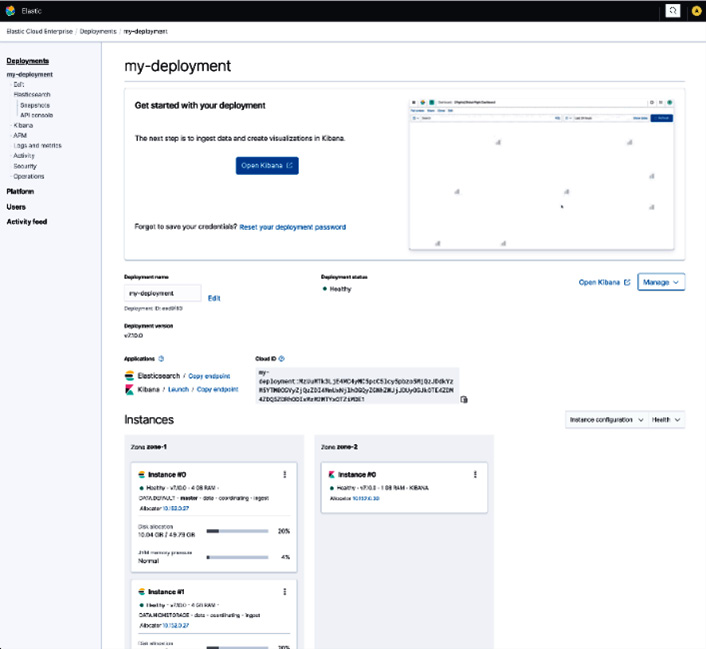
Figure 2.9 – New Elasticsearch deployment created on ECE
ECE will create an "elastic" user account and a password that you can download from the UI. This user account has administrator privileges on the cluster. ECE can automatically authenticate the current ECE admin user into Kibana. Non-ECE users who need to access Elasticsearch deployments can use usernames/passwords created on Kibana to authenticate.
You can click on the Launch link for Kibana to see your Kibana home screen as shown in the following screenshot:
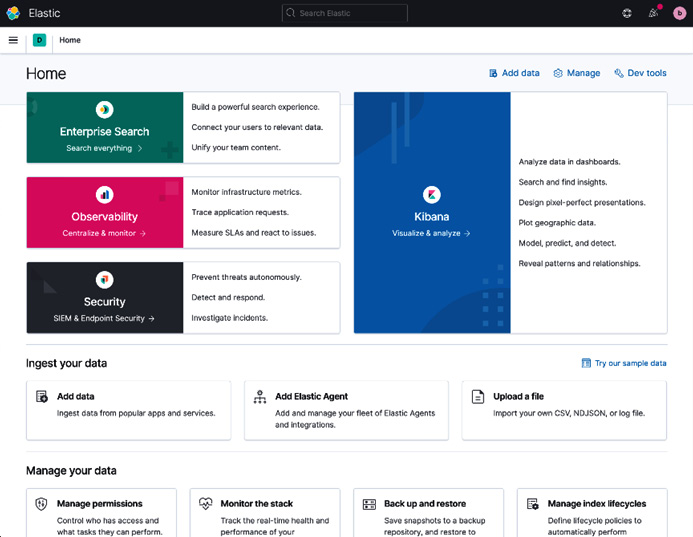
Figure 2.10 – Kibana home page on new ECE deployment
Creating deployments programmatically
Deployments on ECE can be created programmatically using the ecctl command-line tool. ecctl helps with automating the creation and management of Elasticsearch deployments on ECE. Cluster configuration can be stored in a version-controlled file and can be made part of automation tooling.
To create a deployment using the tool, do the following:
- Initialize ecctl:
ecctl init –insecure
Follow the prompt to enter your ECE admin console username and password to authenticate with ECE.
The –insecure flag can be used to temporarily disable SSL verification on the ECE API host. A trusted SSL certificate can be configured in production scenarios.
- Create your deployment.
The deployment.json file can be found in the code samples repository for this chapter:
ecctl deployment create --file ecctl/deployment.json
The following screenshot shows the successful creation of an API-based deployment using ecctl:
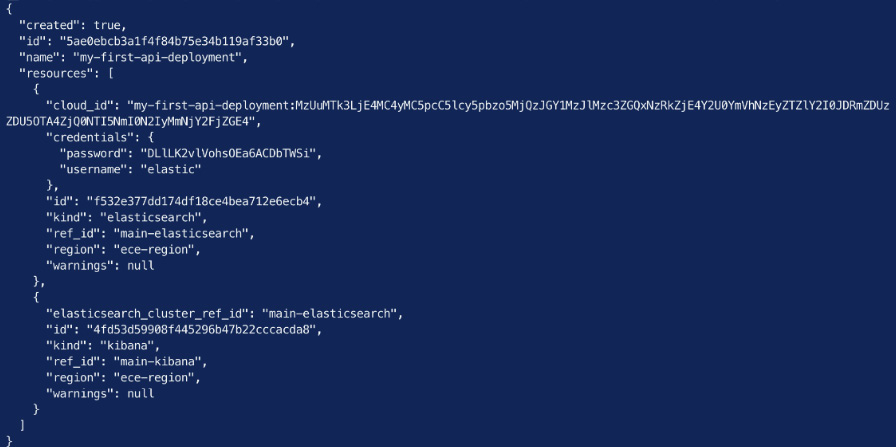
Figure 2.11 – Creating a deployment with ecctl and verifying it was created
You can navigate to the deployment on the ECE admin console by clicking on Deployments on the left menu, and then the name of your deployment. You should see details about your deployment, including the running Elasticsearch and Kibana nodes, as shown in the following screenshot:

Figure 2.12 – New ecctl deployment successfully created on ECE
Next, we'll look at orchestrating Elasticsearch deployments on Kubernetes.
Running on Kubernetes
Elastic Stack components can be run on Kubernetes using Elastic Cloud on Kubernetes (ECK). Kubernetes is an open source platform for managing containerized workloads using declarative configuration. Kubernetes is a popular platform used by many organizations for existing workloads. ECK is a Kubernetes operator that supports the orchestration of Elasticsearch, Kibana, and Beats deployments. It can also handle rolling upgrades and configuration changes without downtime. The ECK operator allows teams that run existing workloads on Kubernetes to deploy and manage multiple Elasticsearch deployments on the same platform they already use with ease.
Note
ECK is a paid subscription feature offered by Elastic.
Provision a Kubernetes cluster to test the deployment of Elasticsearch and Kibana before running the following commands. You can use either a local or a cloud-based managed Kubernetes cluster, such as Google GKE or AWS EKS:
- Install the ECK Kubernetes operator:
kubectl create -f https://download.elastic.co/downloads/eck/1.9.1/crds.yaml
kubectl apply -f https://download.elastic.co/downloads/eck/1.9.1/operator.yaml
- Create a uniform three-node Elasticsearch cluster:
cat <<EOF | kubectl apply -f -
apiVersion: elasticsearch.k8s.elastic.co/v1
kind: Elasticsearch
metadata:
name: my-cluster
spec:
version: 8.0.0
nodeSets:
- name: default
count: 3
config:
node.store.allow_mmap: false
EOF
This screenshot shows new Kubernetes Pods for the Elasticsearch nodes we just provisioned using ECK:
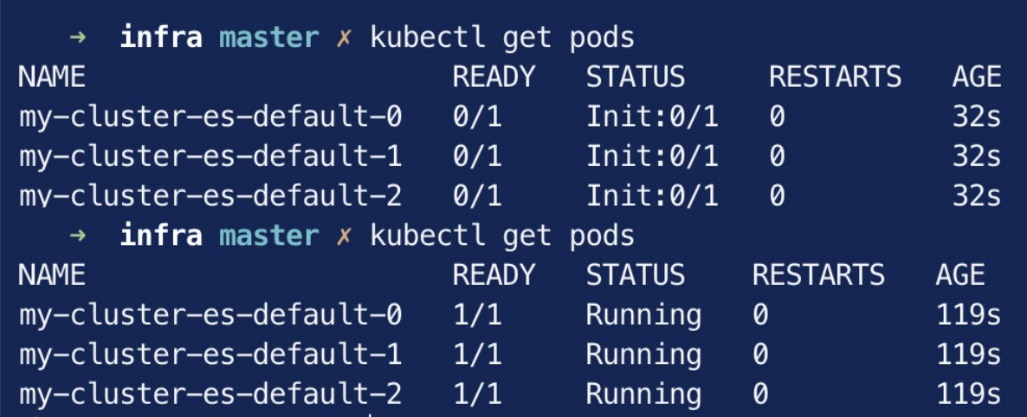
Figure 2.13 – New Pods running Elasticsearch nodes
a. Get the Elasticsearch password:
PASSWORD=$(kubectl get secret my-cluster-es-elastic-user -o go-template='{{.data.elastic | base64decode}}')
echo $PASSWORD
b. Set up port forwarding from your local machine to your Kubernetes cluster so you can connect to Elasticsearch. In a new terminal session, run the following:
kubectl port-forward service/my-cluster-es-http 9200
c. Interact with Elasticsearch. Replace the text $PASSWORD with the password obtained in Step 3a:
curl -u "elastic:$PASSWORD" -k https://localhost:9200
This screenshot shows an API call to Elasticsearch running on your Kubernetes cluster:
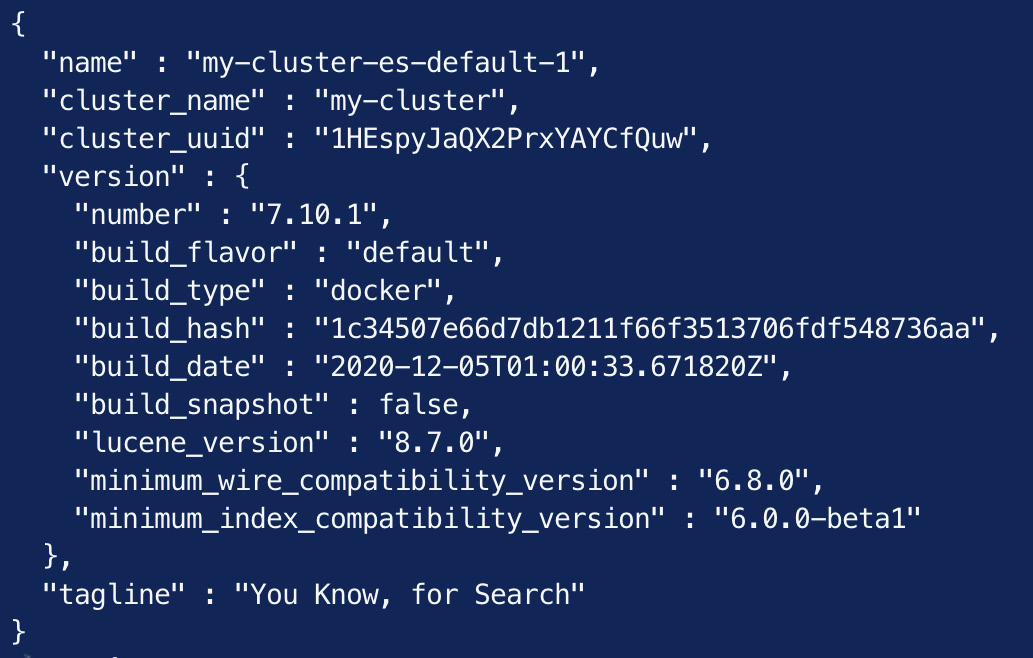
Figure 2.14 –Elasticsearch running on Kubernetes
- Deploy an instance of Kibana:
# Deploy Kibana
cat <<EOF | kubectl apply -f –
apiVersion: kibana.k8s.elastic.co/v1
kind: Kibana
metadata:
name: my-cluster
spec:
version: 8.0.0
count: 1
elasticsearchRef:
name: my-cluster
EOF
- Check that Kibana is running by executing the following command:
kubectl get kibana
This screenshot shows the new instance of Kibana running on your Kubernetes cluster:

Figure 2.15 – A Kibana instance running on Kubernetes
a. Set up port forwarding from your local machine to the Kubernetes cluster:
kubectl port-forward service/my-cluster-kb-http 5601
b. Navigate to https://localhost:5601 on your browser and log in with the user elastic and the password obtained in Step 3a.
From the navigation menu on the left side of the screen, click on Dev Tools under the Management section. The Dev Tools console can be used to interact with the Elasticsearch REST API. You can run the following commands to inspect the underlying Elasticsearch cluster:
GET _cluster/health
GET _cat/nodes
You should see output as follows:
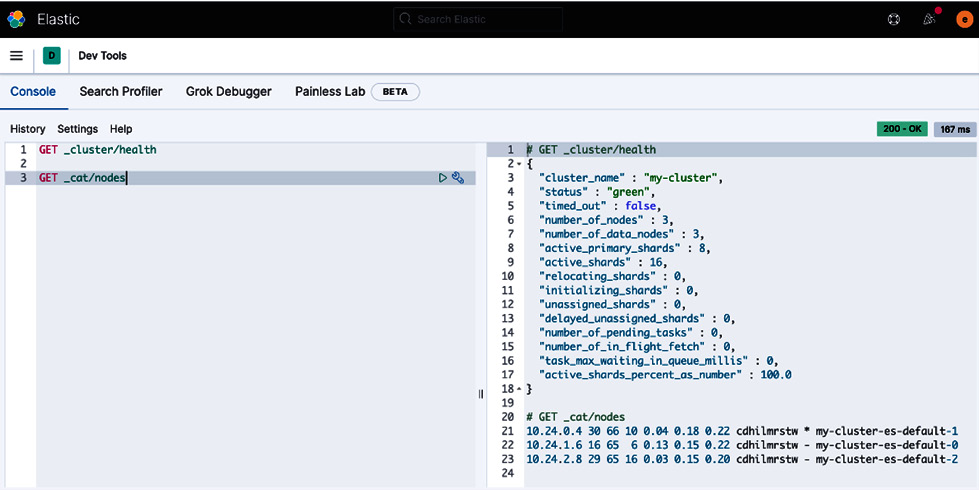
Figure 2.16 – The status and nodes of the underlying Elasticsearch cluster on Kubernetes
Next, we will look at configuring the lab environment for the rest of the book.
Configuration of your lab environment
For the rest of the book, the default lab environment should consist of at least the following:
- A single-node Elasticsearch cluster with at least a 500 MB heap
- A single instance of Kibana connected to the Elasticsearch cluster
- A single instance of Logstash
- The ability to install and run Beats as required
For convenience, you may choose to run all of the above on your local machine. Archives of each component can be downloaded and run whenever needed. Exercises in the book will assume you have Elasticsearch and Kibana up and running. Instructions to start Logstash/Beats instances will be included.
Some of you may also choose to use a cloud-based managed deployment of Elasticsearch and Kibana. Elastic Cloud provides a free trial for those interested in this option.
Summary
In this chapter, we explored multiple options to install and run the core components of the Elastic Stack. We looked at manual installation options on Linux hosts before automating installations using Ansible. We also looked at orchestrating Elasticsearch deployments using ECE and ECK. Finally, we looked at what a lab environment might look like for you to follow along in the chapters ahead.
Now that we can successfully install and run Elastic components, the following chapter will dive deep into Elasticsearch. We will explore Elasticsearch concepts and approaches to configuring our first Elasticsearch cluster.