
Chapter 6: Collecting and Shipping Data with Beats
Previous chapters looked at how Elasticsearch can be used to search and analyze data to solve various use cases. Given that data can be generated anywhere in your environment, and on a large range of source systems, a key challenge to solve is collecting and shipping this data to your data platform.
In this chapter, we'll look at how Beats agents can be used to collect and transport events from a number of source systems to Elasticsearch. The agent you use will depend on the nature of the event (whether it's a log or metric) and how it can be extracted (using a REST API, tailing a file, or instrumenting an application). The chapter also demonstrates how Beats modules help keep the schema and format of your data consistent for downstream use cases (such as searching, alerting, and machine learning analysis).
In this chapter, we will specifically focus on the following:
- How a Beats agent works and the different agents on offer
- Collecting logs using Filebeat
- Collecting system or platform metrics using Metricbeat
- Collecting system audit and security events using Auditbeat
- Monitoring the uptime and availability of services using Heartbeat
- Collecting network traffic data using Packetbeat
Technical requirements
To see data collection methodologies in action, this chapter will use a web server configured to serve a static HTML web page. Follow these instructions to set up and configure this component before reading ahead:
- Provision and configure a virtual machine (locally or on a cloud service) with at least 2 vCPUs and 4 GB memory. This chapter will use a machine running Ubuntu 16.04, but you can choose any compatible Linux operating system of your choice, as described in Chapter 2, Installing and Running the Elastic Stack.
- We will use nginx to serve our static web page. Nginx is an open source web server and reverse proxy application. With the appropriate privileges (using sudo where necessary on your OS), run the following commands to install nginx:
sudo apt-get update
sudo apt-get install nginx
- Confirm nginx is installed by running this:
nginx -v
- The code repository for this chapter contains a static website in Chapter6/html-webpage. The following commands create a new directory on the server and copy the HTML files for the server to use:
sudo mkdir -p /var/www/elastic-stack-server
cd /tmp
git clone https://github.com/PacktPublishing/Getting-Started-with-Elastic-Stack-8.0.git
sudo cp -r Getting-Started-with-Elastic-Stack-8.0/Chapter6/html-webpage/* /var/www/elastic-stack-server
- Edit the /etc/nginx/sites-enabled/default file to update the default nginx configuration to serve the example web page. A copy of this file is available in Chapter6/nginx-configuration.conf.
- Start nginx and confirm the web page is accessible on the IP address of the virtual machine (may be accessed via localhost if you are working directly on the virtual machine):
sudo systemctl restart nginx
sudo systemctl status nginx
Nginx should be reported as active as shown in the following screenshot:
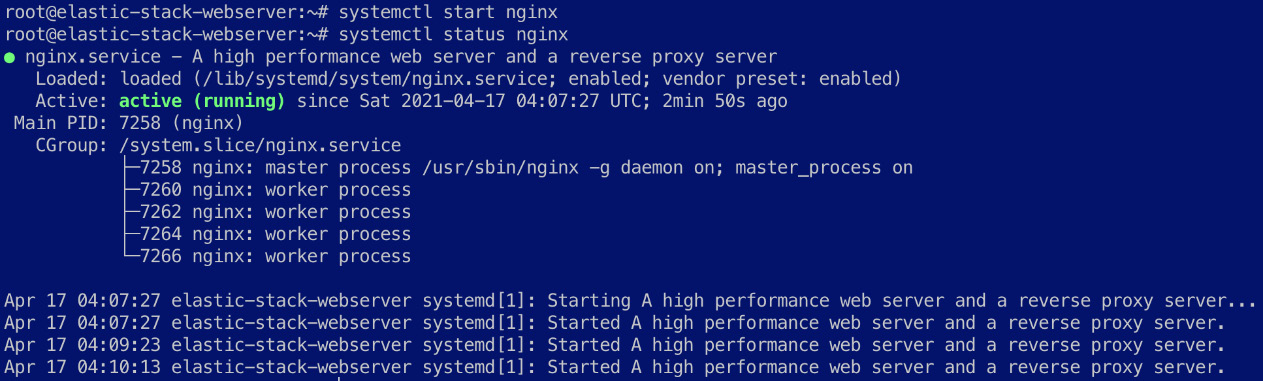
Figure 6.1 – Nginx service running and active
Navigate to the virtual machine IP address using your browser to confirm the web page is accessible.
You should see the Recipe Search Service web page load as follows:
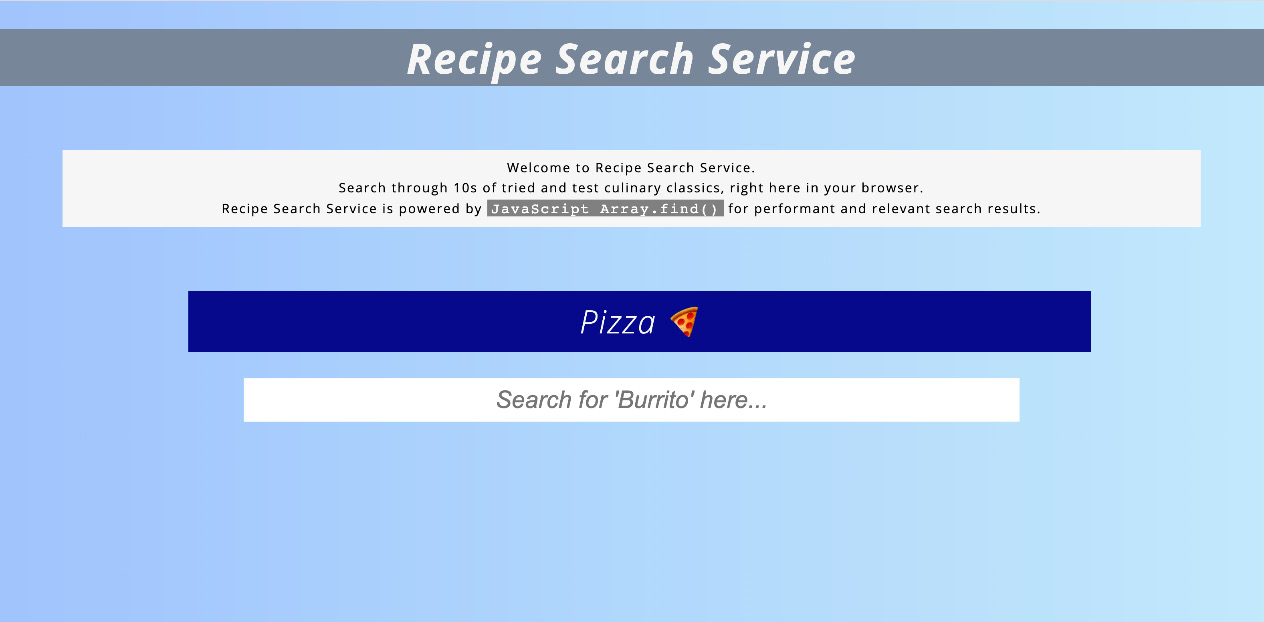
Figure 6.2 – Recipe Search Service web page on the web server
- Nginx, by default, should write web server access and error logs to the /var/log/nginx path. Confirm the logs are being written to as expected:
ls -lah /var/log/nginx
Following are the log files generated by the web server:

Figure 6.3 – Log files generated by the web server
Now that the web server is configured to serve the sample page, we will take a closer look at what role Elastic Beats agents play in the collection of logs, metrics, and data from machines across your environment.
Introduction to Beats agents
A key characteristic of modern IT environments is that useful data is generated everywhere. Appliances sitting on the edge of your network can have important metrics to capture; a fleet of frontend, backend, and database servers can generate critical error or warning logs, and the application your customer runs can generate in-depth instrumentation and tracing related to application performance bottlenecks you care about. Data is not only dispersed across the environment but is also varied in terms of the nature of the information, how it's structured, and how it should be collected.
When data is generated, it typically will need to be shipped to a centralized logging platform for search, correlation, and analysis. Beats agents are designed to collect and ship the data to such a central destination.
Note
A log contains information about a specific event generated by a system or application while a metric is a measurement of the state of a system or application at a given point in time.
The following list summarizes the officially supported list of Beats agents and the types of data sources they can be used to collect:
- Filebeat – Collecting system and application log data from a range of locations such as the following:
- Files on disk
- HTTP API endpoints
- Message streams such as Kafka, Azure Event Hubs, and GCP Pub/Sub
- Syslog listeners
- Metricbeat – Collecting system, application, and platform metrics from a range of supported systems and protocols.
- Auditbeat – Collecting operating system audit data as prescribed by a framework called the Linux Auditing System (also known as auditd).
- Heartbeat – Collecting information and monitoring the uptime and availability of applications and services by probing over ICMP, TCP, and HTTP protocols.
- Packetbeat – Collecting and decoding real-time network packet information on a given host for analysis. While network flow information is captured for all communications, select protocols can also be further decoded to obtain deeper insight into activities on a system.
- Winlogbeat – Collecting Windows event logs (such as system, application, security, and so on) from Windows APIs.
- Functionbeat – A special Beat you can run as a function on a serverless platform such as AWS Lambda or Google Cloud Functions to collect data from cloud-native log sources such as CloudWatch Logs, GCP Pub/Sub, and AWS Kinesis. Functionbeat can be especially beneficial when setting up cloud architecture patterns that may require instant scaling to cope with workloads.
The following sections will explore the main Beats agents in further detail.
Collecting logs using Filebeat
If you have successfully set up nginx to serve the Recipe Search Service web page, you will have noticed some access and error logs being generated for every request served by the web server. The logs can often contain useful insights into how the web server is being used, the distribution of requests being made, and where requests originate from.
Collecting these logs using Filebeat is easy. Follow the instructions to set up the Filebeat agent to collect the logs and ship them to your Elasticsearch deployment for analysis:
- Install Filebeat on the web server host. Detailed installation options for installing Elastic Stack components are provided in Chapter 2, Installing and Running the Elastic Stack.
- The Filebeat agent can be configured from the filebeat.yml file located in the /etc/filebeat/ directory on Linux installations or in the config/ directory on tar archives. Edit the file as shown in the reference file, Chapter6/filebeat/filebeat.yml.
Filebeat uses modules to organize configuration for different inputs. We will be using the out-of-the-box module for nginx in this case, which can be loaded from the modules.d/ directory in /etc/filebeat (also referred to as path.config by Filebeat):
filebeat.config.modules:
# Glob pattern for configuration loading
path: ${path.config}/modules.d/*.yml
A list of available Filebeat modules can be found at https://www.elastic.co/guide/en/beats/filebeat/8.0/filebeat-modules-overview.html.
Next, the output configuration for Filebeat is set to send events to an Elasticsearch deployment. Configure the hosts, username, and password settings as they apply to your environment:
output.elasticsearch:
# Array of hosts to connect to.
hosts: ["localhost:9200"]
# Protocol - either `http` (default) or `https`.
#protocol: "https"
username: "elastic"
password: "changeme"
If TLS is required between Filebeat and Elasticsearch, the protocol can be set to https in the output.elasticsearch configuration block. If the destination Elasticsearch cluster does not use a TLS certificate issued by a trusted root certificate authority, further SSL settings need to be included to define certificate parameters.
SSL settings for Filebeat can be found in the reference guide: https://www.elastic.co/guide/en/beats/filebeat/8.0/configuration-ssl.html.
Given Beats agents are often distributed across large and complex environments, it can be useful to enrich events from agents to contain some metadata about the host, Docker container, Kubernetes cluster, or cloud provider the agent may run on. The following Filebeat processors adds such metadata to the events collected by the agent:
processors:
- add_host_metadata: ~
- add_cloud_metadata: ~
Enable the nginx module and configure the log files to be collected.
Run the following command to enable the Nginx module:
filebeat modules enable nginx
Confirm the following file is present:
ls -lah /etc/filebeat/modules.d/nginx.yml
As per our configuration, all module files that end with .yml will be loaded. Module files by default are suffixed with the text .disabled. The previous command simply renames the file to activate the module.
- Load the necessary nginx module artifacts into Elasticsearch and Kibana to ingest and visualize the data. This step needs to be done once per Elasticsearch deployment (or whenever a new module is activated). Run the following command to run the setup process (replacing localhost with your Kibana endpoint):
filebeat setup -E "setup.kibana.host=localhost:5601" --modules nginx --dashboards --pipelines
Filebeat will use configuration options in the filebeat.yml file, as well as the active modules to load the following artifacts:
- An index template containing mappings and settings for Filebeat indices.
- An index life cycle policy for the Filebeat index to make it easy to manage data life cycle and retention requirements.
- Create a bootstrap index for the Filebeat index pattern.
- For modules, Elasticsearch ingest pipelines are loaded to parse logs into the Elastic Common Schema.
- For modules, Filebeat will load dashboards, machine learning jobs, and alert configurations (if available for the module) into Kibana.
You should see the following output on the successful setup of artifacts:
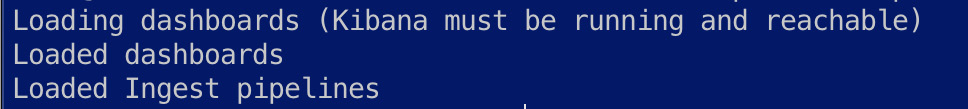
Figure 6.4 – Filebeat artifacts set up successfully
- Start the Filebeat systemd service (or run the filebeat executable if using a tar archive) to start collecting logs:
systemctl start filebeat
- Confirm the logs are visible on the Discover app in Kibana. You can visit the web page on your web server to generate traffic and corresponding log events to validate your ingestion pipeline.
You can search and explore the log data using Discover on Kibana:

Figure 6.5 – Nginx logs visible on Kibana
In addition to exploring data using Discover, the Logs app on Kibana can also stream log messages as they come in, to highlight keywords or log types of interest.
We will look at more complex examples of using Filebeat to collect module-based and custom application logs in Chapter 11, Observing Applications and Infrastructure Using the Elastic Stack.
Using Metricbeat to monitor system and application metrics
Logs make up one aspect of data collection and visibility of a workload you need to monitor. Metrics are a great way to monitor and observe a workload as they represent the internal state of the component at any given point in time.
By correlating logs and metrics, an engineer or developer can quickly understand what a component is doing and how the internal state of the component is changing based on its activities in a given scenario. This is often a useful tool when troubleshooting and resolving issues related to the component in question.
In this section, we will look at collecting some metrics from the nginx web server as well as the host that the server runs on.
Follow the instructions to start collecting system and application metrics using Metricbeat:
- Ensure nginx is configured to expose an internal API to collect server metrics.
- Edit the /etc/nginx/sites-enabled/default file and add the following code block to the file (as shown in the reference file, nginx-configuration.conf) if not already configured:
server {
server_name 127.0.0.1;
location /server-status {
stub_status;
allow 127.0.0.1;
deny all;
}
}
- Restart nginx to reload the configuration:
systemctl restart nginx
- Install the Metricbeat agent on the host running the workload to be monitored. As in the case of Filebeat, instructions on installing the different Beats agents are available in Chapter 2, Installing and Running the Elastic Stack.
Metricbeat uses the concept of modules (as Filebeat does) to control the different metric collection sources on a host.
Configure the metricbeat.yml file in /etc/metricbeat for the following requirements. The entire reference configuration is available in metricbeat/metricbeat.yml in the code repository.
Set up Metricbeat to load configuration modules from the /etc/metricbeat/modules.d/ directory:
metricbeat.config.modules:
# Glob pattern for configuration loading
path: ${path.config}/modules.d/*.yml
Configure the host, user, and password parameters to send events to your Elasticsearch cluster:
output.elasticsearch:
# Array of hosts to connect to.
hosts: ["localhost:9200"]
# Protocol - either `http` (default) or `https`.
#protocol: "https"
username: "elastic"
password: "xdZLpBjHu4bFgmEnoh56t7mC"
- Enrich events with host and cloud platform metadata to identify and differentiate the source of metrics:
processors:
- add_host_metadata: ~
- add_cloud_metadata: ~
Next, enable the nginx module to collect metrics from the web server by executing the following command:
metricbeat modules enable nginx
Edit the /etc/metricbeat/modules.d/nginx.yml file to include the following parameters:
- module: nginx
metricsets:
- stubstatus
period: 10s
# Nginx metrics API
hosts: ["http://127.0.0.1"]
The metrics from the OS will complement the visibility of nginx during analysis. The metrics we collect include the following:
- CPU usage and utilization
- System memory usage
- Network I/O
- Running process metrics
- Filesystem usage (per disk mount)
Enable the system module to collect metrics from the host operating system.
metricbeat modules enable system
- Edit the /etc/metricbeat/modules.d/system.yml file to include the required metric sets as shown in metricbeat/modules.d/system.yml in the code repository. Your configuration file should look as follows:
- module: system
period: 10s
metricsets:
- cpu
- load
- memory
- network
...
- module: system
period: 1m
metricsets:
- filesystem
- fsstat
- module: system
period: 15m
metricsets:
- uptime
- Run the Metricbeat setup command to load the necessary artifacts, such as index templates and dashboards, into your Elasticsearch deployment:
metricbeat setup -E "setup.kibana.host=localhost:5601"
You should see the following output when content is successfully loaded:
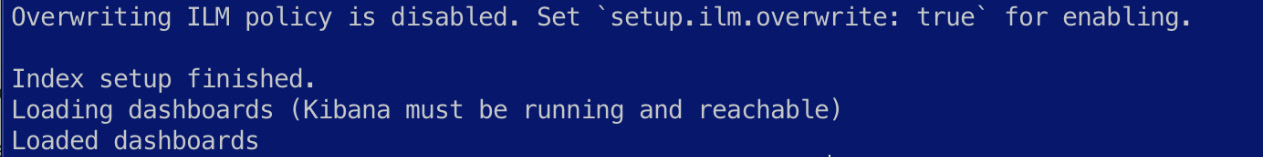
Figure 6.6 – Metricbeat artifacts set up successfully
Start the Metricbeat systemd service to start collecting metrics:
systemctl start metricbeat
Events from Metricbeat should now be collected and sent into Elasticsearch for indexing. Data can be explored on Kibana on the Discover app; change the data view used on the left side of the screen if necessary to view Metricbeat data:

Figure 6.7 – Metric events visible on Kibana
The Metrics app in Kibana can also be used to visualize infrastructure and system metrics from across your environment, as shown here:

Figure 6.8 – Infrastructure view on the Kibana Metrics app
Dashboards specific to the Metricbeat modules in use should also be available in the Dashboard app in Kibana.
The [Metricbeat Nginx] Overview dashboard shows useful metrics regarding the number of active connections, requests, and handle/drop rates:
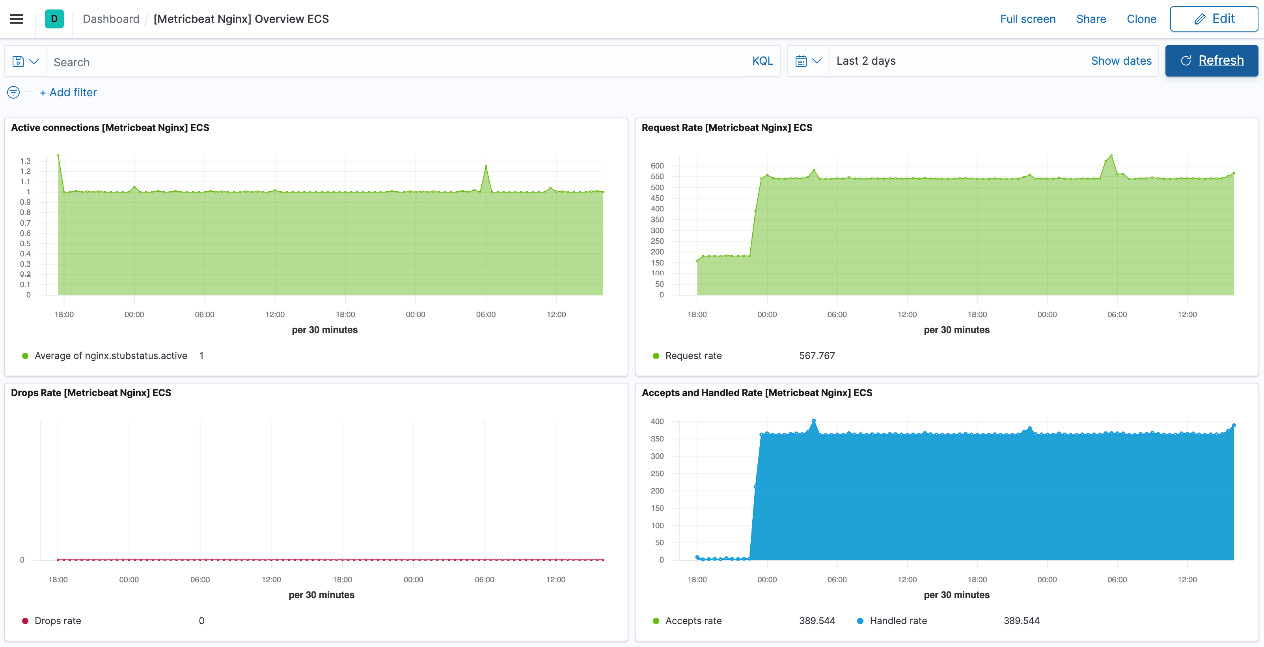
Figure 6.9 – Nginx metrics overview dashboard on Kibana
The [Metricbeat System] Overview dashboard provides useful insight into the state of the machine running the web server, including information such as CPU/memory usage, disk usage, the number of running processes, and system load:
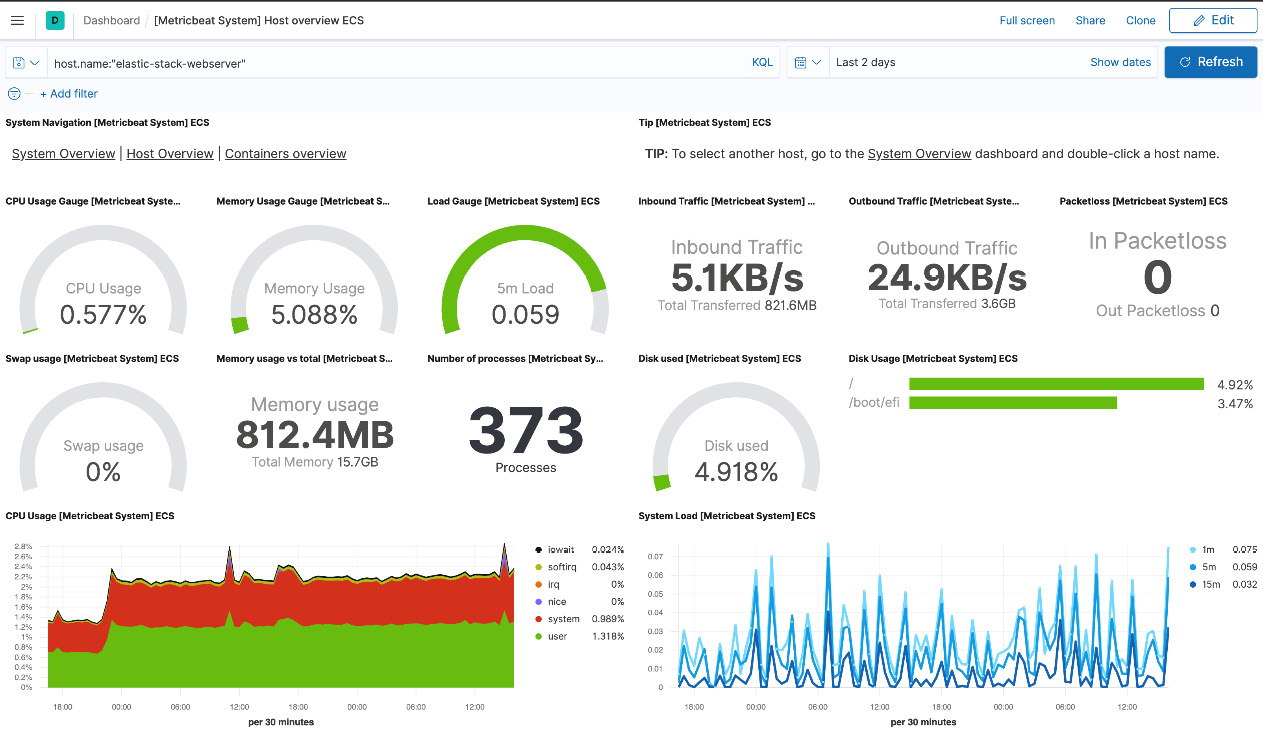
Figure 6.10 – System metrics overview dashboard on Kibana
Feel free to explore the data on these and the linked dashboards. We will look at more in-depth aspects of Kibana as a visualization tool in Chapter 8, Interacting with Your Data on Kibana.
Now that we're collecting logs and metrics from our workload, the next section will look at collecting useful security and audit information from the host to track changes in the host OS configuration and security posture using Auditbeat.
Monitoring operating system audit data using Auditbeat
While it is useful to monitor logs and metrics directly related to your workload, an important element of comprehensive visibility is monitoring configuration changes on the machine hosting your workload. Audit data derived from the operating system can indicate changes that may result in bugs or undesired behavior, non-compliance with security policies, or users making unauthorized changes.
Auditbeat leverages the Linux audit framework (auditd) to consistently and reliably collect audit/security-relevant data from hosts. The scope of data collection includes the following:
- Linux kernel events related to unauthorized file access and remote access
- Changes on critical files and file paths
- Packages, processes, sockets, and user activity on the system
Data collection on auditd can be controlled using rules; curated rules can be found on openly available security hardening and best practice guides online.
Complete the following steps to start collecting audit data from the web server host:
- Install Auditbeat on the web server host (using the same installation methodology as previous Beats agents in this chapter).
- Configure Auditbeat to collect relevant information from the host.
Edit the auditbeat.yml file located in /etc/auditbeat as shown in the reference file in the code repository.
In the case of Filebeat and Metricbeat, we used configuration files to load modules. This example demonstrates how the same configuration parameters can be loaded using the auditbeat.yml file.
The following sample audit rules detect the use of 32-bit APIs on a 64-bit host OS, indicating a potential attack vector for compromise:
- module: auditd
audit_rules: |
-a always,exit -F arch=b32 -S all -F key=32bit-abi
-a always,exit -F arch=b64 -S execve,execveat -k exec
-a always,exit -F arch=b64 -S accept,bind,connect -F key=external-access
The following rules will watch for any changes to user and group identities on the host:
-w /etc/group -p wa -k identity
-w /etc/passwd -p wa -k identity
-w /etc/gshadow -p wa -k identity
The file integrity module can watch for changes to files in the following critical directories on the host and can indicate when binaries and config files are changed:
- module: file_integrity
paths:
- /bin
- /usr/bin
- /sbin
- /usr/sbin
- /etc
The system module collects information regarding successful/failed logs, processes, socket events, and user/host information:
- module: system
datasets:
- host # General host information, e.g. uptime, IPs
- login # User logins, logouts, and system boots.
- process # Started and stopped processes
- socket # Opened and closed sockets
- user # User information
state.period: 12h
Auditbeat is configured to send events collected to the appropriate Elasticsearch cluster for indexing:
output.elasticsearch:
# Array of hosts to connect to.
hosts: ["localhost:9200"]
# Protocol - either `http` (default) or `https`.
#protocol: "https"
username: "elastic"
password: "changeme"
Audit data is also enriched with metadata about the host and the cloud platform it runs on for context:
processors:
- add_host_metadata: ~
- add_cloud_metadata: ~
Set up Auditbeat artifacts on Elasticsearch and Kibana by running the setup command:
auditbeat setup -E "setup.kibana.host=localhost:5601"
You should see output as follows if the setup runs successfully:
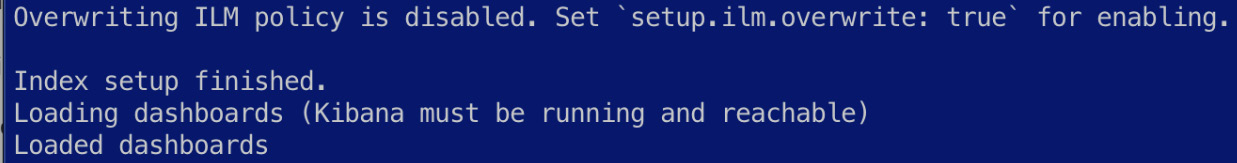
Figure 6.11 – Auditbeat artifacts set up successfully
- Start the Auditbeat service to initiate the collection of audit events:
systemctl start auditbeat
After a few moments, audit data should be available on Kibana for you to explore and visualize. Confirm events are visible on the Discover app on Kibana. Out-of-the-box dashboards can also be used to visualize the information collected.
The [Auditbeat System] Login dashboard, for example, displays all attempted login events on the host:
![Figure 6.12 – [Auditbeat System] Login dashboard on Kibana](https://imgdetail.ebookreading.net/2023/10/9781800569492/9781800569492__9781800569492__files__image__Figure_6.12.jpg)
Figure 6.12 – [Auditbeat System] Login dashboard on Kibana
The Security application on Kibana can also be used to visualize some of the data collected with Auditbeat. The Hosts tab, for example, gives users a quick overview of the different types of hosts, authentication events, uncommon processes, and so on in the environment. Chapter 12, Security Threat Detection and Response Using the Elastic Stack, explores some of this functionality in greater detail.
Next, we'll look at monitoring the uptime and availability of the web server using Heartbeat.
Monitoring the uptime and availability of services using Heartbeat
An important part of running a web application is ensuring it is available and accessible to users. Various activities can result in an outage or degraded service levels for end users. While logs and metrics provide in-depth information about the workload, monitoring the service from the user's perspective is useful to ensure service standards.
Heartbeat can be set up to continuously monitor assets to ensure they are reachable and configured properly. We will leverage Heartbeat to monitor the Recipe Search Service web page, as well as the Elasticsearch cluster we're using to monitor the web server host.
Follow the instructions to set up and configure the Heartbeat agent:
- Install Heartbeat using the installation options we've already discussed.
- Set up the Heartbeat agent to load the monitor configuration.
Heartbeat uses the concept of monitors to perform uptime checks on a given asset.
Configure heartbeat.yml in /etc/heartbeat/ as shown in the reference file in the code repository.
Set up Heartbeat to load monitors from the /etc/heartbeat/monitors.d/ directory:
heartbeat.config.monitors:
# Directory + glob pattern to search for configuration files
path: ${path.config}/monitors.d/*.yml
# If enabled, heartbeat will periodically check the config.monitors path for changes
reload.enabled: false
# How often to check for changes
reload.period: 5s
Configure the Elasticsearch cluster for the events to be sent to:
output.elasticsearch:
# Array of hosts to connect to.
hosts: ["localhost:9200"]
#protocol: "https"
username: "elastic"
password: "changeme"
As assets on the internet can be accessed from any number of geographical locations, it is useful to track availability, latency, and performance from multiple locations on the internet. This is especially important when using services such as content delivery networks (CDNs), which cache content around the globe depending on the location of users. Enrich Heartbeat events with data about the geolocation of the Heartbeat agent, the host, and the cloud platform it is running on for context:
processors:
- add_observer_metadata:
geo:
# Token describing this location
name: on-premise-datacentre
# Lat, Lon "
location: "33.8688, 151.2093"
- add_host_metadata: ~
- add_cloud_metadata: ~
Configure webserver-http.yml in /etc/heartbeat/monitors.d to check the Recipe Search Service web server (as shown in the reference file). Replace localhost with the IP address or DNS name of your web server:
- type: http
id: webserver-1-http
name: Webserver 1
schedule: '@every 5s'
# Configure URLs to ping
hosts: ["http://localhost"]
Configure elasticsearch-http.yml in /etc/heartbeat/monitors.d to monitor the health and availability of the Elasticsearch cluster in use. Remember to replace localhost with the URL to the Elasticsearch cluster:
- type: http
id: elasticsearch-http
name: Dev Elasticsearch deployment
schedule: '@every 5s'
# Configure URLs to ping
hosts: ["http://localhost:9200/_cluster/health"]
# Authentication Credentials
username: 'elastic'
password: 'changeme'
Heartbeat will use an HTTP GET request by default; this can be customized as needed:
# Configure HTTP method to use. Only 'HEAD', 'GET' and 'POST' methods are allowed.
method: "GET"
Configure Heartbeat to check the HTTP response from Elasticsearch to evaluate the cluster's health. Heartbeat will report the monitor as healthy if an HTTP 200 request is received, and the status field in the JSON response has the value green:
# Expected response settings
check.response:
# Expected status code. If not configured or set to 0 any status code not
# being 404 is accepted.
status: 200
# Parses the body as JSON, then checks against the given condition expression
json:
- description: Checks if cluster health status is green
condition:
equals:
status: green
- Run the setup command to load necessary artifacts (such as index templates and index patterns) into the Elasticsearch deployment:
heartbeat setup -E "setup.kibana.host=localhost:5601"
- Enable the heartbeat-elastic systemd service to start monitoring the workloads:
systemctl start heartbeat-elastic
Momentarily, Heartbeat data should be available to explore on Kibana Discover.
The Uptime app on Kibana can be used to visualize this data and set up alerts or explore details when assets are unavailable:
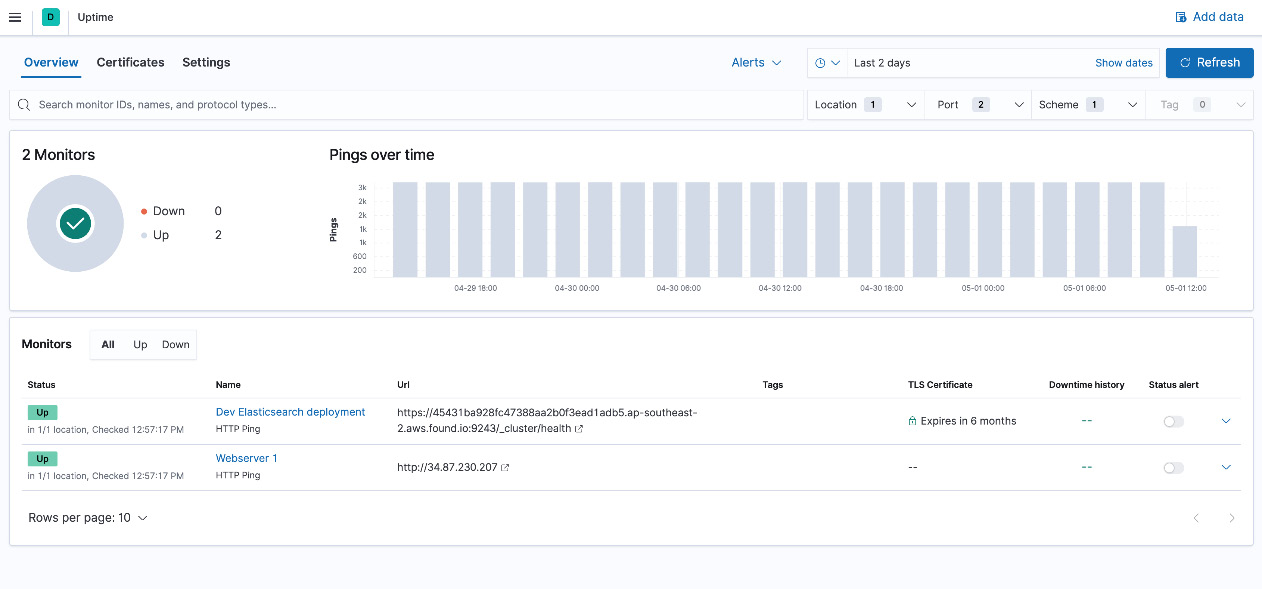
Figure 6.13 – Uptime app on Kibana showing the availability of the workloads
Next, we'll look at using Packetbeat to collect and decode network traffic on the web server host.
Collecting network traffic data using Packetbeat
We've looked at how you can observe a workload, the host, and the configuration it runs on and the availability of the workload to end users. One final aspect that we're going to look at to establish comprehensive monitoring is collecting, decoding, and analyzing host network data using Packetbeat.
Networking is a critical part of most workloads; this is especially true in the case of our Recipe Search Service web server. Network packets contain information on the following:
- The source and type of network traffic being served.
- Details of protocols (and versions) being used and their distribution as a whole.
- Data about network latency, request and response sizes, and some metadata about the content of the traffic. For example, SSL traffic can indicate the TLS version in use, metadata about the certificate authorities and expiry dates, and so on.
Packet data is also quite useful in detecting security threats/exploit attempts, forensic investigations, and troubleshooting performance and connectivity issues in the infrastructure.
Follow the instructions to set up Packetbeat to start collecting network data from the web server host:
- Install the Packetbeat agent on the host.
- Configure the agent to collect network data and ship it to our Elasticsearch deployment.
Configure packetbeat.yml in /etc/packetbeat.
Set up the network interfaces for Packetbeat to monitor. You can use a label (such as eth0) to specify an interface or use the any parameter to monitor all available interfaces:
packetbeat.interfaces.device: any
Configure the collection of network flow information:
packetbeat.flows:
# Set network flow timeout. Flow is killed if no packet is received before being
# timed out.
timeout: 30s
# Configure reporting period. If set to -1, only killed flows will be reported
period: 10s
Configure the protocols and ports that Packetbeat should collect and decode from the data being sniffed. In this example, we want to collect ICMP, DHCP, DNS, and HTTP communications from the server. A list of supported protocols can be found at https://www.elastic.co/guide/en/beats/packetbeat/8.0/configuration-protocols.html:
packetbeat.protocols:
- type: icmp
enabled: true
- type: dhcpv4
ports: [67, 68]
- type: dns
ports: [53]
- type: http
ports: [80]
Send the data to the Elasticsearch cluster for indexing:
output.elasticsearch:
# Array of hosts to connect to.
hosts: ["localhost:9200"]
# Protocol - either `http` (default) or `https`.
#protocol: "https"
username: "elastic"
password: "changeme"
Enrich the packet data with host and cloud platform data for context. HTTP events are enriched with the HTTP content MIME type based on information in the request or response body:
processors:
- add_cloud_metadata: ~
- detect_mime_type:
field: http.request.body.content
target: http.request.mime_type
- detect_mime_type:
field: http.response.body.content
target: http.response.mime_type
Set up the required Packetbeat artifacts on Elasticsearch and Kibana:
packetbeat setup -E "setup.kibana.host=localhost:5601"
- Start collecting data by starting the Packetbeat systemctl service:
systemctl start packetbeat
Data should be available on Discover to explore and visualize as expected. Out-of-the-box dashboards can be explored to visualize network activity and usage.
The [Packetbeat] Overview dashboard provides a high-level breakdown of network flows for different protocols:
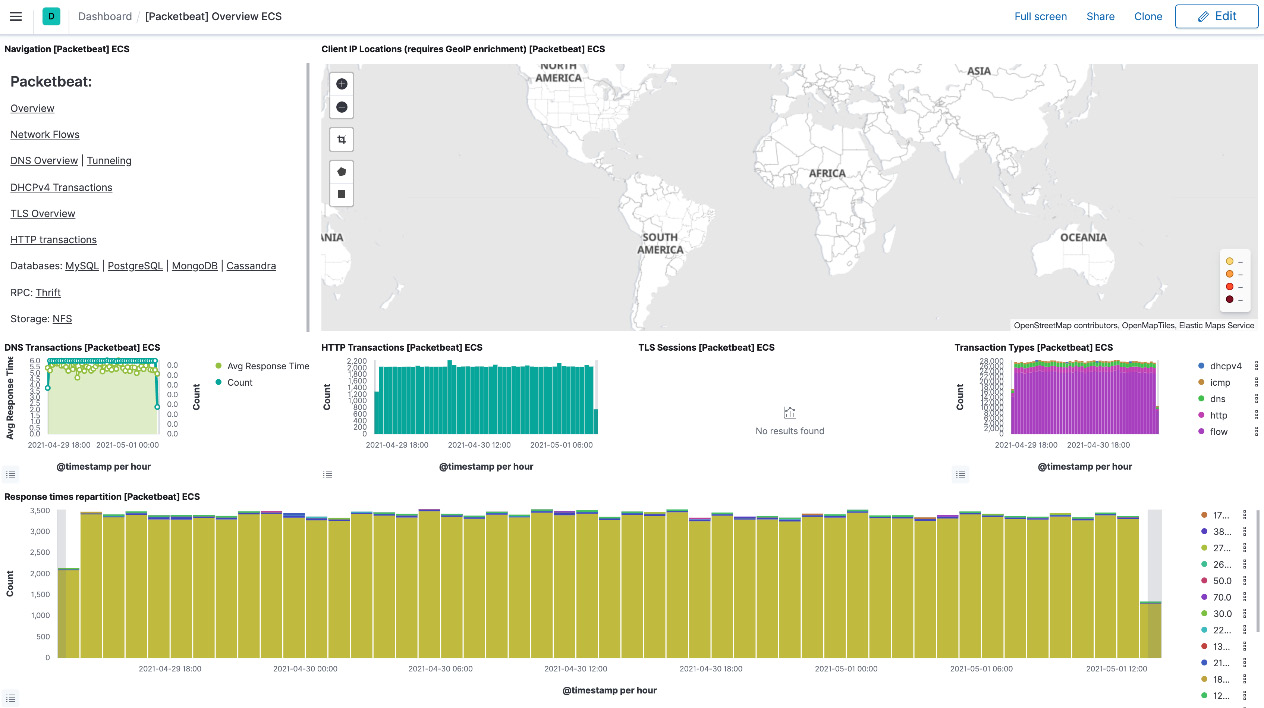
Figure 6.14 – Packetbeat overview dashboard on Kibana
The Network tab in the Security app can also visualize Packetbeat network flows in the context of security analytics.
We have looked at establishing effective monitoring and visibility on our web server host in the following ways:
- Collecting server logs
- Application and host metrics
- System audit information
- Uptime and availability of the workloads
- And finally, network traffic and usage information on the host
Summary
In this chapter, we looked at using different Beats to collect data for shipping into Elasticsearch or Logstash.
We started off by looking at the internals of a Beats agent, the different Beats agents on offer, and what role they play depending on the location and type of your data. Next, we focused on a range of practical scenarios to highlight the role each Beat can play in helping you collect the data you need in Elasticsearch. Finally, we looked at how you can use out-of-the-box Beats content in your monitoring and analysis use cases.
In the next chapter, we will shift our attention to Logstash as a tool to extract, transform, and load information (from sources including Beats) into Elasticsearch.