Chapter 7: Using Logstash to Extract, Transform, and Load Data
In previous chapters, one of our areas of focus was looking at how data can be indexed and searched on Elasticsearch. We looked at index mappings and the importance of defining correct mappings in downstream use cases such as computing aggregations, running alerting, and using machine learning features.
In this chapter, we look at how ETL tools such as Logstash can be used to extract data from a range of source systems (such as Syslog streams, CSV files, message-streaming platforms, or Beats agents), and transform events to their desired format before loading them into Elasticsearch. Upon completion of this chapter, you will be able to use Logstash to process and ingest a variety of data sources into Elasticsearch.
In this chapter, we will specifically focus on the following:
- Understanding the internals of Logstash and the anatomy of a Logstash pipeline
- Exploring common input, filter, and output plugins
- Creating pipelines for real-world data-processing scenarios
Technical requirements
To follow along with the sample Logstash configurations for real-world data-processing use cases, you will need access to a virtual machine with Logstash installed or the ability to run Logstash on your host machine, as shown in Chapter 2, Installing and Running the Elastic Stack.
The code for this chapter can be found on the GitHub repository for the book: https://github.com/PacktPublishing/Getting-Started-with-Elastic-Stack-8.0/tree/main/Chapter7.
Introduction to Logstash
In Chapter 6, Collecting and Shipping Data with Beats, we explored how a key characteristic of modern IT environments is the concept of valuable data being generated in multiple parts of the technology stack. While Beats go a long way in collecting this data to send to Elasticsearch, a key challenge is transforming data to make it useful for search and analysis.
Logstash is a flexible Extract, Transform, Load (ETL) tool designed to solve this problem. While Logstash has no real dependency on Elasticsearch and Beats and can be used for any generic ETL use case, it plays a key role as part of the Elastic Stack.
Logstash is generally used in two main ways as part of the Elastic Stack:
Logstash can act as the receiver for data from sources such as Beats agents or Syslog streams. It can also listen for data over HTTP for any compatible source system to send events through.
Logstash can extract data from source systems such as Kafka (or other event streams), tail log files on the Logstash host, poll an HTTP API to retrieve data, or read files on object stores such as Amazon S3 or Google Cloud Storage (GCS).
Once data is input, Logstash can perform operations such as parsing out important fields, transforming nonstandard data formats/codecs into JSON, enriching events with contextual information, sanitizing field values, and dropping unnecessary event types. Both approaches heavily leverage the versatility and flexibility Logstash provides in dealing with a multitude of different source systems. The two models are not mutually exclusive and can be used in a hybrid fashion if required.
Understanding how Logstash works
Logstash is designed to run as a standalone component to load data into Elasticsearch (among other destination systems). Logstash is a plugin-based component, meaning it is highly extensible in what sorts of source/destination systems it supports and transformations it can do.
It is worth understanding the following concepts in relation to Logstash:
- A Logstash instance is a running Logstash process. It is recommended to run Logstash on a separate host to Elasticsearch to ensure sufficient compute resources are available to the two components.
- A pipeline is a collection of plugins configured to process a given workload. A Logstash instance can run multiple pipelines (independent of each other).
- An input plugin is used to extract or receive data from a given source system. A list of supported input plugins is available on the Logstash reference guide: https://www.elastic.co/guide/en/logstash/current/input-plugins.html.
- A filter plugin is used to apply transformations and enrichments to the incoming events. A list of supported filter plugins is available on the Logstash reference guide: https://www.elastic.co/guide/en/logstash/current/filter-plugins.html
- An output plugin is used to load or send data to a given destination system. A list of supported output plugins is available on the Logstash reference guide: https://www.elastic.co/guide/en/logstash/current/output-plugins.html.
Logstash works by running one or more Logstash pipelines as part of a Logstash instance to process ETL workloads.
Logstash is not a clustered component and cannot be made aware of other Logstash instances. Multiple Logstash instances can be used for high availability and scaling requirements by load-balancing data across instances.
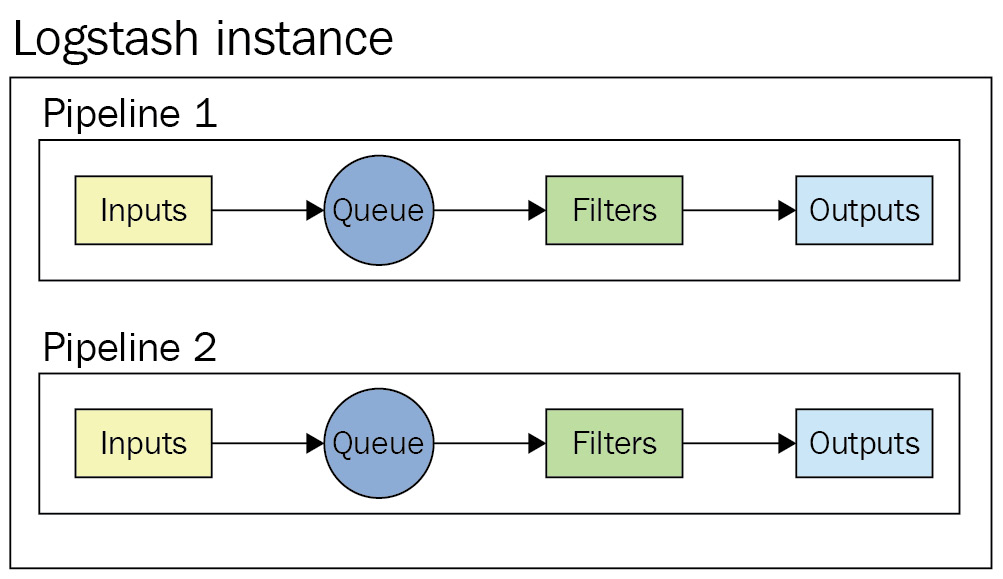
Figure 7.1 – An overview of pipelines in a Logstash instance
Logstash has the ability to use an in-memory or a disk-based (persistent) queue within pipelines. The use of persistent queuing allows for short-term buffering of events from inputs before being processed, lending to the resiliency of ingestion pipelines at a slight performance cost.
Configuring your Logstash instance
Settings and configuration options for Logstash are defined in the logstash.yml configuration file.
A full list of supported settings can be found in the reference guide: https://www.elastic.co/guide/en/logstash/8.0/logstash-settings-file.html
The following settings are worth noting when setting up your Logstash instance:
- pipeline.batch.size defines the maximum number of events the filter and output plugins will accept each time they run. The batch size can be tweaked based on the size and complexity of the events and transformations required to maximize the utilization of resources on the Logstash host. By default, this is set to 125 events per batch per worker thread used by the pipeline.
- pipeline.batch.delay determines how long Logstash will wait to collect a full batch of events before dispatching them for processing. If there are not enough events in the queue, a smaller batch will be dispatched once the delay time period is passed. By default, this is set to 50ms.
- queue.type determines the type of queue used by Logstash. By default, memory-based queues are used. This can be set to persisted to use disk-based queuing. Note that disk-based queuing requires sufficient disk space to be available on the data path used by Logstash. Additional queue-related settings can be tweaked to control the size and related attributes of the queue.
Next, we will look at running your first Logstash pipeline.
Running your first pipeline
It is easy to get up and running with Logstash. In this section, we will look at a simple Logstash pipeline to take simple string input and output the text as part of a JSON event.
Important Note
If Logstash is installed using a package manager, the examples in this chapter need to be run as the root user when run interactively. The logstash user is used when run as a systemd service.
Follow these steps to run your first Logstash pipeline:
- Create a new logstash-pipeline.conf file using your preferred code editor. The pipeline is configured to accept input over the standard input interface. Each input will be stored in the message field of the event:
input {
stdin {}
}
The filter block of the pipeline is where event processing happens. This can include parsing, transformations, enrichment, and sanitization tasks. In this pipeline, a field called description is added to the event with the "First pipeline!" value. Logstash will add this field to every event coming through the input:
filter {
mutate {
add_field => { "description" => "First pipeline!" }
}
}
Finally, the pipeline is configured to send the event to the standard output interface, so the events are visible to the terminal running Logstash:
output {
stdout {}
}
- Run Logstash from the command line:
echo -e 'Hello world!' | /usr/share/logstash/bin/logstash -f logstash-pipeline.conf
You should see the following output from Logstash. As expected, the message field contains the text input via standard input, while the description field contains the static text added in the filter block. Logstash also adds some additional fields, such as @timestamp, @version, and host, to indicate the event-processing time, the version of the pipeline, and the host Logstash runs on respectively. Some of these additional fields can be removed if desired, as shown in later sections of this chapter:
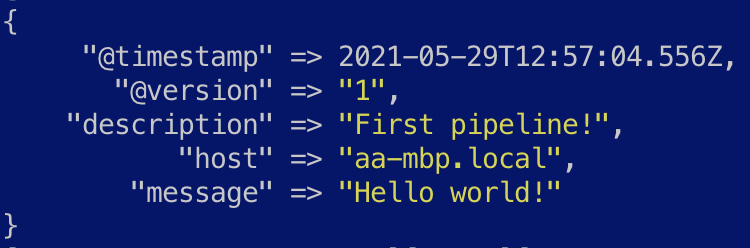
Figure 7.2 – The output from your first pipeline
- Now, try the pipeline with more than one event and observe the events created:
echo 'Hello world x1 Hello world x2' | /usr/share/logstash/bin/logstash -f logstash-pipeline.conf
The character indicates a new line in the input string, which is interpreted as a separate message by Logstash. You should see two events produced by Logstash, as shown in the following screenshot:
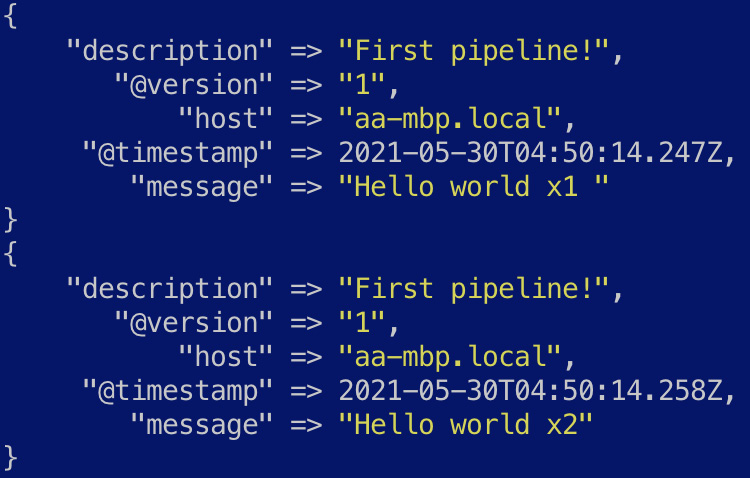
Figure 7.3 – The output from the first pipeline with multiple events
Now that we understand the very basics of stashing your first event using Logstash, let's look at some more complex scenarios that you might encounter in the real world.
Looking at pipelines for real-world data-processing scenarios
This section will explore a number of real-world ETL scenarios and the corresponding Logstash pipelines that can be used to implement them.
The full datasets used and the pipeline configuration files can be found in the code repository for the book.
Loading data from CSV files into Elasticsearch
Comma-Separated Value (CSV) files are a commonly used file format and can be easily generated by a range of source systems and tools. We will explore how a dataset containing taxi trip details from the city of Chicago can be parsed and loaded into Elasticsearch for analysis.
Navigate to Chapter7/processing-csv-files in the code repository and explore the chicago-taxi-data.csv file. The first row contains header information, indicating what information each column contains. The following screenshot is an extract of some of the key fields in the file:
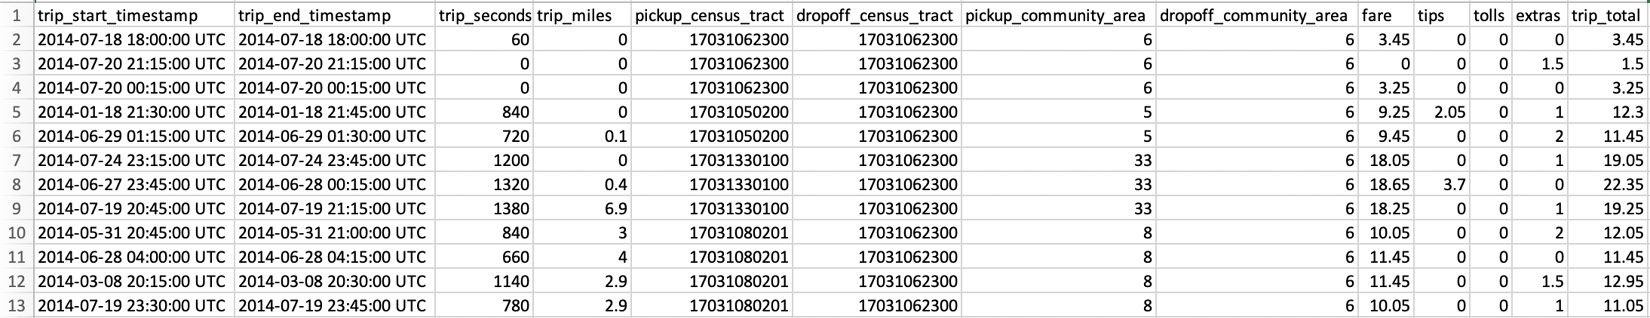
Figure 7.4 – An overview of the CSV file
Follow these instructions to process the CSV dataset:
- The Logstash pipeline for this task is defined in logstash-taxi.conf, defining the following key ETL tasks. Replace the text in <your_path_to> with the absolute path to the file in your host:
input {
file {
path => "/<your_path_to>/processing-csv-files/chicago-taxi-data.csv"
start_position => "beginning"
sincedb_clean_after => "1 s"
}
}
The pipeline accepts input from the file plugin, used to read the CSV file on disk. Replace the value of the path with the absolute path to the chicago-taxi-data.csv file on your host. The start_position parameter tells the file input plugin to read the file from the beginning when Logstash runs, while the sincedb_clean_after parameter tells Logstash to forget the current position of the file input after 1 second of inactivity.
Important Note
We use the sincedb parameter here to be able to replay the CSV file repeatedly for demonstration purposes. You would generally remove this parameter in a production setting where you do not want to replay the same data through Logstash.
More details and configuration options for the file input plugin for Logstash can be found in the reference guide: https://www.elastic.co/guide/en/logstash/8.0/plugins-inputs-file.html.
- Next, we look at how the data is transformed and processed in the filter block.
Before processing, a sample event looks as follows:
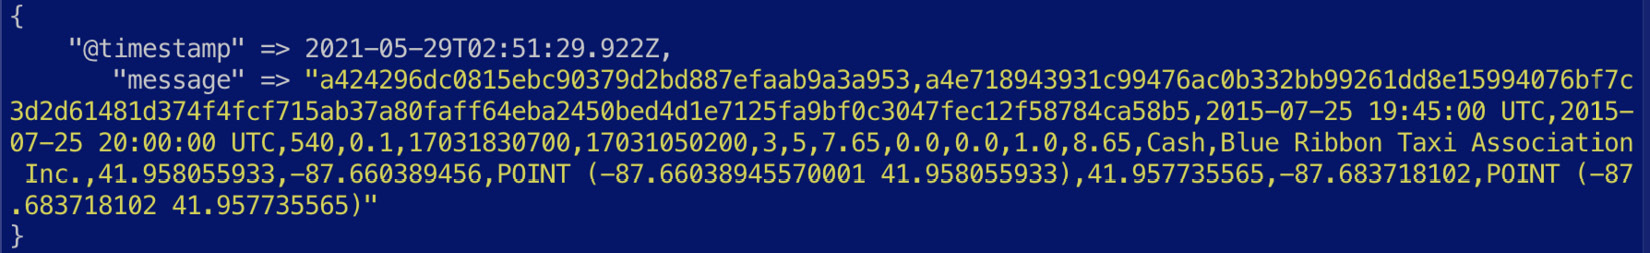
Figure 7.5 – A pre-processed CSV event
The CSV filter plugin is used to parse out the data into JSON. The skip_header parameter tells the plugin to skip the first line in the file, and the columns parameter defines the CSV column names in the order that they appear in the file. The resulting data from the plugin will be in JSON format:
csv {
skip_header => true
columns => ["unique_key","taxi_id","trip_start_timestamp","trip_end_timestamp","trip_seconds","trip_miles","pickup_census_tract","dropoff_census_tract","pickup_community_area","dropoff_community_area","fare","tips","tolls","extras","trip_total","payment_type","company","pickup_latitude","pickup_longitude","pickup_location","dropoff_latitude","dropoff_longitude","dropoff_location"]
}
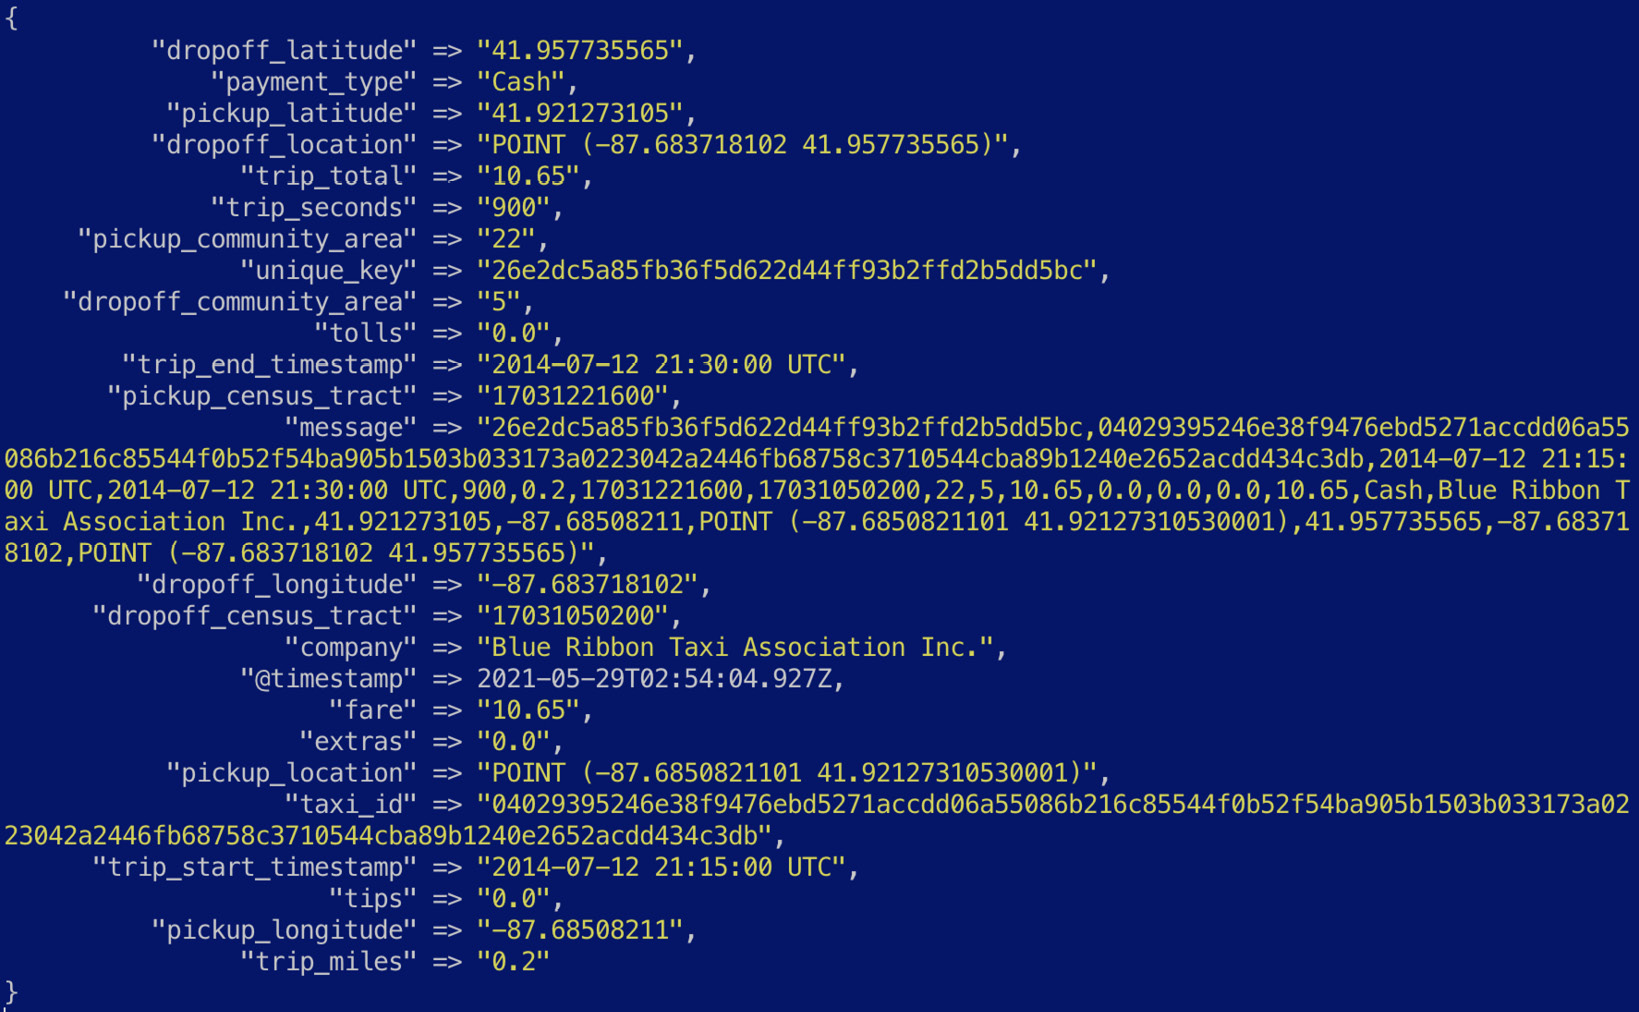
Figure 7.6 – A CSV event parsed into JSON
Now that the event is mostly in JSON, let's look at how some of the fields can be cleaned up for analysis in Elasticsearch.
- The pickup_location and drop_off location fields are not geo_point compliant fields. Elasticsearch accepts geo point values as a field containing the latitude and longitude values separated by a comma. The dissect filter is used to extract the numeric latitude/longitude values for the two fields in question:
dissect {
mapping => {
"pickup_location" => "POINT (%{pickup_location} %{+pickup_location})"
"dropoff_location" => "POINT (%{dropoff_location} %{+dropoff_location})"
}
}
The dissect filter supports field notation to control how values are extracted into the event. The + character is used to append to an existing field in the event. More information on the dissect filter can be found in the reference guide: https://www.elastic.co/guide/en/logstash/8.0/plugins-filters-dissect.html.
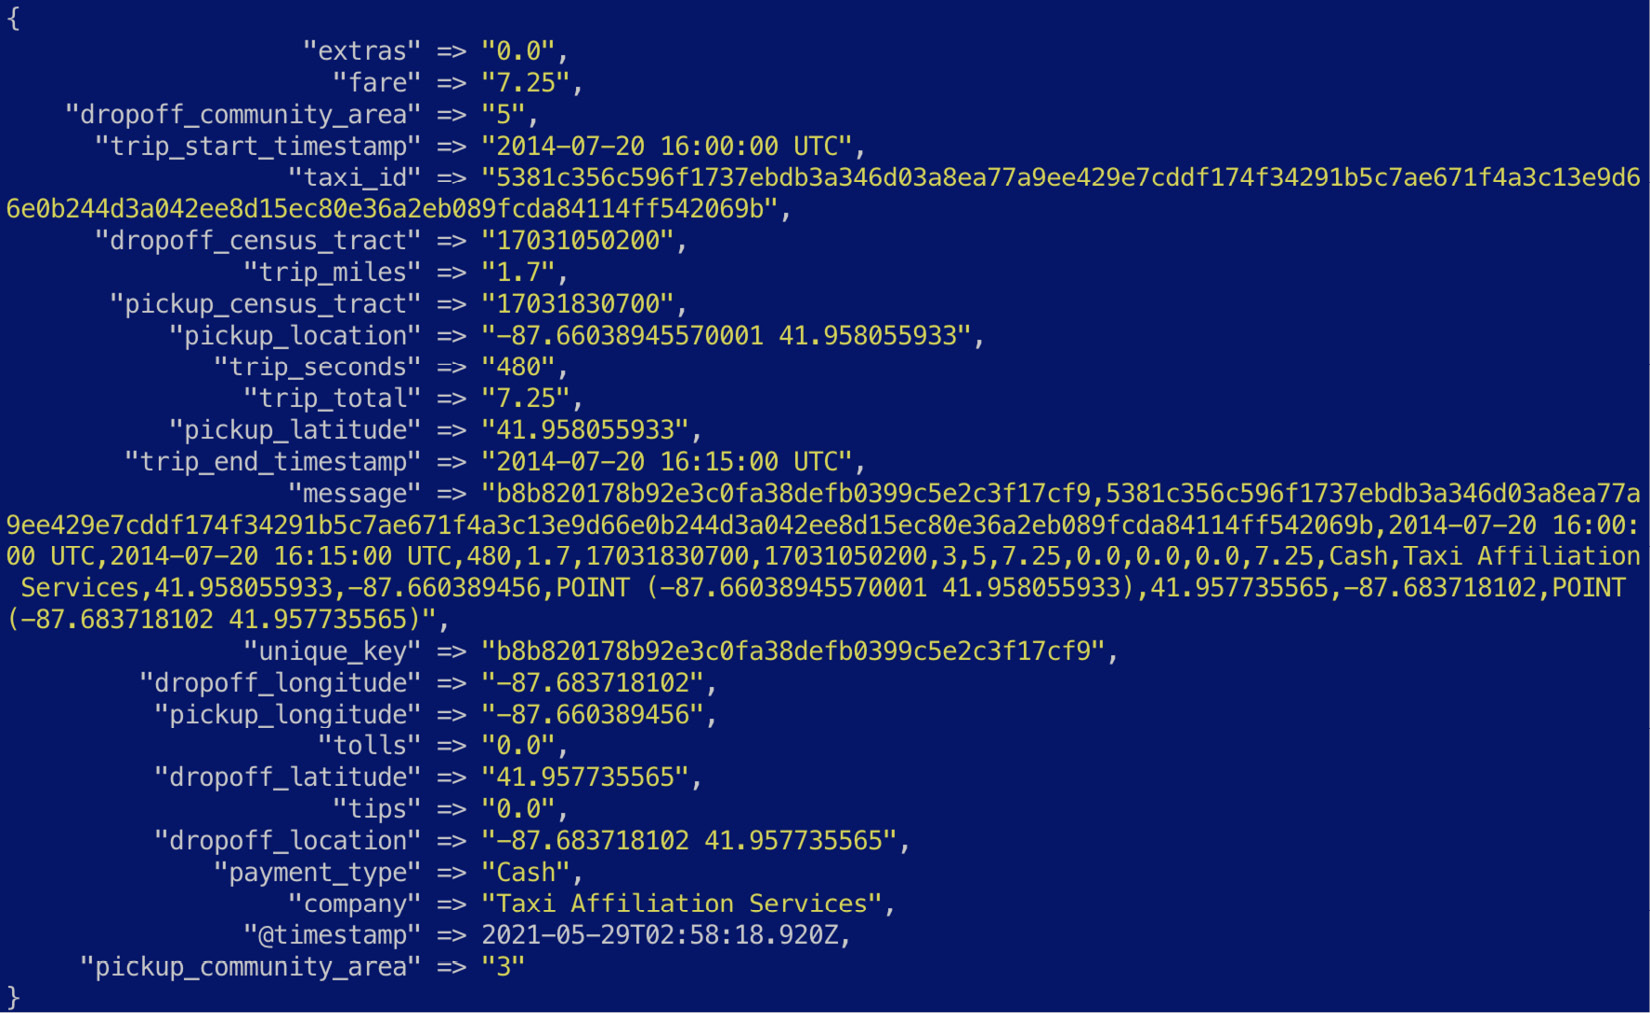
Figure 7.7 – Geo point values extracted
- The numeric values for pickup_location and dropoff_location are now extracted but are separated by a space instead of a comma. The mutate filter is used to further process the data. The gsub parameter is used to apply a Regular Expression (RegEx) substitution to replace the space with a comma in the two fields. Undesired fields are also removed from the event using the remove_field parameter:
mutate {
gsub => [
"pickup_location", " ", ",",
"dropoff_location", " ", ","
]
remove_field => ["host", "@version", "message", "path"]
}
- Next, we focus on transforming the two timestamp values to valid formats using the date filter plugin. The match parameter defines the field name and the timestamp format used, while the target parameter defines what the field should be called, once transformed:
date {
match => [ "trip_start_timestamp", "yyyy-MM-dd HH:mm:ss zzz"]
target => "trip_start_timestamp"
}
date {
match => [ "trip_end_timestamp", "yyyy-MM-dd HH:mm:ss zzz"]
target => "trip_end_timestamp"
}
The event should now look as follows:
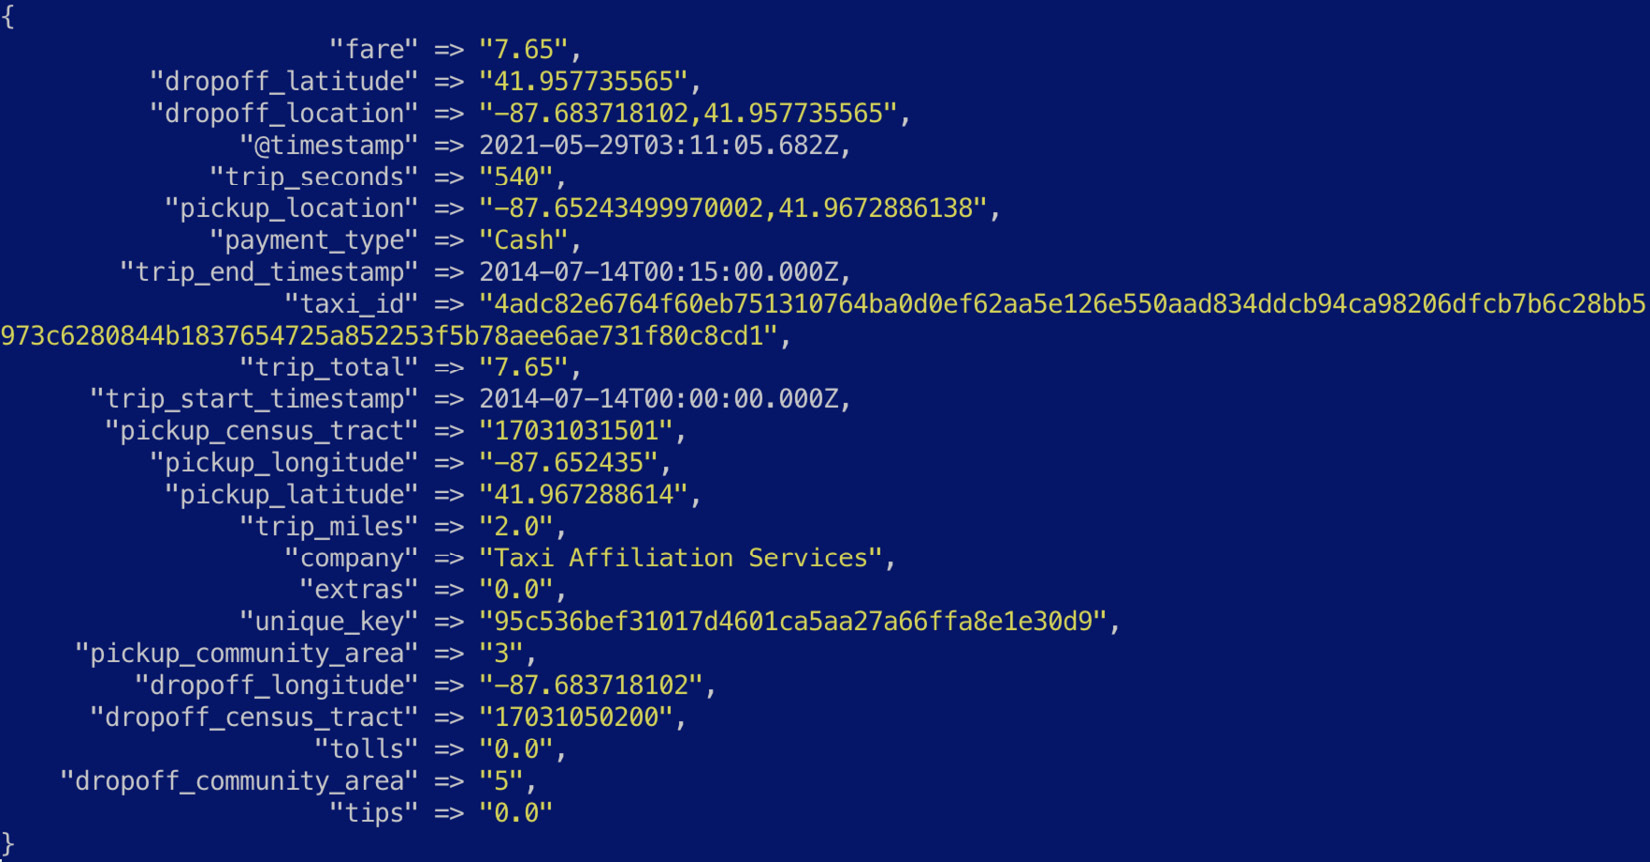
Figure 7.8 – Timestamp fields parsed into a valid format
- Now that we've successfully extracted and transformed our event, we can load the data into Elasticsearch using the following output configuration:
output {
stdout {}
elasticsearch {
hosts => "http://<your_es_cluster>"
user => "<your_es_username>"
password => "<your_password>"
}
}
- To see the pipeline running, navigate to the processing-csv-files directory on a terminal and execute the following command:
/usr/share/logstash/bin/logstash -f logstash-taxi.conf
Taxi events should be sent to both the terminal and your Elasticsearch cluster as configured in the output block.
Next, we will look at using Logstash to parse Syslog data.
Parsing Syslog data sources
Syslog is a standard for network-based logging, used in a wide range of Linux-based systems, applications, and appliances. Syslog messages follow a well-defined specification to structure logs. The following pipeline shows how a raw Syslog message can be passed into Logstash for parsing into JSON.
Navigate to Chapter7/parsing-syslog in the code repository and explore the linux-system.log file. The following screenshot shows the first few lines in the file:
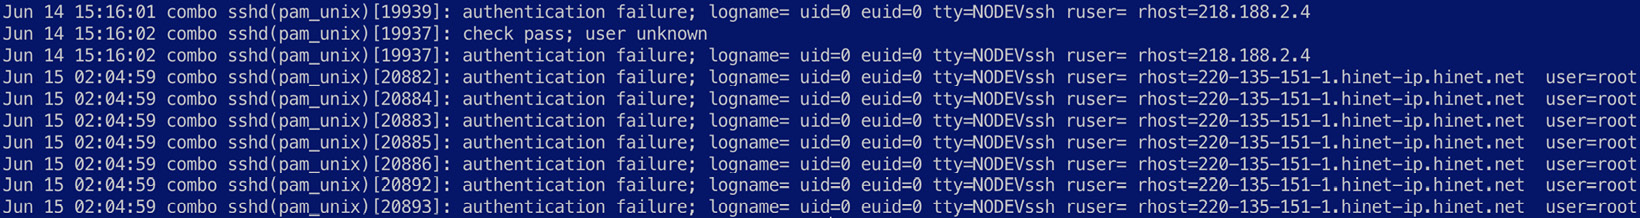
Figure 7.9 – An overview of raw Syslog messages
The following code blocks describe the pipeline definition for this scenario:
Important Note
Input for this scenario is obtained via the standard input interface (stdin). It is convenient to use stdin when testing different pipeline definitions during the development phase. Production setups should use a file or network-based input for resiliency.
- The filter block defines a grok processor to extract fields from arbitrary text values (the Syslog message in this case) and structure them. Grok patterns are used to define how data should be extracted. The patterns are built on top of RegEx, and you can add your own Grok patterns if required.
Further information on the Grok plugin is available in the reference guide: https://www.elastic.co/guide/en/logstash/8.0/plugins-filters-grok.html.
- The Grok plugin is used to extract the key Syslog fields from the message value, as shown in the following code:
grok {
match => { "message" => "%{SYSLOGTIMESTAMP:event.start} %{SYSLOGHOST:host.hostname} %{DATA:process.name}(?:[%{POSINT:process.pid}])?: %{GREEDYDATA:event.message}" }
}
The extracted events look as follows:
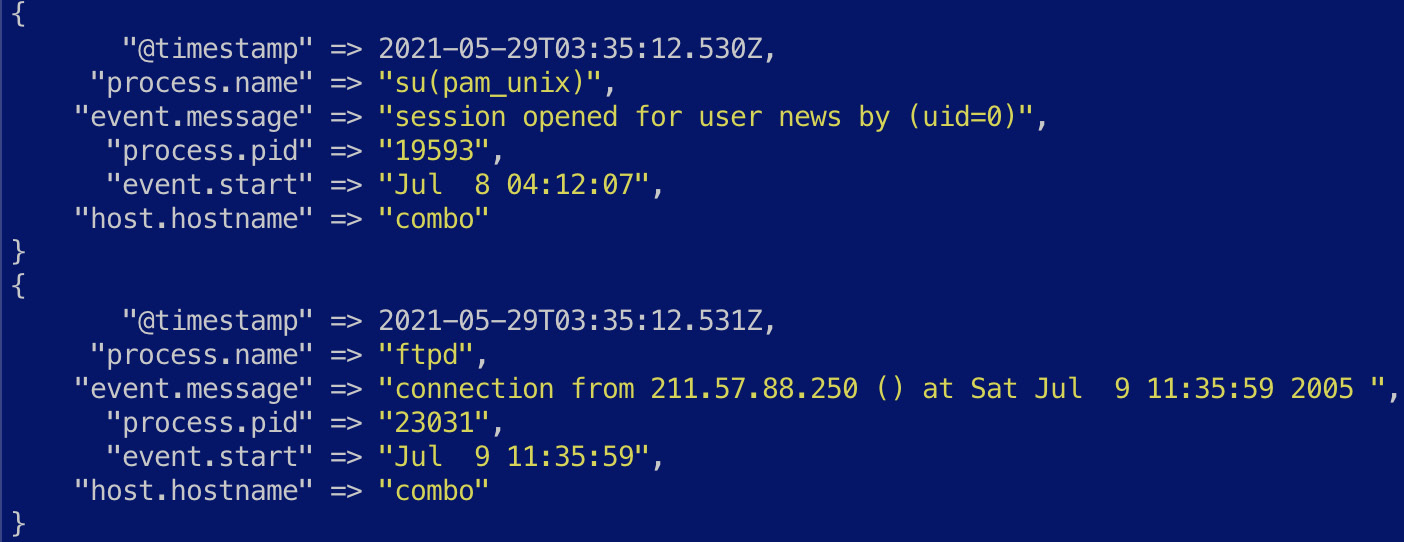
Figure 7.10 – Extracted base Syslog events
While we have successfully extracted fields such as event.start, process.name, and host.hostname, the event.message field still contains some useful data that should be extracted for downstream usage. Also note that the Syslog data contains logs from multiple processes, each with its own log format.
- We can use a conditional to deal with the different process names we want to extract fields for as shown. In the case of data generated by the sshd(pam_unix) process, the event.message field contains the following information:
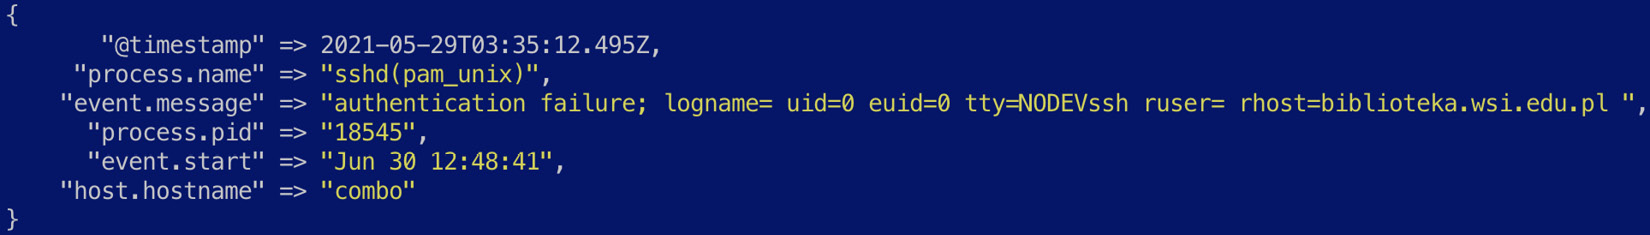
Figure 7.11 – An example of an sshd(pam_unix) event
- The following filter block dissects a value for event.outcome and runs the rest of the field through a kv filter (key-value) to extract the appropriate fields:
if [process.name] == "sshd(pam_unix)" {
dissect {
mapping => {
"event.message" => "%{event.outcome}; %{event.message}"
}
}
kv {
source => "event.message"
target => "sshd"
whitespace => "strict"
}
}
The extracted event looks as follows:
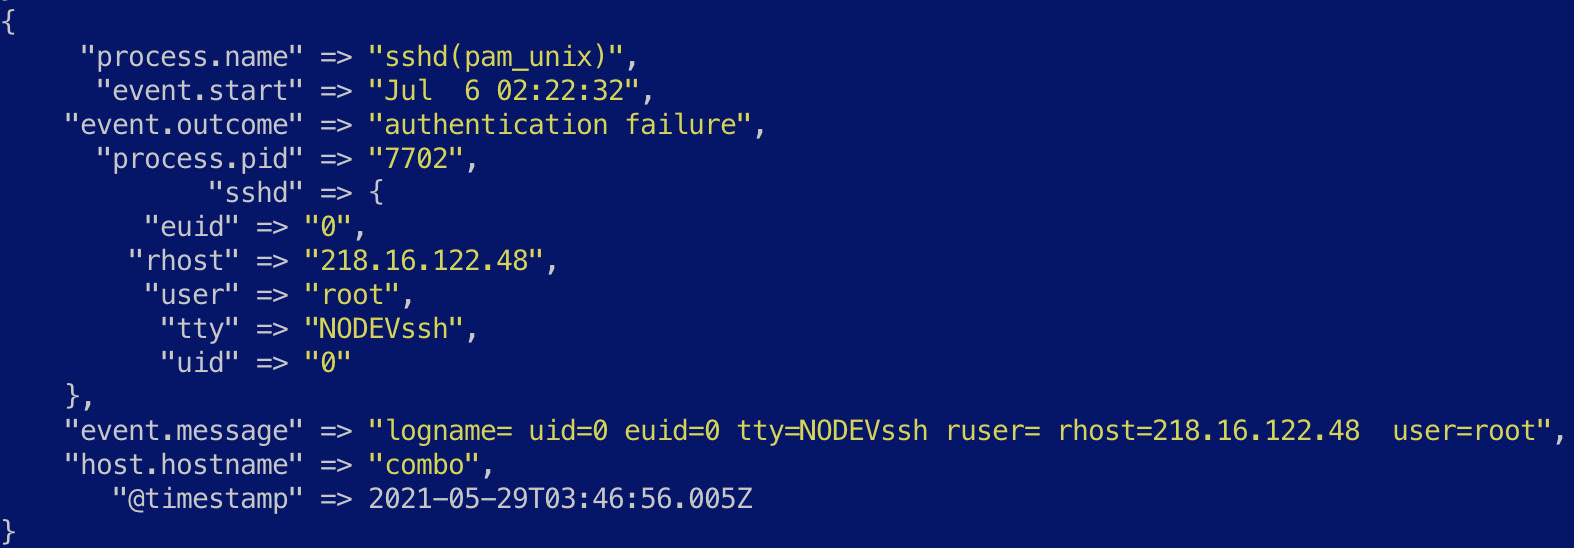
Figure 7.12 – Fields specific to the event extracted out for analysis
The pipeline definition file contains a few other conditionals to handle different processes writing to Syslog, using filter plugins that we have already described. Once the data is ready, the output plugin can be used to load it into your destination system as required.
- To see the pipeline running, navigate to the parsing-syslog directory on a terminal and execute the following command:
/usr/share/logstash/bin/logstash -f logstash-syslog.conf < linux-system.log
Next, we will look at enriching events with additional context using Logstash.
Enriching events with contextual data
A key use case in ETL workloads is enriching events with contextual information to make sense of the data in downstream consumption. Data enrichment is useful to tie in data from disparate systems in the context of your event (such as enriching a username with detailed information on the user obtained from a directory system) or to make inferences of a given field to make analysis more straightforward (such as identifying the geographic location tied to a public IP address):
- Navigate to Chapter7/enrich-events in the code repository and explore the firewall.log file. The following screenshot shows the first few lines in the file:
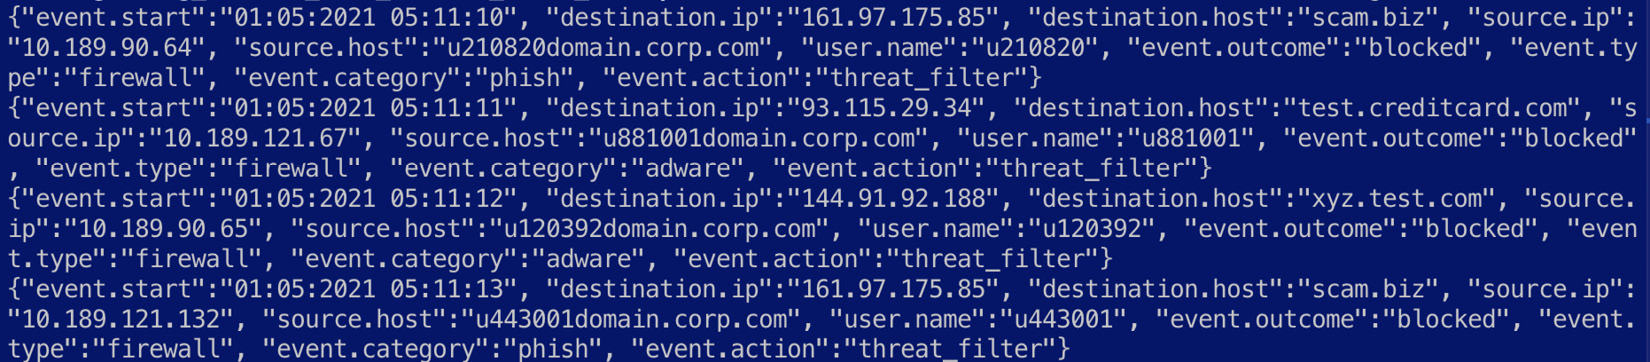
Figure 7.13 – An overview of firewall logs
The file is already in JSON format, so parsing will not be necessary for this pipeline. The following code blocks describe the pipeline in more detail.
- Given the data is already in JSON, the codec for the stdin input plugin can be set to parse the data:
input {
stdin {
codec => "json"
}
}
The event looks as follows:
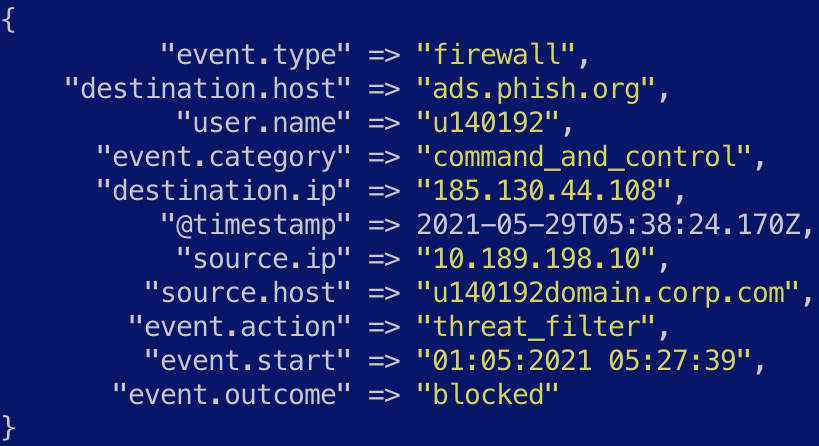
Figure 7.14 – An original event parsed into JSON
Now that we have the original event extracted into JSON, let's look at some enrichment options.
- Given the event contains a public IP address in destination.ip, the geoip plugin can be used to infer geographic information for the IP address:
geoip {
source => "destination.ip"
target => "destination.geo"
}
Important Note
The geo IP lookup process will only work on public IP addresses and not on private IP values such as source.ip.
- Once enriched, the event should look as follows:
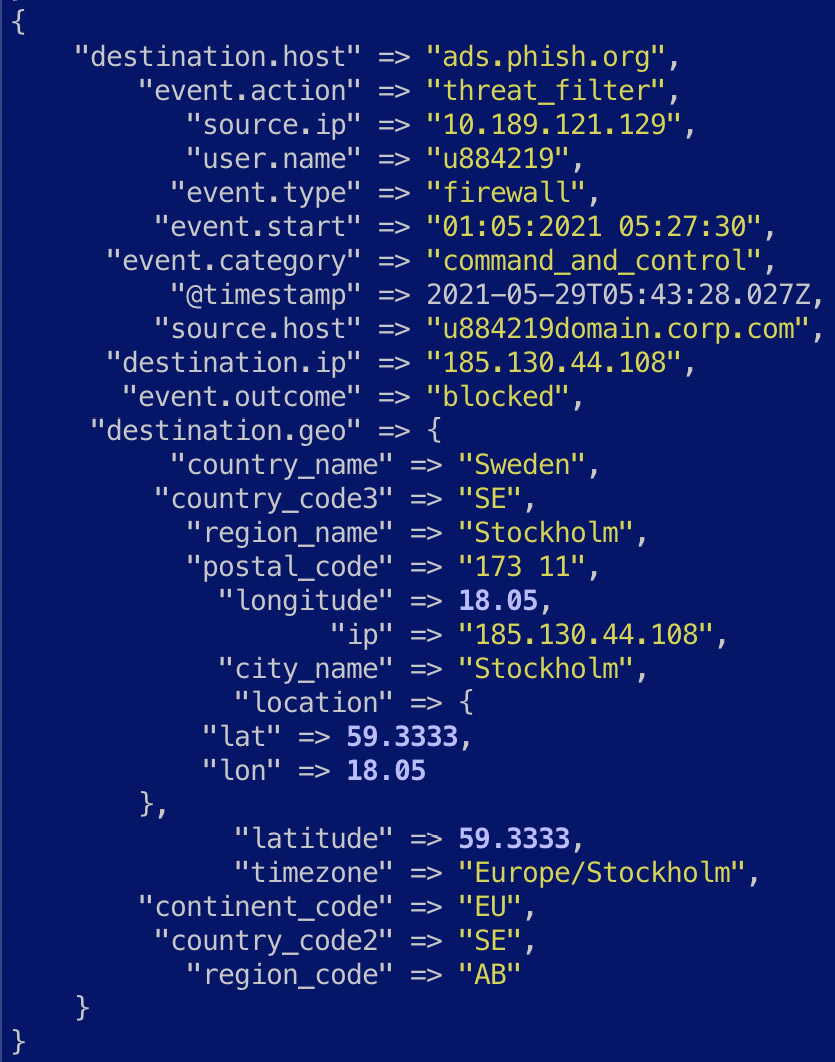
Figure 7.15 – The firewall log enriched with geo IP information
- Downstream use cases can now easily leverage the geographic information in the context of the event. For example, a machine learning job can identify rare geographic locations seen in the logs as an indicator of anomalous behavior.
- Next, we look at how the user.name field can be enriched with information obtained from an external system containing further details for the given user. The translate filter plugin can be used to look up a field in the event in a dictionary file on the host system.
- A dictionary user-lookup.json file is provided as part of the example and looks as follows. The dictionary file is structured so that the lookup field is a JSON key, and the enrichment details are represented as an object associated with the key:
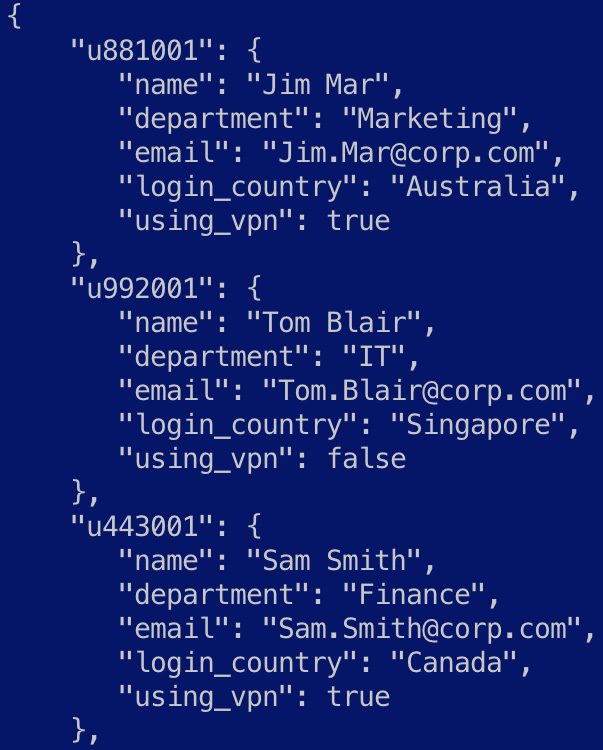
Figure 7.16 – An overview of the user lookup file
- Replace the dictionary_path value with the absolute filesystem path to the dictionary file. The lookup fields will be added under the user object in the event as defined by the destination parameter:
translate {
dictionary_path => "/<path_to>/enrich-events/user-lookup.json"
destination => "user"
field => "user.name"
fallback => "user_not_found"
}
The resulting event should look as follows:
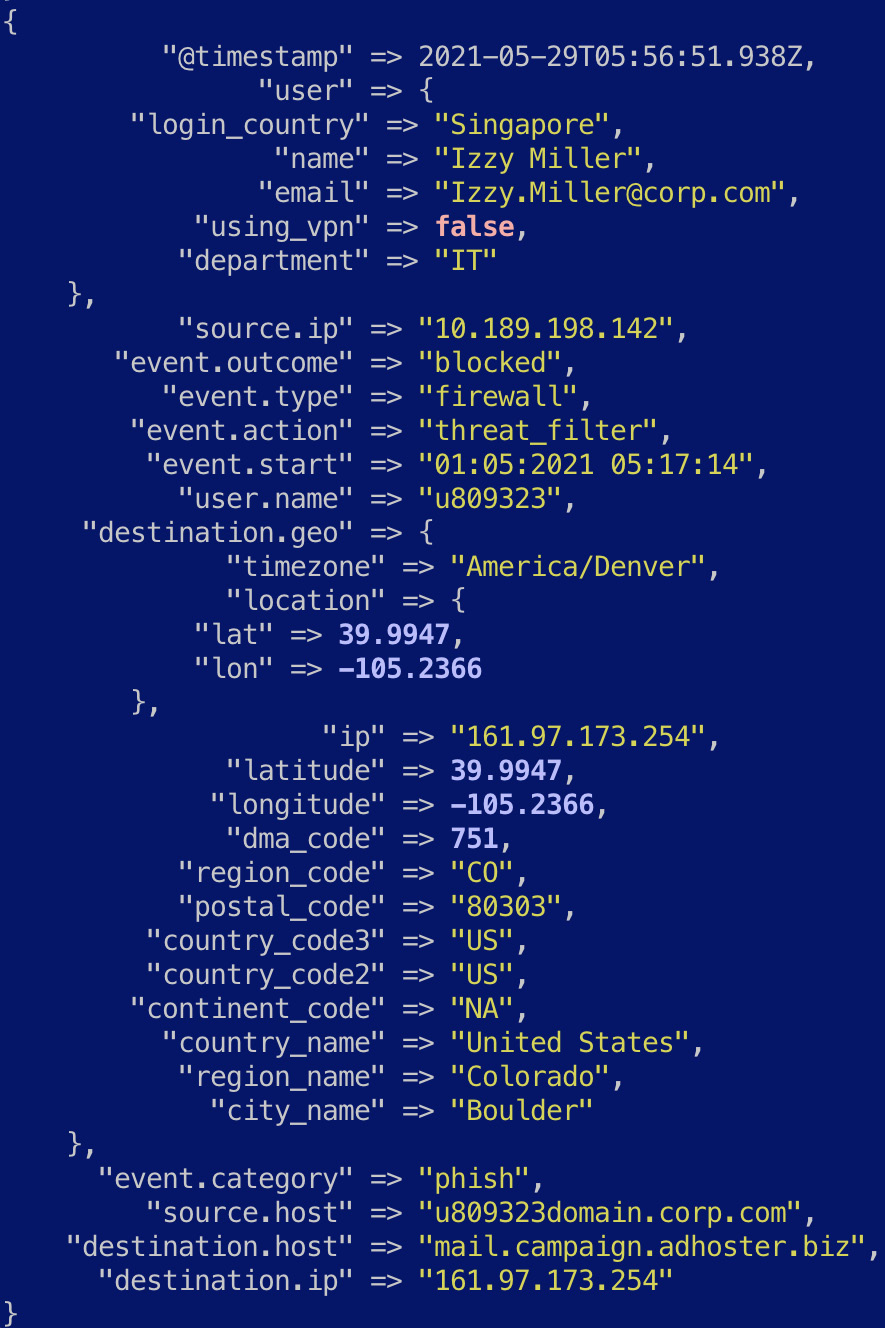
Figure 7.17 – The firewall log enriched with user information
- Lastly, we look at a combination of field values to determine whether a potential security threat was allowed through the firewall. To do this, we use a conditional and add custom fields to represent the security threat:
if [event.action] == "threat_filter" and [event.outcome] == "allowed" {
mutate {
add_field => {
"threat_match.outcome" => true
"threat_match.severity" => 2
"threat_match.rule_name" => "FW_ALLOWED_THREAT"
}
}
}
The resulting event where a potential threat may have been allowed should look as follows:
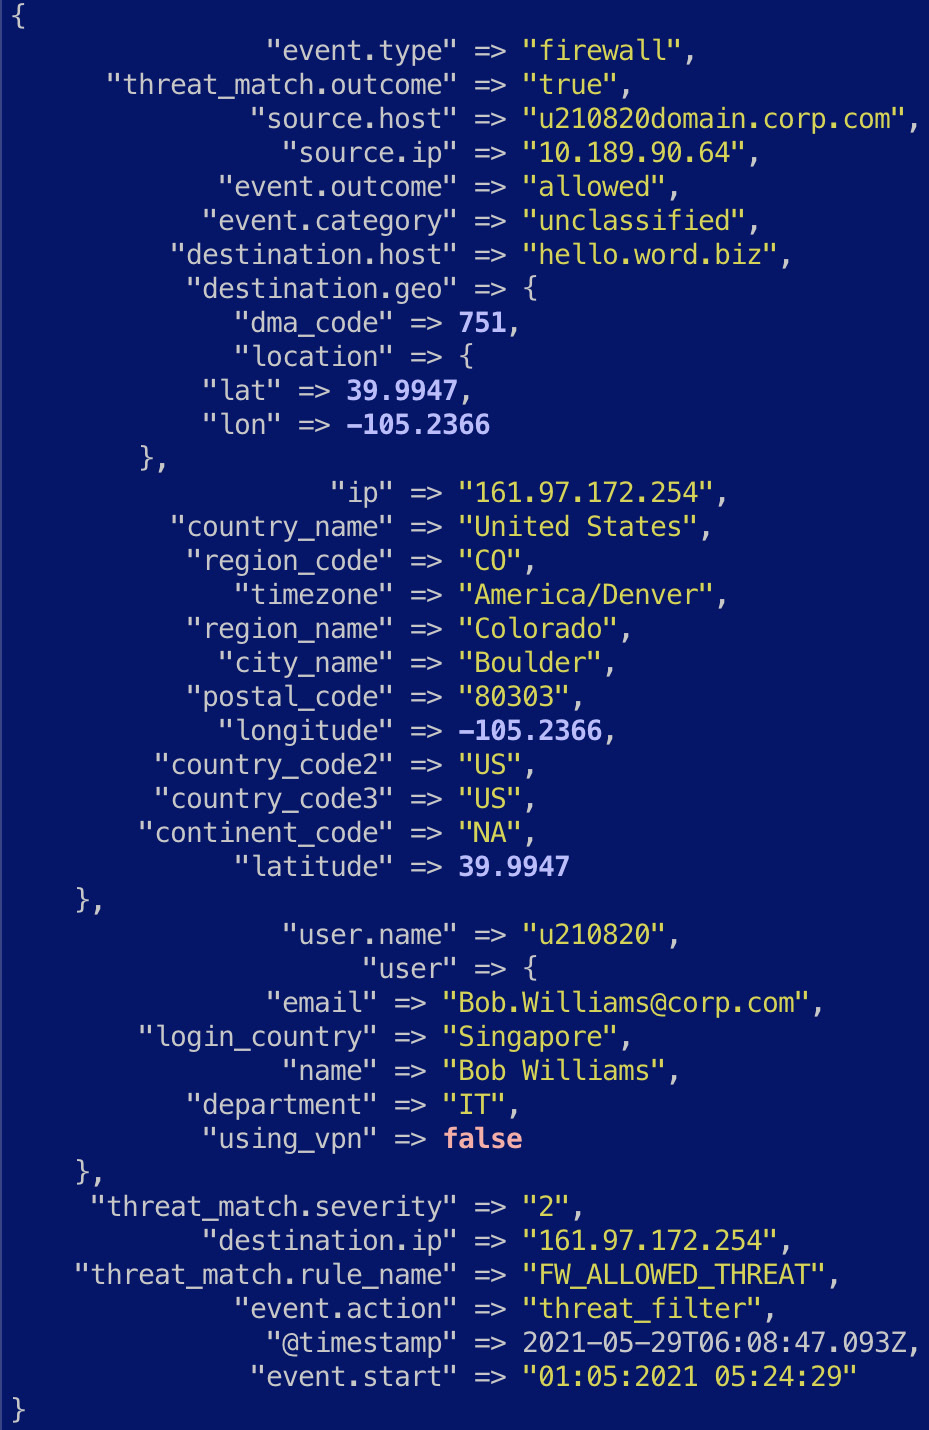
Figure 7.18 – The firewall log enriched with a potential security detection
- To run the pipeline, navigate to the enrich-events directory on a terminal and execute the following command:
/usr/share/logstash/bin/logstash -f logstash-firewall-enrich.conf < firewall.log
Next, we will look at how event streams can be aggregated on Logstash before being ingested into Elasticsearch.
Aggregating event streams into a single event
Log volumes can be significantly high in certain scenarios, making it costly and resource-intensive to collect, transform, and store every individual event for analysis. In certain use cases, it can be sufficient to collect an aggregated view of the incoming events for analysis instead of every single event. This scenario will look at how the network activity of a given user can be summarized over a time window prior to ingestion into Elasticsearch:
- Navigate to Chapter7/aggregating-events in the code repository and explore the firewall.log file. The following screenshot shows the first few lines in the file:
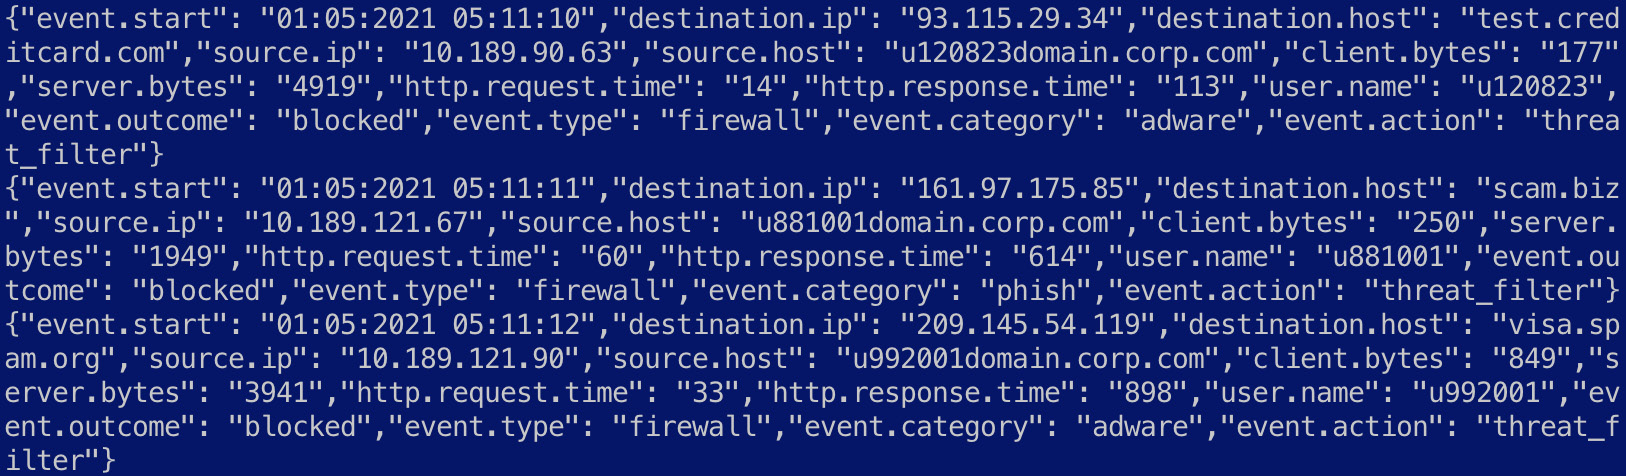
Figure 7.19 – An overview of firewall logs with network bandwidth fields
- As the event is already in JSON, the input plugin sets the codec value appropriately to extract each event:
input {
stdin {
codec => "json"
}
}
- We want to understand the bandwidth consumed by individual users over the firewall. The client.bytes and server.bytes fields are converted to integer values for aggregation:
mutate {
convert => {
"client.bytes" => "integer"
"server.bytes" => "integer"
}
}
The aggregate filter plugin is used to summarize the data in the events. The filter groups events by the user.name value as defined by the task_id parameter. The code block contains Ruby code to calculate the sum for client.bytes and server.bytes values.
- The timeout field controls the time window, during which aggregation occurs. It is set to 5 seconds in this instance but can be set to larger time intervals if more aggressive aggregation is required. At the end of the timeout window, the data summation of the fields is pushed out as an event:
aggregate {
task_id => "%{user.name}"
code => "
# define and set total_client_bytes to zero if it does not exist
map['total_client_bytes'] ||= 0;
map['total_client_bytes'] += event.get('client.bytes');
# define and set total_server_bytes to zero if it does not exist
map['total_server_bytes'] ||= 0;
map['total_server_bytes'] += event.get('server.bytes');
"
push_map_as_event_on_timeout => true
timeout_task_id_field => "user.name"
timeout => 5
timeout_code => "event.set('client_bytes_summary', event.get('total_client_bytes') > 1)"
}
More details on the aggregate filter plugin can be found in the reference guide: https://www.elastic.co/guide/en/logstash/8.0/plugins-filters-aggregate.html.
- Given that we're only interested in aggregated events, the following conditional along with the drop filter plugin can be used to get rid of the original events:
if [event.action] == "threat_filter" {
drop {}
}
The resulting events should look as follows:
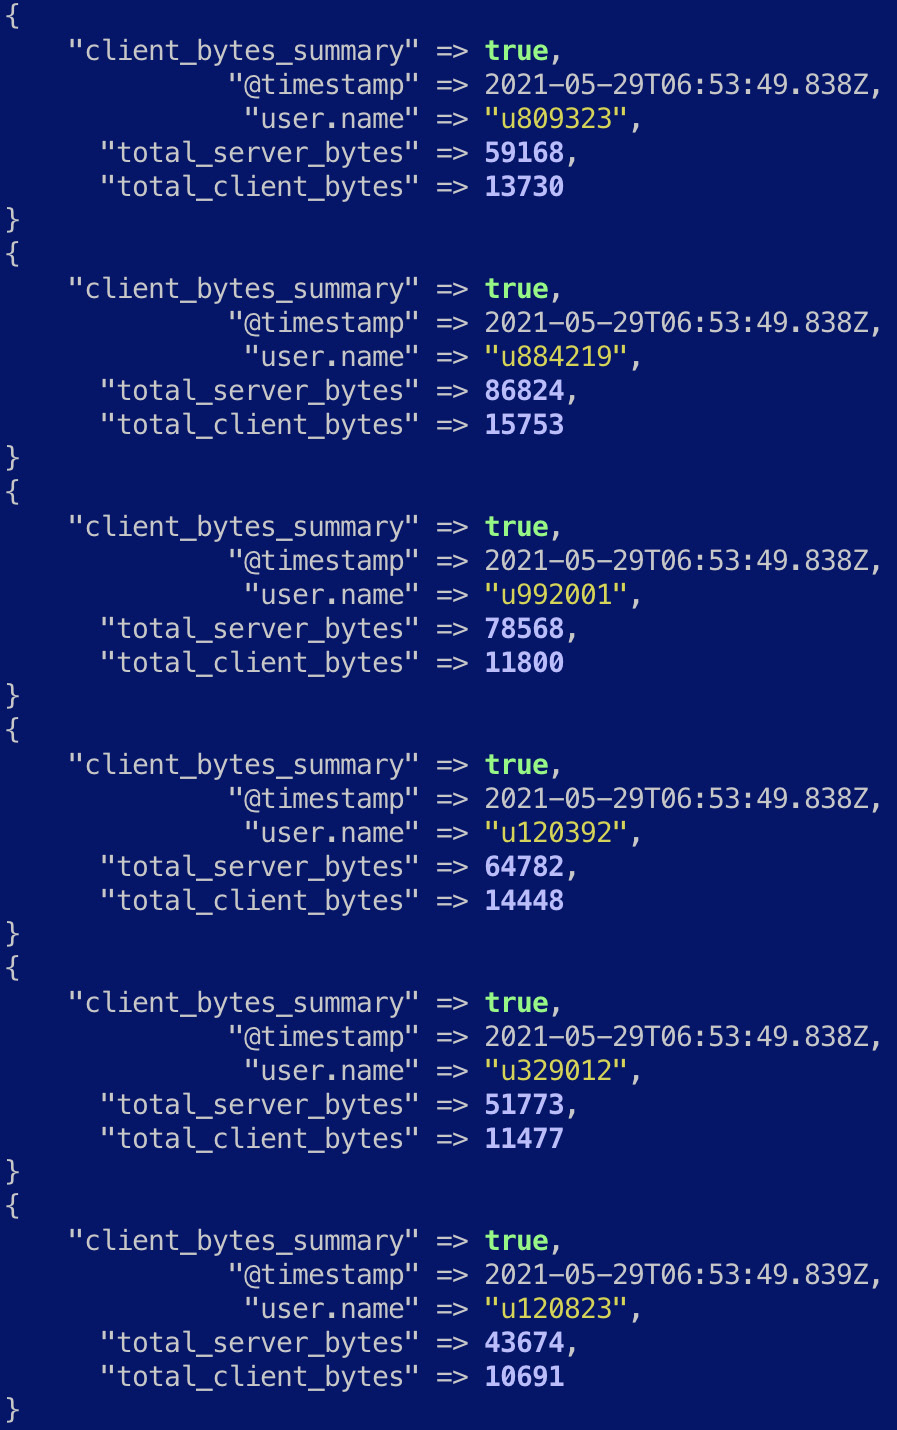
Figure 7.20 – Aggregated events displaying the total bandwidth consumption by a user
As expected, the original events are not sent to the output.
- To run this pipeline, navigate to the Chapter7/aggregating-events directory on your terminal and run the following command to start Logstash:
/usr/share/logstash/bin/logstash -f logstash-firewall-agg.conf
Once the Logstash process starts up, copy and paste the contents of the firewall.log file into your console and press the Enter key. Wait for the timeout used in the aggregation plugin for the aggregated results to appear on your console.
Processing custom logs collected by Filebeat using Logstash
In environments where data is generated on multiple source systems, an agent-based data collection mechanism is a common architectural pattern for data ingestion. As described in Chapter 6, Collecting and Shipping Data with Beats, Filebeat can be used to collect and send log files to Elasticsearch or Logstash if further processing is required.
Navigate to Chapter7/logs-filebeat-logstash in the code repository and explore the access.log file. The following screenshot shows the first few lines in the file containing standard Apache access logs:
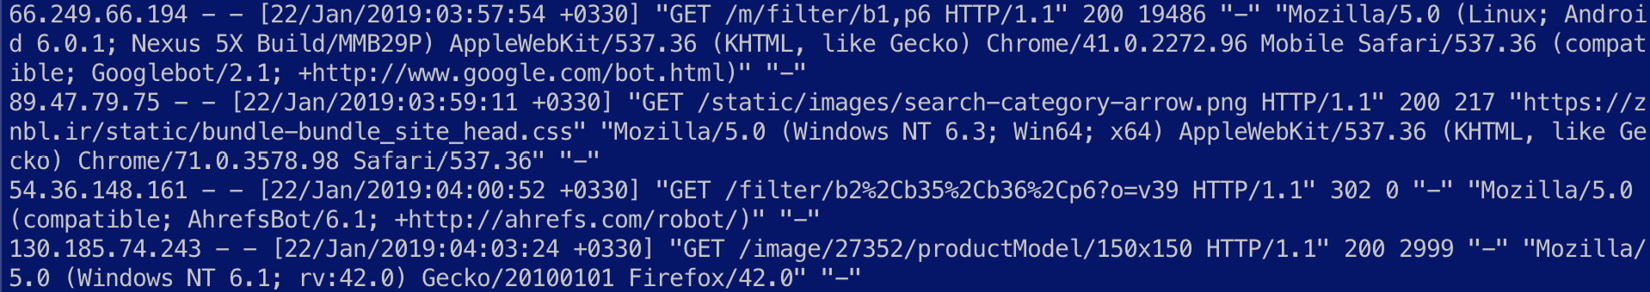
Figure 7.21 – An overview of Apache access logs
This example looks at using Filebeat to collect data from a given log file and sending it to Logstash for parsing. Logstash can then be used to load the data into the destination system:
- Configure filebeat.yml as follows:
filebeat.inputs:
- type: log
paths:
- /.../path_to/logs-filebeat-logstash/access.log
output.logstash:
hosts: ["127.0.0.1:5044"]
Remember to configure the path value to the absolute filesystem path for the access.log file.
- The example assumes Logstash and Filebeat are being run on the same host. The IP address can be changed in the output.logstash section if Logstash is run separately.
- The following code blocks describe the Logstash pipeline definition. The beats input plugin is used in this case, listening on the 5044 port:
input {
beats {
port => 5044
}
}
- Given the log message is a standard Apache access log, the following Grok pattern can be used to extract the data:
filter {
grok {
match => { "message" => "%{COMBINEDAPACHELOG}"}
}
mutate {
remove_field => ["host", "@version", "message"]
}
}
Once parsed, the event should look as follows:
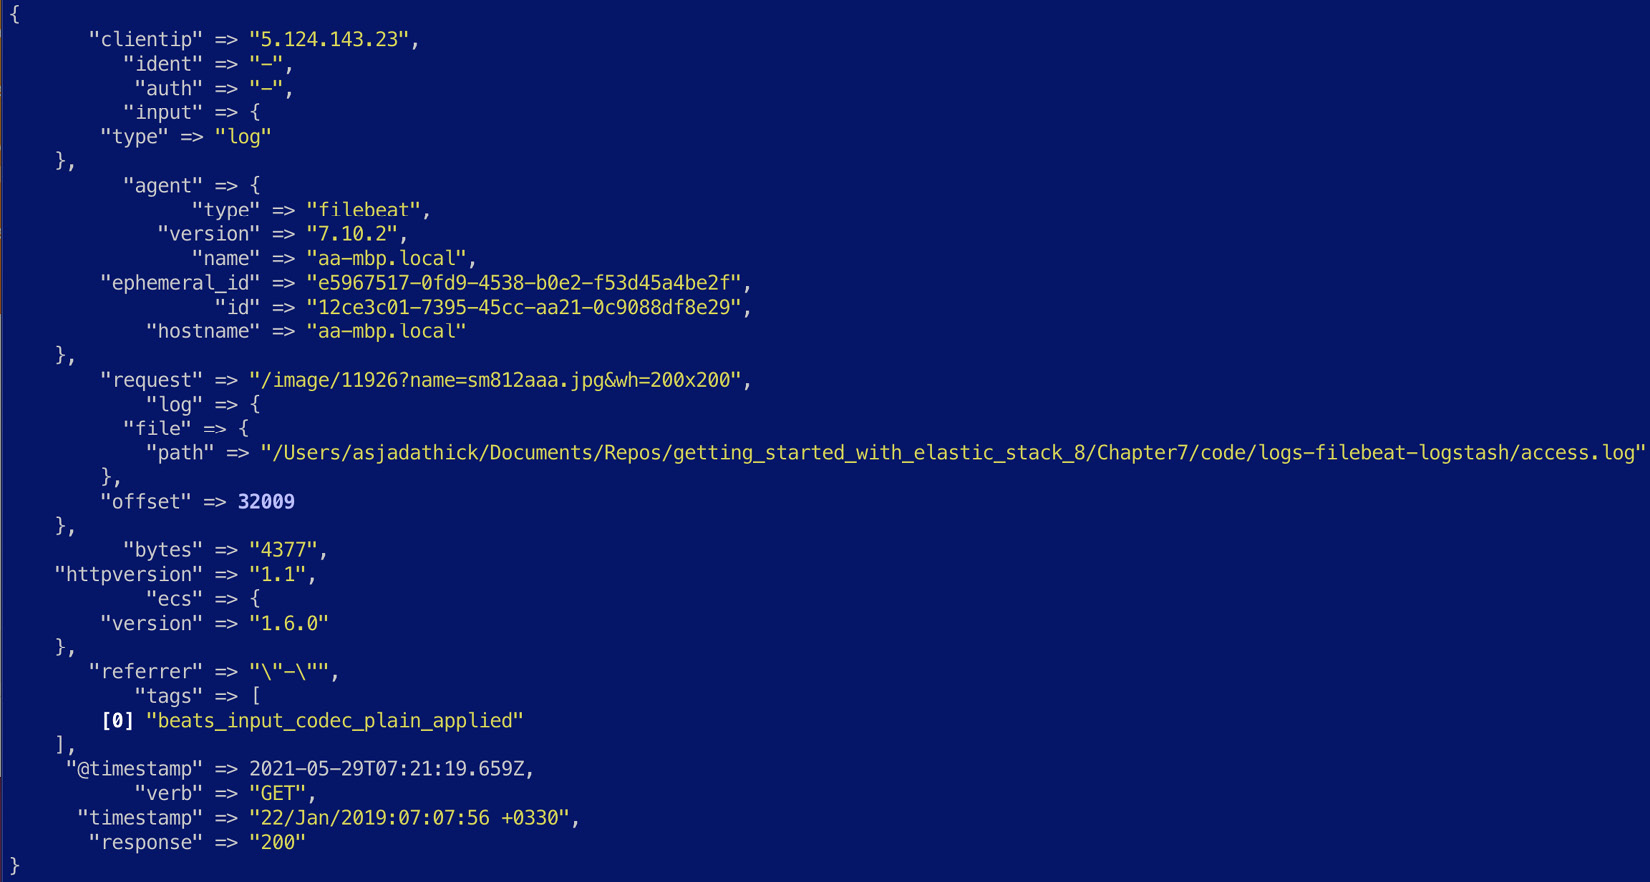
Figure 7.22 – A Filebeat event processed on Logstash
To see this pipeline in action, perform the following steps:
- Start the Logstash process to listen to data from Filebeat:
/usr/share/logstash/bin/logstash -f logstash-filebeat.conf
- Once the Logstash process has started, start the Filebeat process to collect and send the data:
/usr/share/filebeat/filebeat -c filebeat.yml
This concludes the various real-world ETL scenarios using Logstash.
Summary
In this chapter, we looked at using Logstash to extract, transform, and load data into Elasticsearch.
First, we looked at the internal workings of Logstash and familiarized ourselves with Logstash pipelines. Next, we explored common and generally useful Logstash input, filter, and output plugins. Finally, we ran through various real-world ETL scenarios and put together corresponding ETL pipelines to process and transform data before loading it into Elasticsearch.
In the next chapter, we look at how Kibana allows for the analysis and visualization of data and makes it possible for users to build and consume solutions on the Elastic Stack.