
Santiago Gutiérrez-Broncano, Mercedes Rubio-Andrés, Juan Carlos Zapata Valencia
1The measurement of human capital and its relation to the generation of business value: empirical study
Abstract: Although various empirical studies have attempted to measure the strategic contribution of human capital to a company, only a few use economic and financial indicators to measure that contribution. In this paper, we attempt to demonstrate how a measurement variable of human capital investment has a significant impact on the generation of business value. We also examine the role of a given sector in this relationship. Using a sample of 23 companies belonging to the Asociación Colombiana de Relaciones de Trabajo (Colombian Association of Work Relations) (ASCORT), we find that the larger the investment in human capital, the greater the economic development of a company, especially those in the service sector. These findings open the door to new research linking the strategic development of companies to investments in human capital.
1.1Introduction
Although currently most managers have the intuition that investment in employees typically results in additional value for their enterprise, it is unclear just how must additional value is generated [1].
“Our employees are the most important asset of the company” are words heard in most organizations. Despite this, few companies are able to prove that this asset indeed has an impact on the creation of added value for the company. In general, more emphasis is given to practices, such as employee satisfaction or investment in training; however, minimal importance is placed on the value generated by human capital.
Companies certainly wish to recover their investments in their employees and assume that employees will contribute beyond their own salaries and benefits, but it is difficult to determine just what their contribution consists of.
What might be the reaction of Wall Street analysts if a company were to announce that it was going to close one of its ten production plants to reduce costs? If we assume a typical 10% cut in the workforce, including generous compensation and early retirement, would this be more attractive to shareholders? This is the great dilemma facing most companies today. Intangible assets, as well as everything related to human capital, corporate social responsibility, reputation, and other items, are typically not factored into operating costs [2].
One might wonder whether investments in human resources reap financial rewards. The objective of this study is to identify variables in the measurement of human capital in enterprises that make it possible to establish a relationship between human capital and the generation of business value. To do this, we begin with a review of the literature on the importance of investing human capital and reveal the main indicators that allow us to measure the different organizational levels associated with human capital. This leads us to focus on those indicators that measure contributions at the strategic level. Finally, we carry out an analysis on 23 companies belonging to the Colombian Association of Work Relations (ASCORT) with the aim of studying the relationship between a company’s investment in human capital and the value generated by such an investment.
1.2Theoretical background and hypothesis
1.2.1Human capital and its relationship to value creation
Human capital has been defined at the individual level as the combination of four factors: heredity, training, experience, and attitude [3]. It is the sum of aspects inherent in workers: skills, knowledge, experiences, habits, motivation, and even the energy that workers demonstrate in carrying out their duties, creating a specific culture in each company [4]. Under these conditions, employees are able to learn, innovate, stimulate, and make changes, as well as think creatively, all of which factors are vital for the future success of a company.
The human resource management literature is based on the premise that human resources are vital to an organization’s strategy since, through their behavior, individuals have the potential to lay the foundation for strategy formulation and implementation [5]. In this way, they recognize that individuals’ knowledge, skills, and abilities are insufficient to create value for an organization, unless they are used through individual behavior [6, 7].
The human capital of companies is not precisely the workers, but rather the workers are the owners of their own human capital, and they exhibit said behavior in different areas of their private lives, including their interactions with their families, their communities, their hobbies, their sports, and in their work [1]. In this paper, we accept that a firm does not possess human capital; rather, individuals do. Companies need a higher level of knowledge, skills, and abilities; however, a superior alignment between individual and organizational goals is crucial [8].
Furthermore, many papers and reports relate the management of human resources to a greater generation of business value. The literature on strategic management of human resources has found sufficient evidence supporting the idea that a high commitment practices in human resource management lead to greater organizational performance (e.g., [9–14]). This set of practices, which is aimed at the management and development of human capital in organizations, serves to establish long-term relationships between companies and their employees, thereby promoting the sharing of the same strategic goals as well as the creation of a strong commitment between both parties and their respective objectives. All of this contributes to better performance of the organization [15].
A survey on human capital carried out by IBM Business Consulting Services at more than a thousand companies from 47 different countries demonstrates that a welldesigned and properly implemented human resource strategy can achieve a 35% increase in revenue per employee and a 12% decrease in absenteeism [16]. Conversely, those companies that reduced their workforce by more than 15% saw the price of their shares fall below the average level for their industry [17].
1.2.2Levels of human capital measurement: the value chain of human talent
Both the literature on human resources management and enterprise managers themselves have always recognized the need to establish human capital measurement systems in companies [1, 18].
Traditionally, researchers have measured the quality of human resources management systems using data related to various personnel policies implemented in a company gathered from a single informant [19]. Thus, the impact of human resource practices in business outcomes has been significantly different from what such works suggest and may be even greater than indicated in the literature.
One detected error is located in what is known as the percept–percept inflation, which occurs when the information of both dependent and independent variables originate from the same source [20]. This type of error poses the least threat thanks to the fact that most works obtained information from different sources [19].
Perhaps the more serious issues include those raised by Rush et al. [21], who established that respondents, either owing to faulty memory or because the requested data are unknown to them in their entirety, react by resorting to so-called implicit theories, which act as counsel when gaps in information are filled in a search for consistency among all data that have been produced. Thus, when information is requested by an informant, whether objective or subjective, it would seem logical to think that the respondent will react to information concerning the implementation of human resource policies in a way that is aligned with the same direction as the business results perceived by that informant.
Subsequent studies have supported this theory, demonstrating the need for some caution when it comes to measuring systems and human resource practices in enterprises [19]. For this reason, this work seeks alternative ways to measure the impact of human resource management systems in a company in a more objective way, as well as the impact those systems have on the generation of added value.
Historically, a variety of methods have been used to measure the productivity of the human factor. However, these methods have been mainly oriented toward efficiency in carrying out certain administrative tasks or related to the cost of productive activities [22]. The main problem that we face today is that the type of work carried out by the majority of employees and that generates greater business value is very different from traditional jobs; therefore, new formulas for the measurement, subsequent management, and improvement of value are required [23]. As shown in the latest report on global trends in human capital 2016 performed with more than 7000 business leaders and human resource experts in 100 countries, the great challenges of global impact involve redesigning the workplace, the workforce, and work itself [24].
There is a need for systems that can be used to evaluate the human capital contribution to business value creation and that are focused on more than just the technical efficiency of finished tasks or operations. Bontis and Fitz-Enz [25] suggest that the measurement of human capital is critical and vital to the future success of companies. The environment in which a company is currently functioning and that is becoming increasingly more competitive requires all areas to address the growing demand for better results [26]. Most company CEOs ponder the impact of their training and development, reconciliation of work and family life, improvement of the quality of life at work, work flexibility programs, and other aspects of work. In summary, it is crucial to be aware of the economic impact of investments in human capital development carried out by enterprises as part of their overall productivity and whether this will lead to dramatic improvements in business strategy and generate additional profits [27].
We must be aware that no department is allowed to make an investment without prior analysis of future profitability. However, in the field of human resources, despite the fact that most managers recognize that said resource is the main asset of the company, it is difficult to predict what profitability a given investment will generate owing to the difficulty involved in its measurement.
Therefore, this issue adds to current accounting problems, since the majority of intangible assets go unnoticed with respect to accounting information because they do not appear on balance sheets. As a result, the majority of investments carried out for staff are directly treated as costs. Thus, initially, a company will try to reduce costs, and the first programs to be cut will be those related to human factors since a clear and precise assessment of their impact on business results is unobtainable [1].
At this point, we may hesitate in asserting that human capital is an asset, but the definition given by the Financial Accounting Standards Board [28] leaves no doubt that our theory is correct. The FASB establishes three criteria for such a defintion: it must be an economic resource that is able to generate a cash influx or reduce outflows; the organization should aim to have rights or privileges in connection with it; and that resource as well as the rights of the employees must be listed in the financial statements of the company. In summary, an asset is a resource that is controlled by the company and is used to produce additional future inflows or reduce outflows. As for employees, we cannot regard them as a company asset as such, however, in the case of human capital companies usually establish a series of agreements by which employees put their capacities and abilities at the disposal of companies to generate income flows [1]. Thus, their capacities and abilities become a company asset.
One might wonder whether we can really measure the human capital of a company and analyze employee contributions. To do so, we must recognize the existence of different levels of impact created by human capital in a company. Some authors (i.e., [26]), based on the model of evaluation of capacity established by Kirkpatrick [29], have added an additional level to determine the value chain for the management of human talent. This is represented in the following Figure 1.1.

For each of these levels, we can find different types of measurement. For levels I, II, and III, we have measures that determine the economic benefits associated with a particular program or human resource policy. When compared with the investment made in this program, the degree of contribution can be established. By means of the cost/benefit ratio or the calculation of the profitability of the program or the productivity at work, we can know their total contribution to the company. In the case of levels IV and V, in which scenario we must determine the strategic contribution of human capital, the issue becomes more complex. To this end, we are required to rely on the calculation of various indicators such as the rate of strategic alignment, the ratio of retention of key personnel, employee satisfaction, work environment, and other factors. However, an obstacle arises in that this is not a direct reflection on the effect on business value creation; what really is needed are relevant performance indicators [18].
The indicators that are closer to these functions are considered global indicators, such as the rate of economic productivity of employees or the added value of human capital (human capital added value) [26]. Such indicators are criticized since individual employees do not actually make a proportional contribution to sales revenues, which may lead one to believe that the only way to improve those indicators is through reducing staff or wages [23]. However, these indicators attribute all the added value achieved to human capital, removing from consideration the role of financial capital. In this regard, it should be made clear that the value of an asset depends on its contribution of value to the company; however, in reality, the main assets generate value only in combination with other factors. For this reason, it would be a mistake to think of the value of any intangible asset as coming from outside the context of its function in combination with all other assets [1].
To summarize the preceding information, the result of the relationship between the management of human resources on the basis of human capital will have to include not only already commonly used planning and acquisition activities and programs aimed at obtaining support as well as retaining and developing human resources [30–32], but it should also measure the impact of those behaviors on the productivity and profitability of the company [33–35]. The strategic possibilities of this resource are expected to increase under this method.
Quantifying the ROI of human capital is then produced from the identification of human resource activities as a link in the structure of investment in companies, leading the discussion toward the assumption on human resources in their participation in the production system as an intangible asset [36], instead of its typical adoption as an operating expenditure.
For this reason, among the total operating expenses, the item corresponding to staff costs must be excluded. This is supported by the theory that defends human resources as intangible assets [37]. Thus, we already know the initial component of the calculation of the ROICH. Operating costs would be obtained by subtracting staff costs from the total expenditures in the accounting system. These costs commonly include the total number of payroll items and social benefits, contributions to health and retirement plans, and costs of training, development, safety, satisfaction, confidence, and participation in employee programs [38].
Since everything relating to personnel is considered an investment, it is essential to contemplate the possibility of treating it as an intangible asset. The theory behind the concept of return on assets [39] locates the accounting base of investment in human capital in the denominator of the relationship, giving rise to the return on investment in human capital, much as one would do with any other tangible asset.
![]()
Equation 1: Return on investment in human capital. Source: [40]
Although the preceding equation arises from a theoretical analysis and evidence collected by Fintz-Enz over the last 15 years in a consulting practice, there is no way to dismiss the relevance of this model since it mandatorily responds to the requirements implicit in the organizational goal of profitability, as demonstrated in what follows.
It should be noted that, from a mathematical perspective, as an indicator of the return on investment, the ROI can only increase at the expense of a decline in the denominator, implying in this case a reduction in the implementation of the budget for investment in human resources. This may also be done by an increase in income items or a decrease in other operational costs. Nonetheless, it is necessary to consider that the investments and their corresponding returns are dependent on the behavior of the market and economic conditions, apart from human behavior.
Once the analysis that theoretically shows the interaction between investment in human capital and the factors that affect the generation of business value is complete, so that we have the tools to measure it, we put forth our first working hypothesis:
H1: There is a positive relationship between investment in human capital and the generation of business value.
Keeping in mind that the activity sector will significantly impact personnel costs, and considering the above stated relationship, we may establish a priori that companies that devote more economic effort to employees will be those that will make an increased investment in human capital. Therefore, such companies are more oriented toward the development of a particular service than those with a productive focus. As a result, the amount of investment in human capital will be less compared to other investments that the company makes in technology, innovation, and other areas. For this reason, we put forth our second hypothesis as follows:
H2: The sector of activity to which a company belongs will influence the generation of business value.
Finally, we propose our third hypothesis, where the sector of activity of a company will moderate the relationship between investment in human capital and the creation of value in the following way:
H3: The sector of activity of a company moderates the relationship between investment in human capital conducted by the company and the generation of value achieved, being greater for companies in the service sector and lower for companies in the industrial sector.
Thus, our model is represented as follows (Figure 1.2):

1.3Research design
1.3.1Source of data, study population, and sample
To verify the hypothesis, our study population is composed of enterprises affiliated with ASCORT.
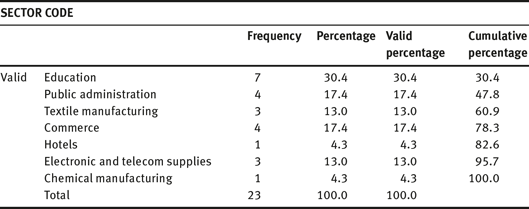
ASCORT is an association recognized in the Colombian business world as an entity that provides services in areas related to the management of human resources in the business field. Additionally, it brings together 331 important companies in the Colombian business community, including, in its database, institutions at different levels in terms of structure by size, as well as representatives of each economic sector of the country: industrial sector, financial sector, commercial sector, chemical industries sector, health services sector, public services sector, cooperatives of associated work, and official institutions. See Tables 1.1, 1.2 and Figure 1.3 to see the composition of the sample used.
To collect the information, we appealed directly to the enterprises, which were asked to provide information on the total value of items for 2009. The required data were obtained from balance sheets as well as the profit and loss accounts. To ensure the accuracy of the information, it was compared to the information contained in financial databases belonging to the chambers of commerce of Colombia.
Although the questionnaire was sent to the entire population, responses were obtained from only 23 companies, a 6.95% response rate. Though this is not a large sample of companies, the data are sufficient to achieve a minimum statistical significance through a normal distribution. In addition, this response rate is in line with that of other works using similar methodologies.
Table 1.2: Sectors and subsectors of activity.


1.3.2Study variables
To determine the profitability of the investment in human capital (ROICH) for each of the companies sampled, data on the total income for the period under study were obtained, as well as the total of operating expenses and investment in human capital, all taken from the accounting item of personnel costs.
It is worth mentioning that total personnel expenditures were complemented by the executed value of items aimed at training, welfare, and development programs, as well as the corresponding factor of social benefits. Thus, as was discussed in the theoretical analysis of the return on investment, personnel costs were excluded from the total of operating costs, and they became part of the index denominator, showing that this was indeed an investment in an intangible asset [37, 41, 42].
The return on investment in human capital estimated using the equation designed by Fitz-Enz [34] shows no economic amount of direct return. Instead, it indicates the number of times a unit of investment made by the company is returned depending on income.
To measure business value generation, we chose to analyze the operating free cash flow. The importance of the free cash flow indicator is based on the recognition it enjoys, making it the best tool to determine the business value or “rod of financial measure that truly shows the value of an organisation” [54, p. 2].
Given the circumstances characterizing the financial analysis of companies, any effort to show the impact on the creation of value caused of the way a factor of production is handled should justify the impact and the force with which such effort influences the generation of liquidity. This is measured by means of the free cash flow [43], given that no company can operate indefinitely with a short-term cost-cutting focus. However, if managers fail to complete their work analyzing cash flow, such that they only focus on profit, many companies will not survive in the long term [44].We ought to consider that the presence of high profits is not necessarily related to the existence of a box to service debt or distribute profit sharing [39].
In addition, it is important to design models that allow one to shape a company’s economic behavior in the return on investment and future free cash flows [45]. To do so, one must take into account that the scope of corporate financial objectives may be better achieved through the use of probabilistic models, which, although at times unprecise, usually offer greater insight as compared to projects carried out blindly in an environment with so much uncertainty.
1.4Analysis of results
As the reader can see from the results presented subsequently in Table 1.3, after contrasting the theoretical information, the minimum expected value in the ROI of human capital index equals 1, which determines the balance of the investment. In other words, if ten euros are invested in human resources, this represents ten euros in return for the company. A simple interpretation of this result would mean that the human resource minimally influences the generation of income, as was theoretically discussed in the section on the return on investment.
To defend the participation of human capital in the generation of value in a given company, it is expected that the ROICH index will tend to be greater than 1. This indicates that the role of the human factor obviously affects revenues.
In our study, only three companies presented ROICH rates below 1, which, in the light of the theoretical framework, could be interpreted as meaning that allocating a budget to the human resources of these companies has a negative impact, since not even what is invested is expected to be recovered.
This is justified in accounting theory from the perspective of personnel expenditures. That is to say, obtaining a value for this index of less than 1 or even negative would always force one to contemplate the possibility that executed items, which in principle were slated for personnel projects and programs, would actually constitute an expenditure, since not even the cost of personnel is recovered.
However, it is necessary to highlight that this relates to particular cases; most of the results obtained in this study also relate to intrinsic conditions as well as to the current management implemented for each company.
If we want to know the status of a sample, Table 1.3 clearly shows that the average of this indicator for the companies analyzed exceeds 4 points, which leads us to assume that those companies consider their human capital to be important.
If we look at the data carefully, we see that there exists a high variability among the companies, which, at the same time, confirms the influence of each company’s specific characteristics on the results.
An average of 4.60 in the results of the return on investment in human resources suggests that the trend in the implementation of a human resources budget is associated with a greater proportion devoted to investment, potentially translatable into capital, in contrast to the common perspective of expenditure, as is regularly assumed in accounting systems [46].
Considering the relevance of the equation for ROICH [34], this constitutes evidence of the role played by human resources, not only through their participation as a factor of production but also in their representative role in generating business value, which ultimately converts investments into capitalizable items.
The calculation of the operating free cash flow resulted in 34.78% of the sample being negative. This does not mean, however, that the financial performance of a given company is not practical. On the one hand, it has already been established that this indicator reflects the level of liquidity of the company, such that it is highly dependent on the volume of revenue. Moreover, it is important to state that it is affected by the performance of accounts receivable and inventory management.
The preceding indicator can be used to generate for some companies, in certain cases, a margin of performance that allows them to operate under these conditions.
However, in the interpretation of these findings in aggregate form, as proposed by this study, it is possible to infer that the fact that the company has not been liquid in a given period might imply that during a given period, the financial performance of the company has failed to meet the results expected for the end of the budget year. Consequently, neither the debt service nor the distribution of profits to shareholders can be covered. In summary, these results are associated with the destruction of business value. In addition, these results may provide a guideline in the financial behavior of the company, causing biases and compromising liquidity in future periods, thus making it relevant to evaluate investment decisions.
Table 1.3: Descriptive Statistics of ROICH. Source: Authors’ elaboration from survey data.
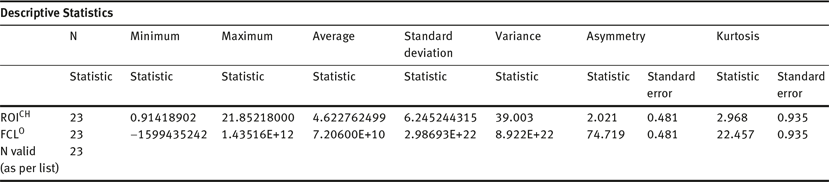

Table 1.4: Correlation study. Source: Authors’ elaboration from survey data.

Note: * The correlation is significant at 0.01 (2 tails).
Furthermore, one proportion of the sample study (65.22%) presents favorable results (see Figure 1.4). According to the theory of financial analysis, it would seem clear that these companies worked in a particular way with an orientation toward facilitating the creation of value for shareholders.
In this analysis, it is necessary to conduct a study of correlation, which may indicate the existence of a relationship between the results of the two variables profitability of investment in human capital and business liquidity as a manifestation of the creation of value. It is also relevant to estimate the direction and strength with which they relate to each other during the verification of that relationship.
Clearly, the results must be supported by valid and reliable techniques, which is essential to estimating whether a given relationship is statistically significant.
The correlation study conducted determines the Pearson coefficient between the results of both indicators. The result indicates that the relationship between the two variables is positive, with a value of 60.0%. Such a result indicates that the relationship is direct and has a force equivalent to the percentage value (see Table 1.4). However, to achieve the objective raised by the hypothesis, this result must be interpreted in the light of its statistical significance, which, as shown in the table, must be below the P-value, so it should not exceed 0.05 in absolute terms. The study shows that the results are statistically significant at 99%.
From the results it is possible to infer that there is a direct relationship between return on investment in human capital, calculated using the equation of Fitz-Enz [34], and the generation of business value, deduced from the interpretation of financial behavior on the basis of operating free cash flow.
In contrast, if we consider that the sample used contains fewer than 30 data samples, it is pertinent to estimate the use of structural equations for analysis, since they present certain advantages over traditional multivariate techniques [47]. In particular, we will use the technique called PLS through the SmartPLS 3.2.3 software. This technique is suitable in the initial stages of an investigation and when few data are available, as in our case. With 5000 subsamples obtained by using the Bootstrap resampling technique, we attempt to determine the statistical significance of the coefficients in the structural model. This model is also examined by the value and the significance of standardized β path coefficients and the R2 values of the dependent variable.
1.5Results
1.5.1Evaluation of measurement model
The individual reliability of an item need not be measured since it has a variable that has been obtained from financial statements. With respect to both the ROICH and the FCLO, the load assumes the maximum value of 1 (as shown in Table 1.5), which means it exceeds the values recommended by Carmines and Zeller [48]. Regarding the internal consistency, this is computed through composite reliability and convergent validity by applying the average variance extracted (AVE). As we predicted, these values are above those recommended, since they are 1 in both cases.
Table 1.5: Convergent reliability and validity.
| FCLO | 1.000 |
| Moderating Effect | 0.963 |
| ROICH | 1.000 |
| SECTOR | 1.000 |
Finally, to measure the discriminant validity, we compare the square root of the AVE with correlations between constructs according to Fornell and Larcker’s [49] recommendations. As shown in Table 1.6, the square root of the AVE is higher for all the constructs than the correlations between them, which suggests that each construct is more strongly related to its own measures than with those of others.
Table 1.6: Discriminant validity.

The first approach works well for large sample sizes; however, it is not well suited for samples of smaller scale such as ours. Therefore, to check the discriminant validity, we will analyze the HTMT criterion by intervals, which is based on a comparison of the “heterotrait–heteromethod” and the “monotrait–monomethod” correlations [50]. This will allow us to identify the discriminant validity for samples of any size. As we can see in Table 1.7, none of the intervals is 1, as recommended by the existing literature [50], which again confirms the discriminant validity of the model.
Table 1.7: Discriminant validity.

1.5.2Evaluation of structural model
Once the measuring instrument has been validated, we proceed to contrast our first hypothesis, where the effect of the ROICH in the FCLO is evaluated. In Figure 1.5, we can see that the ROICH has a significant influence on FCLO, with a value of T = 1.567. This fact allows us to corroborate hypothesis 1 (H1: β = 0.55, p = 0.059). Regardless, we cannot confirm that the sector influences in a significant manner the relationship between ROICH and FCLO because, although we find a high value for the statistic (T = 0.966), it does not reach the minimum value recommended to support hypothesis 2 (H2: β = 0.245, p = 0.167).
To test hypothesis 3 and to measure the interaction (moderation) effect that the (industrial or service) sector establishes in the relationship between ROICH and FCLO, the effect of orthogonalization [51, 52] was examined. This method is highly recommended when few observations and few indicators are available, as in our case, and it also mitigates the potential effect of multicollinearity [52]. Although this method accepts the use of small samples, and we have β = 0.637, the significance of this effect has not yet been demonstrated since the value of the statistic T has been 0, not even achieving minimal values accepted in the literature. However, when we look at the power of the sector, we do it through the f square [53]. The value that is reached for this moderating effect is 0.498, indicating a strong moderating effect.

To better understand the strength of this interaction effect, it is represented in Figure 1.6. Even though the effect of ROICH on FCLO is extremely high in the example of the service sector, in the case of the industrial sector, this effect diminishes and even changes direction.

1.6Conclusions and discussion of results
Our work highlights the lack of economic indicators for the measurement of human capital when it comes to analyzing its contribution to the strategic development of a company. Hence the need to consider the degree of contribution of certain indicators related to investment in human capital with variables of economic and financial development of organizations is often ignored. Using the ROICH indicator, our study has led us to identify a direct and positive relationship with the generation of business value measured by operating free cash flow. Therefore, the validity of such an indicator is demonstrated when it comes to making strategic decisions since its impact on economic development is well known. Although we are aware that it is a first approximation, owing to the shortage of studies on the topic in the literature, we consider it fundamental to continue this line of work in order to establish the impact of certain global indicators of human capital. This will not only represent a step forward for the knowledge base, but it will also empower managers to use precise tools for their decision making.
We have been able to establish how ROICH can be considered a valid measurement variable to determine the contribution of human capital to the achievements of a company’s strategic goals and the level of contribution of certain financial indicators such as cash flow. The sector to which the company belongs also influences this indicator.
On the other hand, and even though in the present work it has not been statistically justified, we can establish a priori that the sector of activity of a company could have a moderating effect on this relationship. Therefore, it would be necessary to deepen the study of this relationship to determine the validity of those indicators in different sectors.
Future research that may arise as a result of these findings should bring greater knowledge regarding the impact of ROICH on other economic and financial variables that companies use in their control panel, such as profitability, net profit, sales growth, market share, and so on. Getting to know the impact of a company’s investment in global human capital on significant financial indicators provides a very useful management tool. Furthermore, it modifies the current view of the human factor as linked to a business cost and should be understood undeniably an asset in which the company must not only continue to investing but also expect to see profitability and business development from, in both the term and long term.
In this way, we may apply the theory of human capital to business management models, all the while remembering that the contribution made to a company by human capital occurs in combination with other resources, both technological and financial. Determining the contribution of each of the most important elements of a company to both its present and future economic development would allow for significant improvements in the senior management decision-making process, leading to a boost in competitiveness that this would bring as a result of generating more effective information systems.
Bibliography
[1]DiFrancesco JM (2002). Managing Human Capital as a Real Business Asset. IHIRM Journal 6:7– 16.
[2]Juliano J (2007). Putting an ROI on human capital. Natural Gas & Electricity 23(9):25–28.
[3]Hudson W (1993). Intellectual Capital: How to build it, enhance it, use it. New York: John Wiley.
[4]Vodak J (2010). How to measure return on investment into human capital development. Cag University Journal of Social Sciences 7(1):1–20.
[5]Colbert BA (2004). The complex resource-based view: Implications for theory and practice in strategic human resource management. Academy of Management Review 29(3):341–358.
[6]Colvin AJS, Boswell WR (2007). The problem of action and interest alignment: Beyond job requirements and incentive compensation. Human Resource Management Review 17(1):38–51.
[7]Wright PM, McMahan GC, McWilliam A (1994). Human resources and sustained competitive advantage: A resource-based perspective. International Journal of Human Resource Management 5(2):301–326.
[8]Wright PM, Dunford BB, Snell SA (2001). Human resources and the resource based view of the firm. Journal of Management 27:701–721.
[9]Arthur J (1994). Effects of human resource systems on manufacturing performance and turnover. Academy of Management Journal 37:670–687.
[10]Huselid MA (1995). The impact of human resource management practices on turnover, productivity, and corporate financial performance. Academy of Management Journal 38:635–672.
[11]Appelbaum E, Bailey T, Berg P, Kalleberg A (2000). Manufacturing advantage: Why high-performance work systems pay off. Ithaca, NY: ILR Press.
[12]Bae J, Lawler JJ (2000). Organizational and HRM strategies in Korea: Impact on firm performance in an emerging economy. Academy of Management Journal 43:502–517.
[13]Bartel AP (2004). Human resource management and organizational performance: Evidence from retail banking. Industrial and Labour Relations Review 57:181–203.
[14]Wright PM, Gardner TM, Moynihan LM, Allen MR (2005). The relationship between HR practices and firm performance: Examining causal order. Personnel Psychology 58:409–446.
[15]Sun LY, Aryee S, Law KS (2007). High-performance human resource practices, citizenship behavior, and organizational performance: a relational perspective. Academy of Management Journal 50(3):558–577.
[16]IBM (2002). Global Human Capital Survey. Retrieved from http://www-935.ibm.com/services/us/gbs/bus/pdf/ge510-9455-global-human-capital-survey.pdf, last accessed 2016-06-26.
[17]Rigby D (2001, 13 August): Downside of downsizing. Financial Times.
[18]PricewaterhouseCoopers (2015). 18th Annual Global CEO Survey. A new take on talent. Retrieved from http://www.pwc.com/gx/en/financial-services/publications/assets/fs-publication-a-new-take-on-talent-feb-2015.pdf, last accessed 2016-05-15.
[19]Gardner TM, Wright PM (2009). Implicit human resource management theory: a potential threat to the internal validity of human resource practice measures. The International Journal of Human Resource Management 20(1):57–74.
[20]Gerhart B (1999). Human resource management and firm performance: measurement issues and their effect on causal and policy inferences. In: Research in Personnel and Human Resources Management, Supplement 4, Wright PM, Dyer LD, Boudreau JW, Milkovich GT (eds). Greenwich, CT: JAI Press, 31–51.
[21]Rush MC, Thomas JC, Lord RG (1977). Implicit Leadership Theory: A Potential Threat to the Internal Validity of Leader Behavior Questionnaires. Organizational Behavior and Human Performance 20:93–110.
[22]Wintermantel RE, Mattimore KL (1997). In the changing world of human resources: matching measures to mission. Human Resource Management 36(3):337–342.
[23]Bukowitz WR, Williams RL, Mactas ES (2004). Human capital measurement. Research technology management 47:43–49.
[24]Deloitte (2015). Tendencias globales en capital humano en 2015. Liderando en el nuevo mundo. Retrieved from http://www2.deloitte.com/content/dam/Deloitte/ar/Documents/human-capital/Tendencias%20Globales%20en%20Capital%20Humano%202015.pdf, last accessed 2016-12-10.
[25]Bontis N and Fitz-Enz J (2002) Intellectual capital ROI: a causal map of human capital antecedents and consequents. Journal of Intellectual Capital, 3(3):223–247.
[26]Torres JL (2005). Enfoques para la medición del impacto de la gestión del capital humano en los resultados de negocio. Pensamiento & Gestión 18:151–176.
[27]Sung T (2002). ROI of human capital. T+D 56(11):10.
[28]FASB (2006). Board Meeting Minutes 07-26-06. Retrieved from http://www.fasb.org/jsp/FASB/Document_C/DocumentPage&cid=1218220109217.
[29]Kirkpatrick D (1979). Techniques for evaluating training programs. Training and Development Journal 33(6):78–92.
[30]Fitz-Enz J (1999). ¿Cómo medir la gestión de recursos humano? Alameda Recalde: Ediciones Deusto S.A.
[31]Fitz-Enz J (2009b). How to measure human capital’s impact on processes. In: ROI of human capital: Measuring the economic value of employee performance. American Management Association International, 66–105. AMACON, New York.
[32]Phillips JJ, Phillips P (2009). Using ROI to demonstrate performance value in the public sector. Performance Improvement 48(4):22–28.
[33]ICON Group International, Inc. (2001). Financial indicators: Computer programming services: ICON Group International, Inc.
[34]Fitz-Enz J (2003). El ROI del capital humano: ¿Cómo medir el valor económico del rendimiento del personal? Barcelona: Deusto.
[35]Subramony M, Krause N, Norton J, Burns GN (2008). The relationship between human resource investments and organizational performance: A firm-level examination of equilibrium theory. Journal of Applied Psychology 93(4):778–788.
[36]Ballester M, Garcia-Ayuso M, Livnat J (2003). The economic value of the r&d intangible asset. European Accounting Review 12(4):605–633.
[37]Bhattacharya M, Wright PM (2005). Managing human assets in an uncertain world: Applying real options theory to hrm. International Journal of Human Resource Management 16(6):929– 948.
[38]Davoine L, Erhel C, Guergoat-Lariviere M (2008). La calidad del trabajo según los indicadores europeos y otros más. (Spanish). Revista Internacional del Trabajo, 127(2/3):183–221.
[39]García O (1999). Administración financiera: Fundamentos y aplicaciones (3rd edn, vol 1). Medellín: Prensa Moderna Impresores S.A.
[40]Fitz-Enz J (2009a). How to measure human resources’ value added. In: ROI of Human Capital: Measuring the Economic Value of Employee Performance. American Management Association International, 106–143. AMACON, New York.
[41]Amit R, Schoemaker PJH (1993). Strategic assets and organizational rent. Strategic Management Journal 14(1):33–46.
[42]Bullen ML, Eyler K-A (2010). Human resource accounting and international developments: Implications for measurement of human capital. Journal of International Business & Cultural Studies 3:1–16.
[43]Huselid MA, Jackson SE, Schuler RS (1997). Technical and strategic human resources management effectiveness as determinants of firm performance. Academy of Management Journal 40(1):171–188.
[44]Alix J, Ramaekers L (1995). Cash is king. Chief executive 104:40–44.
[45]Khosrowshahi F, Kaka AP (2007). A decision support model for construction cash flow management. Computer-Aided Civil & Infrastructure Engineering 22(7):527–539.
[46]PUC (1995). Reglamento de normas contables y plan único de cuentas. Santa Fe de Bogotá, D.C.: ECOE Ediciones.
[47]Haenlein M, Kaplan AM (2004). A beginner’s guide to partial least squares analysis, Understanding Statistics 3(4):283–297.
[48]Carmines EG, Zeller RA (1979). Reliability and validity assessment. Sage University, Paper Series on Quantitative Applications in the Social Sciences. N. 07-017. Beverly Hills, CA: Sage.
[49]Fornell C, Larcker DF (1981). Evaluating Structural Equation Models with Unobservable Variables and Measurement Error, Journal of Marketing Research, 18:39–50.
[50]Henseler J, Ringle CM, Sarstedt M (2015). A new criterion for assessing discriminant validity in variance-based structurel equation modeling. Journal of the academy of marketing science 43(1):115–135.
[51]Little TD, Bovaird JA, Widaman KF (2006). On the merits of orthogonalizing powered and product terms: Implications for modeling interactions among latent variables. Structural Equation Modeling 13:497–519.
[52]Henseler J, Chin WW (2010). A comparison of approaches for the analysis of interaction effects between latent variables using partial least squares path modeling. Structural equation modeling 17:82–109.
[53]Cohen J (1988). Statistical power analysis for the behavioral sciences (2nd edn). Hillsdale, NJ: Lawrence Erlbaum Associates, Inc.
[54]Bedoya JH (2007). 10 conceptos sobre el flujo de caja libre. Retrieved from http://www.degerencia.com/articulo/10_conceptos_sobre_el_flujo_de_caja_libre, last accessed 201607-21.