
3
Behavioral segmentation methodology
3.1 An introduction to customer segmentation
Customer segmentation is the process of dividing customers into distinct, meaningful, and homogeneous subgroups based on various attributes and characteristics.
It is used as a differentiation strategic marketing tool. It enables organizations to understand the customers and build differentiated strategies, tailored to their characteristics.
There are various segmentation types according to the specific segmentation criteria used. Specifically, customers can be segmented according to their value, sociodemographical and life stage information, behavioral, needs/attitudinal, and loyalty characteristics. The type of segmentation to be used depends on the specific business objective. The following types of segmentation are widely used in consumer markets (Source: Tsiptsis and Chorianopoulos (2009). Reproduced with permission from Wiley).
- Value based: In value-based segmentation, customers are grouped according to their value. It is one of the most important segmentation types since it can be used for identifying the most valuable customers and for tracking value and value changes over time. It is also used for differentiating the service delivery strategies and for optimizing the allocation of resources in marketing initiatives.
- Behavioral: A very efficient and useful segmentation type. It is also widely used since it presents minimum difficulties in terms of data availability. The required data include product ownership and utilization data which are usually stored and available in the organization’s databases. Customers are divided according to their identified behavioral and usage patterns. This type of segmentation is typically used for developing customized product offering strategies, for new product development and design of loyalty schemes.
- Propensity based: In propensity-based segmentation, customers are grouped according to propensity scores, such as churn scores, cross selling scores, etc., which are estimated by respective classification (propensity) models. Propensity scores can also be combined with other segmentation schemes to better target marketing actions. For instance, the value at risk segmentation scheme is developed by combining churn propensities with value segments to prioritize retention actions.
- Loyalty based: Loyalty segmentation involves the investigation of the customers’ loyalty status and the identification of loyalty-based segments such as “loyal” and “migrator” segments. Retention actions can then be focused on high-value customers with a nonloyal profile while product offering on prospectively loyal customers.
- Sociodemographical: Reveals different customer groupings based on sociodemographical and/or life stage information such as age, income, and marital status. This type of segmentation is appropriate for promoting specific life stage-based products as well as supporting life stage marketing.
- Needs/attitudinal: This segmentation type is typically based on market research data and identifies customer segments according to their needs, wants, attitudes, preferences, and perceptions pertaining to the company’s services and products. It can be used for supporting new product development and for determining the brand image and the key product features to be communicated.
A detailed methodological approach for behavioral segmentation is presented in the following paragraphs.
3.2 An overview of the behavioral segmentation methodology
A segmentation project starts with the definition of the business objectives and ends with the delivery of differentiated marketing strategies for the segments. In this chapter, we’ll focus on behavioral segmentation and present a detailed methodological approach for the effective implementation of such projects. The proposed methodology for behavioral segmentation is based on the industry standard CRISP DM methodology, and it includes the following main phases.
- Business understanding and design of the segmentation process
- Data understanding, preparation, and enrichment
- Identification of the segments with cluster modeling
- Evaluation and profiling of the revealed segments
- Deployment of the segmentation solution, design, and delivery of differentiated strategies
The sequence of the phases is not strict. Lessons learned in each step may lead analysts to review previous steps. A roadmap of the segmentation procedure is presented in Table 3.1. The phases of the procedure are presented in detail in the following paragraphs.
Table 3.1 The behavioral segmentation methodology
| I. Business understanding and design of the segmentation process | II. Data understanding, preparation, and enrichment | III. Identification of the segments with cluster modeling | IV. Evaluation and profiling of the revealed segments: selecting the optimal cluster solution | V. Deployment of the segmentation solution: design and delivery of differentiated strategies |
| I.1. Understanding of the business situation, definition of the business objective | II.1. Investigation of data sources | III.1. Trying different models and parameter settings | IV.1. “Technical” evaluation of the clustering solution | V.1. Building the customer scoring model for updating the segments |
| I.2. Design of the modeling process | II.2. Selecting the data to be used | III.2. Proceed to a first rough evaluation of the derived clusters | IV.2. Profiling of the revealed segments | V.1.1. Using a Decision Tree for scoring: fine-tuning the segments |
| I.2.1. Selecting the segmentation population | II.3. Data integration and aggregation | IV.3. Using marketing research information to evaluate the clusters and enrich their profiles | V.2. Distribution of the segmentation information | |
| I.2.2. Selection of the segmentation dimensions | II.4. Data exploration, validation, and cleaning | IV.4. Selecting the optimal cluster solution and labeling the segments | V.3. Design and deliver of differentiated strategies | |
| I.2.3. Determination of the segmentation level | II.5. Data transformations and enrichment | |||
| I.2.4. Selecting the observation time window | II.6. Input set reduction |
3.3 Business understanding and design of the segmentation process
This phase starts with the understanding of the project requirements from a business perspective. It involves knowledge-sharing meetings and close collaboration between the data miners and the marketers involved in the project to assess the situation, clearly define the specific business goal, and design the whole data mining procedure. In this phase, some crucial questions must be answered, and decisions on some very important methodological issues should be drawn. Tasks of this phase include the following.
3.3.1 Definition of the business objective
| I. Business understanding and design of the process | I.1. Understanding of the business situation, definition of the business objective |
Following the understanding of the business situation, the business objective should be clearly set as it will define all the next steps of the behavioral segmentation procedure. Then it should be translated to a data mining goal. The translation of a marketing objective to a data mining goal is not always simple and straightforward. However, it is one of the most critical issues, since a possible misinterpretation can result in the failure of the entire data mining project.
It is very important for the analysts involved to explain from the beginning to everyone involved in the data mining project the anticipated final deliverables and to make sure that the relevant outcomes cover the initially set business requirements.
3.3.2 Design of the modeling process
| I. Business understanding and design of the process | I.2. Design of the modeling process |
In this phase, crucial decisions should be made, concerning, among other issues, the segmentation perimeter and level as well as the appropriate segmentation dimensions by which customers will be grouped.
3.3.2.1 Selecting the segmentation population
| I.2. Design of the modeling process | I.2.1. Selecting the segmentation population |
This task involves the selection of the customer population to be segmented. Most of the times, the organization will decide to focus on a specific core industry segment (e.g., corporate or retail customers) which needs further analysis and subsegmentation. Core segments, since they have inherent and apparent differences, are typically handled with separate segmentations.
Similarly, customers belonging in obvious segments, such as inactive customers, should be set apart and filtered out from the segmentation procedure in advance. Otherwise, the large differences between active and inactive customers may dominate the solution and inhibit the identification of the existing differences between active customers.
If the size of the selected population is large, a representative sample could be selected and used for the model training. In that case though, a deployment procedure should be designed, for instance, through the development of a relevant classification model, that will enable the scoring of the entire customer base.
3.3.2.2 Selection of the appropriate segmentation criteria
| I.2. Design of the modeling process | I.2.2. Selecting the segmentation dimensions |
One of the key questions to be answered before starting the behavioral segmentation is what attributes should be used for customer grouping. The selection of the appropriate segmentation dimensions depends on the specific business issue that the segmentation model is about to address. The business needs imply, if not impose, the appropriate inputs. Usually, people with domain knowledge and experience can provide a suggestion on the key attribute entities related with the business goal of the analysis. All relevant customer attributes should be identified, selected, and included in the segmentation process. Information not directly related with the behavioral aspects of interest should be omitted.
For instance, if a mobile telephony operator wants to group its customers according to their use of services, all relevant fields, such as the number and volume/minutes of calls by call type, should be included in the analysis. On the contrary, customer information related with other aspects of customer behavior, such as payment behavior or revenue information, should be excluded from the segmentation.
3.3.2.3 Determining the segmentation level
| I.2. Design of the modeling process | I.2.3. Determination of the segmentation level |
The segmentation level defines what groupings are about to be revealed, for instance, groups of customers, groups of telephone lines (MSISDNs in mobile telephony), etc. The selection of the appropriate segmentation level depends on the subsequent marketing activities that the segments are about to support. It also determines the granularity level of the training dataset that will be built for modeling purposes.
3.3.2.4 Selecting the observation window
| I.2. Design of the modeling process | I.2.4. Selecting the observation window |
The goal of the segmentation is usually to outline stable and current behaviors, avoiding inconsistent usage patterns. A “narrow” observation period based on a data snapshot of a few days or even weeks might just capture a random twist in the customer’s behavior. Since the objective is to develop a segmentation scheme that would reflect typical behaviors, the observation period must be “wide” enough to avoid behavioral fluctuations but on the other hand not too “wide” to also take into account outdated behaviors.
A general recommendation is to use an observation period of at least 6 months and up to 12 months (especially if we want to take into account yearly, seasonal events).
3.4 Data understanding, preparation, and enrichment
The investigation and the assessment of the available data sources are followed by data acquisition, integration, and processing for the needs of segmentation modeling. The data understanding and preparation phase is probably the most time-consuming phase of the project. Its steps are presented in detail in the following paragraphs.
3.4.1 Investigation of data sources
| II. Data understanding, preparation, and enrichment | II.1. Investigation of data sources |
The available data sources should be evaluated in terms of accessibility and validity. This phase also includes initial data collection and exploration in order to understand the available data.
3.4.2 Selecting the data to be used
| II. Data understanding, preparation, and enrichment | II.2. Selecting the data to be used |
The next step of the procedure involves the definition of the data to be used for the needs of the analysis.
The selected data should cover all the segmentation dimensions as all the additional customer information that will be used for profiling the revealed segments.
Cluster inputs can be numeric as well as categorical. The categorical inputs are handled by the cluster algorithms with appropriate distance measures or internal preprocessing encoding. However, in behavioral segmentation, a general recommendation is to avoid using inputs of mixed scale in the same model as categorical inputs can be overweighted in the formation of the clusters.
Likewise, demographical variables should be avoided in behavioral segmentation projects. Mixing behavioral and demographical information may result in unclear and ambiguous behavioral segments since two customers with identical demographical profile may have completely different behaviors.
For example, imagine the case of a father that has activated a mobile phone line for his teenage son. In a behavioral segmentation, based only on behavioral data, this line would most likely be assigned to the “young—SMS users” segment, along with other teenagers and young techno-fun users. Therefore, we might expect some ambiguities when trying to examine the demographical profile of the segments. In fact, this hypothetical example also outlines why the usage of demographical inputs should be avoided when the main objective is behavioral separation.
Only variables relevant with the specific business objective should be included in the model. Mixing all available attributes in an attempt to build a “silver-bullet” total segmentation that will cover all the aspects of a customer relationship with the organization (e.g., usage and payment behavior) usually leads to unclear segments with poor actionability. It is suggested to develop different segmentation schemes independently and then combine them to build differentiated marketing strategies.
3.4.3 Data integration and aggregation
| II. Data understanding, preparation, and enrichment | II.3. Data integration and aggregation |
The initial raw data should be consolidated for the creation of the final modeling dataset that will be used for the identification of the segments. This task typically includes the collection, filtering, merging, and aggregation of the raw data based on the modeling process designed.
For behavioral segmentation applications, a recent “view” of the customers’ behavior should be constructed and used. This “view” should summarize the behavior of each customer by using at least 6 months of observation data.
As outlined previously, the aggregation level of the modeling dataset should correspond to the wanted segmentation level. If the goal, for instance, is to segment bank customers, then the final dataset should be at a customer level. If the goal is to segment telephone lines (MSISDNs), the final dataset should be at a line level. To put it in a simple way, clustering techniques reveal natural groupings of records. So no matter where we start from, the goal is the construction of a final, one-dimensional, flat table, which summarizes behaviors at the selected granularity.
This phase is concluded with the retrieval and consolidation of data from multiple data sources (ideally from the organization’s mining datamart and/or Marketing Customer Information File) and the construction of the modeling dataset.
3.4.4 Data exploration, validation, and cleaning
| II. Data understanding, preparation, and enrichment | II.4. Data exploration, validation, and cleaning |
A critical issue for the success of any data mining project is the validity of the used data. The data exploration and validation process includes the use of simple descriptive statistics and charts for the identification of inconsistencies, errors, missing values, and outlier (abnormal) cases. Outliers are cases that do not conform to the patterns of “normal” data. Various statistical techniques can be used in order to fill in (impute) missing or outlier values.
Outlier cases in particular require extra caution. Outliers are records with extreme values and unusual data patterns. They can be singled out by examining data through simple descriptive statistics or specialized algorithms. Outliers deserve special investigation as in many cases they are what we are looking for: exceptionally good customers or, at the other end, fraudulent cases. But they may have a negative impact on clustering models.
They can misguide the clustering algorithm and lead to poor and distorted results. In many cases, the differences between “outlier” and “normal” data patterns are so large that they may mask true differences among the majority of the “normal” cases. As a result, the algorithm can be misled to a poor solution that merely separates outliers. Consequently, the clustering model may come up with a poor solution consisting of one large cluster of “normal” behaviors and many very small clusters representing the unusual data patterns. This analysis may be useful, for instance, in fraud detection, but certainly, it is not appropriate in the case of general purpose segmentation. A recommended approach for an enriched general purpose solution would be to identify and exclude outliers in advance. Another approach could be to run an initial clustering solution, identify small outlier clusters, and then rerun and fine-tune the analysis after excluding the outlier clusters.
3.4.5 Data transformations and enrichment
| II. Data understanding, preparation, and enrichment | II.5. Data transformations and enrichment |
This phase deals with the transformation and enrichment of the modeling dataset.
A significant data preparation step in segmentation models is the standardization (normalization) of the inputs so that their values are in similar scales. Quite often, the cluster inputs are measured in different scales. Since clustering models take into account the differences between records, the differences in the measurement scales can lead to biased clustering solutions simply because some fields might be measured in larger values. Fields measured in larger values have increased variability. If used in their original scale, they will dominate the cluster solution. Thus, a standardization process is necessary in order to bring fields to comparable scales and ensure that fields with larger values do not determine the solution.
The two most common standardization methods include the z-score and the 0–1 (or min–max or range) approaches. In the z-score approach, the standardized field is created as below:
The derived field has a mean of 0 and a standard deviation of 1.
The min–max (typically 0–1) approach rescales all values in the specified range as follows:
By the term data enrichment, we refer to the construction of informative indicators, key performance indicators (KPIs), based on the original inputs. The original inputs are combined, and functions such as ratios, percentages, and averages are applied to derive fields which better summarize the customer behavior and convey the differentiating characteristics of each customer.
This is a critical step that heavily depends on the expertise, experience, and business “imagination” of the project team since the construction of an informative list of inputs can lead to richer and more refined segmentations.
3.4.6 Input set reduction
| II. Data understanding, preparation, and enrichment | II.6. Input set reduction |
The data preparation stage is typically concluded with the application of an unsupervised data reduction technique such as PCA/Factor Analysis. These techniques reduce the dimensionality of the inputs by effectively replacing a typically large number of original inputs with a relatively small number of compound scores, called factors or principal components. They identify the underlying data dimensions by which the customers will be segmented. The derived scores are then used as inputs in the clustering model that follows. The advantages of using a data reduction technique as a data preprocessing step include:
- Simplicity and conceptual clarity. The derived scores are relatively few, interpreted, and labeled. They can be used for cluster profiling to provide the first insight on the segments.
- Standardization of the clustering inputs, a feature important in order to yield an unbiased solution.
- Ensuring that all the data dimensions contribute equally to the formation of the segments.
3.5 Identification of the segments with cluster modeling
| III. Classification modeling | III.1. Trying different models and parameter settings |
Customers are divided into distinct segments by using cluster analysis. The clustering fields, typically the component scores, are fed as inputs in a cluster model which assesses the similarities between the records/customers and suggests a way of grouping them. Data miners should try a test approach and explore different combinations of inputs, different models, and model settings before selecting the final segmentation scheme.
Different clustering models will most likely produce different segments, and this should not come as a surprise. Expecting a unique and definitive solution is a sure recipe for disappointment. Usually, the results of different algorithms are not identical but similar. They seem to converge to some common segments. Analysts should evaluate the agreement level of the different models and examine in which aspects disagree. In general, a high agreement level between many different cluster models is a good sign for the existence of discern groupings.
3.6 Evaluation and profiling of the revealed segments
In this phase, the modeling results are evaluated, and the segmentation scheme that best addresses the needs of the organization is selected for deployment. Data miners should not trust blindly the solution suggested by one algorithm. They should explore different solutions and always seek guidance from the marketers for the selection of the most effective segmentation. After all, they are the ones who will use the results for segmented marketing, and their opinion on the future benefits of each solution is critical. The selected solution should provide distinct and meaningful clusters that can provide profit opportunities. Tasks of this phase include the following.
3.6.1 “Technical” evaluation of the clustering solution
| IV. Evaluation and profiling of the revealed segments | IV.1. “Technical” evaluation of the clustering solution |
The internal cohesion and the separation of the clusters should be assessed with the use of descriptive statistics and specialized technical measures (such as standard deviations, interclass and intraclass distances, Silhouette coefficient, etc.). Additionally, data miners should also examine the distribution of the customers in the revealed clusters as well as the consistency of the results in different datasets. All these tests assess the segmentation solution in terms of “technical” adequacy. Additionally, the segments should also be assessed from a business perspective in terms of actionability and potential benefits. To facilitate this evaluation, a thorough profiling of the segments’ characteristics is needed.
Analysts should examine and evaluate the revealed cluster solution and assess, among others, the number and the relative size of the clusters and their cohesion and separation. A good clustering solution contains tightly cohesive and highly separated clusters. More specifically, the solution, through the use of descriptive statistics and specialized measures, should be examined in terms of:
- The number of clusters and the size of each cluster
The cluster examination normally begins by looking at the number of revealed clusters. In general purpose clustering, analysts typically expect a rich but manageable number of clusters. Analysts should look at the number of records assigned to each cluster. A large, dominating cluster which concentrates most of the records may indicate the need of further segmentation. On the other end, a small cluster with few records merits special attention. If considered as an outlier cluster, it could be set apart from the overall clustering solution and studied separately.
- Cohesion of the clusters
A good clustering solution is expected to be comprised of dense concentrations of records around their centroids. Large dispersion values indicate nonhomogeneous groupings and suggest further partitioning of the dataset. A number of useful statistics can be calculated to summarize the concentration and the level of internal cohesion of the revealed clusters such as:
- Standard deviations and pooled standard deviations of the clustering fields. Data miners should start by examining the standard deviations of the clustering fields for each cluster, hoping for small values which indicate a small degree of dispersion. The pooled standard deviation of a clustering field is the weighted (according to each cluster’s size) average of the individual standard deviations for all clusters. Once again, we anticipate low variability and small values which denote increased cohesion.
- Maximum (Euclidean) distance from the cluster center (centroid). Another statistic that summarizes the degree of concentration of each cluster is the maximum distance from the cluster center, the cluster radius. In a way, it represents the range of each cluster since it denotes how far apart lies the remotest member of the cluster.
- Analysts should also evaluate the within-cluster distances (within-cluster variation): the distances between the members of a cluster and their cluster centroid. They could average these distances over all members of a cluster and look for clusters with disproportionately large average distances. These clusters are candidate for further segmentation. A technical cluster cohesion measure which is based on the (squared Euclidean) distances between the data points and their centroids is the sum of squares error (SSE). In order to compare between models, we can use the average SSE calculated as follows:where
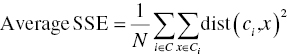
 is the centroid of cluster i,
  a data point/record of cluster i, and N the total cases. A solution with smaller SSE is preferred.
- Separation of the clusters
Analysts also hope for well-separated (well-spaced) clusters.
A good way to quantify the cluster separation is by constructing a proximity matrix with the distances between the cluster centroids. The minimum distance between clusters should be identified and assessed since this distance may indicate similar clusters that may be merged.
Analysts may also examine a separation measure named sum of squares between (SSB) which is based on the (squared Euclidean) distances of each cluster’s centroid to the overall centroid of the whole population. In order to compare between models, we can use the average SSB calculated as follows:
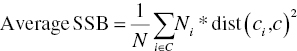
where
 is the centroid of cluster i,
  the coverall centroid, N the total cases, and Ni the number of cases in cluster i. The SSB measures the between-cluster distances. The higher the SSB, the more separated the derived clusters are.
A combined measure that assesses both the internal cohesion and the external separation of a clustering solution is the Silhouette coefficient which is calculated as follows:
- For each record i in a cluster, we calculate a(i) as the average (Euclidean) distance to all other records in the same cluster. This value indicates how well a specific record fits a cluster. To simplify its computation, a(i) calculation may be modified to record the (Euclidean) distance of a record from its cluster centroid.
- For each record i and for each cluster not containing i as a member, we calculate the average (Euclidean) distance of the record to all the members of the neighboring cluster. After doing this for all clusters that i is not a member of, we calculate b(i) as the minimum such distance in terms of all clusters. Once again to ease computations, the b(i) calculation can be modified to denote the minimum distance between a record and the centroid of every other cluster.
- The Silhouette coefficient for the record i is defined as
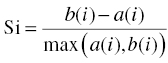
The Silhouette coefficient varies between −1 and 1. Analysts hope for positive coefficient values, ideally close to 1, as this would indicate a(i) values close to 0 and perfect internal homogeneity.
- By averaging over the cases of a cluster, we can calculate its average Silhouette coefficient. The overall Silhouette coefficient is a measure of the goodness of the clustering solution, and it can be calculated by taking the average over all records/data points. An average Silhouette coefficient greater than 0.5 indicates adequate partitioning, whereas a coefficient less than 0.2 denotes a problematic solution.
Other popular cluster performance measures include the Akaike Information Criterion (AIC) and the Bayesian Information Criterion (BIC). The BIC measure is also used by Modeler’s TwoStep algorithm for determining the optimal number of clusters. It assesses the goodness of fit of the solution, that is, how well the specific data are fit by the number of clusters.
Technical measures like the ones presented in this paragraph are useful, but analysts should also try to understand the characteristics of each cluster. The understanding of the clusters through profiling is required to take full advantage of them in subsequent marketing activities. Moreover, it is also a required evaluation step before accepting the solution. This process is presented in the next paragraph.
3.6.2 Profiling of the revealed segments
| IV. Evaluation and profiling of the revealed segments | IV.2. Profiling of the revealed segments |
A profiling phase is typically needed in order to fully interpret the revealed segments and gain insight on their structure and defining characteristics. Profiling supports the business evaluation of the segments as well as the subsequent development of effective marketing strategies tailored for each segment.
Segments should be profiled by using all available fields as well as external information. Derived clusters should be interpreted and labeled according to their differentiating characteristics, and consequently, the profiling phase inevitably includes going back to the inputs and determining the uniqueness of each cluster in respect to the clustering fields.
The description of the extracted segments typically starts with the examination of the centroids’ table. A cluster centroid is defined by simply averaging all the input fields over all cluster members. The centroid can be thought of as the prototype or the most typical representative member of a cluster. Cluster centers for the simple case of two clustering fields and two derived clusters are depicted in Figure 3.17.
Figure 3.17 Graphical representation of the cluster centers or centroids
In the general case of M clustering fields and N-derived clusters, the table summarizing the cluster centers would have the form of Table 3.2.
Table 3.2 The table of cluster centers
| Cluster 1 | Cluster 2 | … Cluster N | Overall population: all clusters | |
| Clustering field 1 | Mean (1,1) | Mean (1,2) | Mean (1,N) | Mean (1) |
| Clustering field 2 | Mean (2,1) | Mean (2,2) | Mean (2,N) | Mean (2) |
| … | … | … | … | … |
| Clustering field M | Mean (M,1) | Mean (M,2) | Mean (M,N) | Mean (M) |
Analysts should individually check each cluster and compare the means of the input attributes with the grand means, looking for significant deviations from the “overall”/the “typical” behavior. Therefore, they should search for clustering fields with relatively low or high mean values in a cluster.
The profiling phase should also examine the clusters in respect to “external” fields, not directly participated in the cluster formation, including KPIs and demographical information of interest. Normally, the cluster separation is not only limited to the clustering fields, but it is also reflected in other attributes. Therefore, data miners should also describe the clusters by using all important attributes, regardless of their involvement in the cluster building, to fully portray the structure of each cluster and identify the features that best characterize them.
This profiling typically involves the examination of the distribution of continuous profiling fields across clusters. Profiling attributes can be normalized (standardized) in order to diminish the measurement scale differences and more clearly portray the structure of the clusters. For categorical attributes, the procedure would be analogous, involving comparisons of counts and percentages. The scope again is to uncover the cluster differentiation in terms of the categorical fields.
Finally, classification models can augment the reporting and visualization tools in the profiling of the segments. The model should be built with the cluster membership field as the target and the profiling fields of interest as inputs. Decision Trees in particular due to the intuitive format of their results are typically used to describe the segment profiles.
3.6.3 Using marketing research information to evaluate the clusters and enrich their profiles
| IV. Evaluation and profiling of the revealed segments | IV.3. Using marketing research information to evaluate the clusters and enrich their profiles |
Marketing research surveys are typically used to investigate the needs, preferences, opinions, lifestyles, perceptions, and attitudes of the customers. They are also commonly used in order to collect valid and updated demographical information. It is strongly recommended to combine the data mining-driven behavioral segments with market research-driven demographical and needs/attitudinal segments. While each approach helps in the understanding of certain aspects of the customers, combining them provides deeper insight on different customer typologies.
For instance, provided a behavioral data mining segmentation has been implemented, random samples can be extracted from each segment, and through surveys and/or qualitative research and focus group sessions, valuable insight can be gained concerning each segment’s needs and preferences. Alternatively, the data mining and the market research approaches can be implemented independently and then cross-examined, not only as a mean for evaluating the solutions but also in order to construct a combined and integrated segmentation scheme which would provide a complete view of the customers.
In conclusion, combining data mining and market research techniques for customer segmentation can enable refined subsequent marketing strategies, based on thorough understanding of customer behavior and needs, as shown in the Figure 3.25.
Figure 3.25 Combining data mining and market research-driven segmentations.
Source: Tsiptsis and Chorianopoulos (2009). Reproduced with permission from Wiley
Consider customers belonging to the same behavioral segment but having diverse needs and perceptions. This information can lead to tailored marketing strategies within each behavioral segment.
3.6.4 Selecting the optimal cluster solution and labeling the segments
| IV. Evaluation and profiling of the revealed segments | IV.4. Selecting the optimal cluster solution and labeling the segments |
Although all the aforementioned evaluation measures make mathematical sense and they can provide valuable help in the identification of the optimal solution, data miners should not solely base their decision on them. Many algorithms, such as Modeler’s TwoStep cluster, Excel’s clustering, and RapidMiner’s X-means, automatically propose an optimal number of clusters based on technical measures and heuristics. Once again, these proposed solutions should not be blindly accepted. A clustering solution is justified only if it makes sense from a business point of view. Actionability, potential business value, interpretability, and easiness of use are factors hard to quantify and, in a way, subjectively measured. However, they are the best benchmarks for determining the optimal clustering solution. The profiling of the clusters and the identification of their defining characteristics are an essential part of the clustering procedure. It should not be considered as a postanalysis task but rather as an essential step for assessing the effectiveness of the solution.
As with every data mining model, data miners should try many different clustering techniques and compare the similarity of the derived solutions before deciding on the one to choose. Different techniques that generate analogous results are a good sign for the identification of a general and valid solution. As in any other data mining model, clustering results should also be validated by applying the model in a disjoint dataset and by examining the consistency of the results.
The profiling and interpretation process ends with the labeling of the identified segments with names that appropriately designate their unique characteristics. Each segment is assigned an informative and revealing name, for instance, “Business Travelers,” instead of “Segment 1.” The naming of the segments should take into account all the profiling findings. These names will be used for communicating the segments to all business users and for loading them to the organization’s operational systems.
3.7 Deployment of the segmentation solution, design and delivery of differentiated strategies
The segmentation project is concluded with the deployment of the segmentation solution and its usage for the development of differentiated marketing strategies and segmented marketing.
3.7.1 Building the customer scoring model for updating the segments
| V. Deployment of the segmentation solution: design and delivery of differentiated strategies | V.1. Building the customer scoring model for updating the segments |
The deployment procedure should enable the customer scoring and update of the segments. It should be automated and scheduled to run on a frequent base to enable the monitoring of the customer base evolvement over time and the tracking of the segment migrations. Moreover, as nowadays markets change very rapidly, it is evident that a segmentation scheme can become outdated within a short time. Refreshment of such schemes should be made quite often. That’s why the developed procedure should also take into account the need of possible future revisions.
3.7.1.1 Building a Decision Tree for scoring: fine-tuning the segments
| V.1. Building the customer scoring model for updating the segments | V.1.1. Building a Decision Tree for scoring: fine-tuning the segments |
Decision Trees can also be used for scoring and assigning customers to the identified clusters. They can translate the differentiating characteristics of each cluster into a set of simple and understandable rules which can subsequently be applied for classifying new records in the revealed clusters. Each tree’s terminal node corresponds to assignment to a specific cluster with an estimated probability. Although this approach also introduces an additional source of estimation errors, it is also a more transparent approach for cluster updating. It is based on understandable, model-driven rules, similar to common business rules, which can more easily be examined and communicated. Additionally, business users can more easily intervene and, if required, modify these rules and fine-tune them according to their business expertise.
3.7.2 Distribution of the segmentation information
| V. Deployment of the segmentation solution: design and delivery of differentiated strategies | V.2. Distribution of the segmentation information |
Finally, the deployment procedure should also enable the distribution of the segmentation information throughout the enterprise and its “operationalization.” Therefore, it should cover the upload of the segmentation information in the organization’s databases and CRM tools in order to enable customized strategies to be applied across all customers’ touch points.
3.7.3 Design and delivery of differentiated strategies
| V. Deployment of the segmentation solution: design and delivery of differentiated strategies | V.3. Design and deliver of differentiated strategies |
In order to make the most of the segmentation, specialization is needed. Thus, it is recommended to assign the management of each segment to a specific team. Each team should build and deliver specialized marketing strategies tailored to the segment’s needs, in order to improve the customer handling, develop the relationship with the customers, and grow the profitability of each segment. The responsibilities of the team should also include the tracking of each segment with appropriate KPIs and the monitoring of the competitors’ activities for each segment.
3.8 Summary
Customer segmentation is the process of identifying groups that have common characteristics. The main objective of customer segmentation is to understand the customer base and gain customer insight that will enable the design and development of differentiated marketing strategies.
Clustering is a way to identify segments and assign customers into groups not known in advance. The identification of the segments should be followed by the profiling of the revealed customer groupings. The detailed profiling is necessary for understanding and labeling the segments based on the common characteristics of their members.
The decision for the optimal segments should be supported by technical measures of the “separation” of the records; however, it should not solely depend on them. The segmentation scheme is the tool for delivering personalized customer handling. Therefore, the identified segments should be clear and explicable. They should correspond to “actual” and distinct customer typologies in order to enable the passing from mass to personalized marketing.