
4 A scientometric analysis of demand forecasting (1975–2015)
A visual description
Citation is usually considered as a way of showing how researchers construct the future research based on existing research, and the count of citations is largely an indication of influence of some specific studies. Thus, the citations and the analysis based on citations are important to review the existing research and outline the shape and patterns for the future research focuses. In this chapter, we investigate highly cited articles in demand forecasting research literature during the 1975–2015 period, with the bibliographic records from the Web of Science. The main objective of this chapter is to analyze and identify the key research fields, the most cited articles and the trends for the future research.
To achieve these objectives, we present a scientometric analysis for demand forecasting research with CiteSpace, which is scientometric analysis software mainly used to generate and analyze networks of co-cited references based on bibliographic records (Chen, 2006). With this tool, the thematic patterns, landmark articles and emerging trends for future demand forecasting research are computationally detected and visually represented. The study and results of this chapter can provide researchers with a general guide for the future research trend.
This chapter is organized as follows: section 4.1 briefly describes the demand forecasting research status and the main purposes of this chapter, and provides a simple introduction of scientometrics; section 4.2 presents an overview of the bibliography of demand forecasting research; then section 4.3 describes the evolution of demand forecasting research with our method and section 4.4 draws several conclusions.
4.1 Introduction
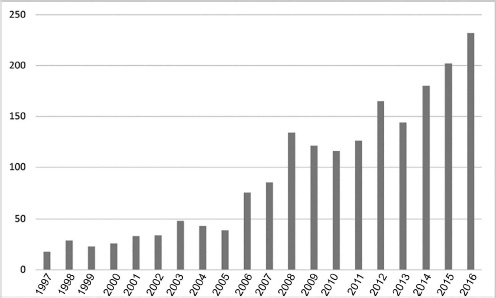
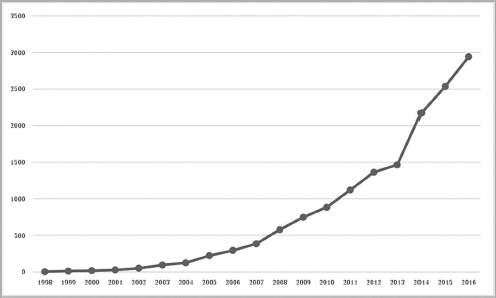
With the intensification of market competition and rapid market changes, demand forecasting has become increasingly critical for various decision-making processes in business management. In the past few decades, numerous studies have discussed various issues about demand forecasting in different industries. And the number of academic papers published on this subject continues to grow these years. Figure 4.1 and Figure 4.2 are generated based on the results of an article search on Web of Science with relevant keywords. As the number of yearly published articles (see Figure 4.1) shows, demand forecasting is not a new discipline in the literature; and the number of published articles on demand forecasting research has shown a substantial and steady increase over the years. Note that the number of yearly published articles remained at a low level until the beginning of the 21st century, and an average of about 150 articles have been published per year in recent years. The yearly total citations in the Web of Science (see Figure 4.2) also demonstrate a similar trend of rapid growth during the latest decade. One possible reason for this development trend could be the significant proliferation of the use of complex forecasting models and techniques, and this is mainly due to the increased availability of the powerful computer systems and, in particular, the wide use of the personal computers.
In view of the increasingly rapid growth of total numbers of both the publications and the citations, it is necessary and meaningful to demonstrate a comprehensive review of the demand forecasting research and to explore its future research trends. In the literature of demand forecasting literature, there are only several review articles about demand forecasting for specific industries. For example, Donkor et al. (2012) reviewed the related literature on urban water demand forecasting, to identify the main forecasting methods and forecasting models useful for specific water utility decision-making problems, and they discussed the models for different forecasting variables, various periodicities of the historical data and different forecast time horizons required. Song and Li (2008) reviewed research articles published on tourism demand modeling and forecasting since the year 2000, while Suganthi and Samuel (2012) focused on the model selection and construction of energy demand forecasting. In addition, Hernández et al. (2014) discussed the most relevant studies on electricity demand prediction over the last 40 years, presenting the popular forecasting models used as well as the future trends. However, there is no article describing the whole academic landscape of demand forecasting research, and identifying the main thematic patterns, landmark articles and emerging trends for future demand forecasting research. To achieve these research analysis goals, we implement a scientometric analysis of demand forecasting research in this chapter.
Scientometrics, a discipline aiming at measuring and analyzing science, technology and innovation, is mainly about understanding the scientific citations, assessing the impact of specific journals and articles and investigating the future research trends. Although there are many methods in literature to study a scientific activity and phenomenon, the scientometric analysis is trusted and proven as a well-performing means for achieving these analysis goals. Scientometrics is mostly developed based on the work of Derek J. de Solla Price and Eugene Garfield. Eugene Garfield created the Science Citation Index, which is considered as the basis of the scientometrics and used widely by researchers when implementing a scientometric analysis. Compared with the sociology of science, which mainly focuses on the behavior of the scientists, a scientometric analysis focuses mostly on the analysis of publications and citations, to explore the basic research patterns and future research trends. Hence, scientometrics can also be referred to as an empirical study of the related references and citations within a specific discipline. The main research focuses of these scientometrics studies include journal rankings (e.g., Lowry et al., 2004; Lowry et al., 2013; Lowry et al., 2007a), establishing the faculty productivity and tenure standards (e.g., Dean et al., 2011), assessing the influence of top articles (e.g., Karuga et al., 2007) and developing profiles for researchers and institutions based on their research performance (e.g., Lowry et al., 2007b).
Common methods for a scientometric analysis can be classified into three groups, i.e., qualitative, quantitative and computational approaches. With the development of computer systems and the popularization of personal computers, the computational approaches become particularly popular for a scientometric analysis. In this chapter, we computationally study the features of demand forecasting research with a computational approach implemented in CiteSpace (Chen, 2006), which is a visual analytic system for illustrating emerging trends and critical changes in a specific scientific literature (Chen et al., 2012; Chen et al., 2014; Kim and Chen, 2015). In this chapter, the input for CiteSpace, i.e., the bibliographic records in demand forecasting literature, is collected from the Web of Science from the period of 1975–2015, where the Web of Science database is considered as the most authoritative database for a scientometric analysis and used for research performance evaluation by institutions and researchers from various countries.
In a scientometric analysis with CiteSpace, a citation is the basic entity from which a series of conclusions are derived. Generally, a citation can be defined as a reference to an academic article, a book, a dissertation or any other published items. And from a citation, we can find out some clues about how researchers construct their advanced studies based on the existing research, and a citation ranking is usually used to evaluate the scientific research popularity and quality. The basic assumption behind this utilization is that citation is a researchers’ behavior of giving credit to the value, impact and significance of an article or a work (e.g., Zheng et al., 2011). Articles with a relatively high citation rate are usually believed to be of a high quality, and an article which is cited frequently often represents a recent research focus.
The present study in this chapter differs from previous demand forecasting studies in terms of research scope to research method. In this chapter, we aim to investigate the whole landscape of the present demand forecasting research. In order to achieve both goals, this study applies the scientometric analysis to demand forecasting literature with the computational approach implemented in CiteSpace.
4.2 An overview of the bibliography
4.2.1 Bibliographic records collection
The definition of the term ‘demand forecasting’ is intuitive and there is a consensus for it. Hence, in the search process, we mainly focus on such key terms as ‘demand forecast’ and ‘demand predict’, where ‘predict’ is considered the same as ‘forecast’ in this chapter.
The Web of Science electronic database is used to get historical bibliographic records published in demand forecasting research fields for the period of 1975–2015. Because the number of sources in the relevant literature has increased rapidly in recent decades, this chapter only reviews papers and articles published before Nov. 2015. There are 19,475 articles published during this period in total based on a search in topic based on the key terms ‘demand forecast’ and ‘demand predict’, from Science Citation Index Expanded (SCI-EXPANDED) and Social Sciences Citation Index (SSCI) of the Web of ScienceTM Core Collection. To make the literature more relevant and explicit with our research interests and objectives, we limited the search key terms ‘demand forecast’ and ‘demand predict’ within article titles, which finally resulted in a bibliography of 1,141 articles. Thus, the 1,141 articles do not include the relevant publications if the search terms ‘demand forecast’ or ‘demand predict’ do not explicitly appear in the title.
4.2.2 Disciplines involved in demand forecasting research
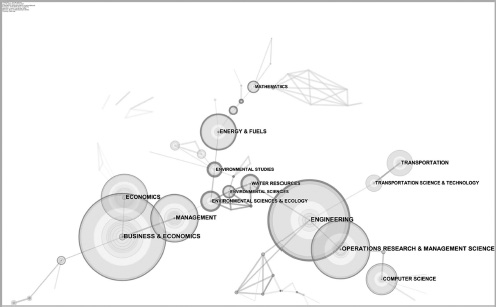
Demand forecasting is a vital and common issue in business management. Thus, it is investigated and discussed in a wide range of disciplines. Each article indexed by the Web of Science is assigned to one or more disciplines. Figure 4.3 shows a co-occurrence network for those disciplines, after being simplified by Pathfinder network scaling, which retains the most salient connections. The node size denotes the frequency of the corresponding disciplines in demand forecasting literature (Table 4.1); and CiteSpace highlights nodes with high betweenness centrality with purple trims. The thickness of a purple trim indicates how strong its betweenness centrality is, and the thicker the stronger.
As Figure 4.3 shows, the most common discipline for demand forecasting research is Engineering, followed by Business & Economics and Operations Research & Management Science. The top 10 disciplines with highest frequency are listed in Table 4.1. The percentages listed in the third column indicate that the majority of studies focused on the top three disciplines.
|
Discipline |
Frequency |
Percentage (%) |
|---|---|---|
|
Engineering |
438 |
38.387 |
|
Business & Economics |
309 |
27.082 |
|
Operations Research & Management Science |
202 |
17.704 |
|
Energy & Fuels |
127 |
11.131 |
|
Computer Science |
117 |
10.254 |
|
Environmental Sciences & Ecology |
93 |
8.151 |
|
Transportation |
93 |
8.151 |
|
Water resources |
66 |
5.784 |
|
Mathematics |
45 |
3.944 |
|
Social Sciences other topics |
41 |
3.593 |
4.2.3 Main keywords in demand forecasting research
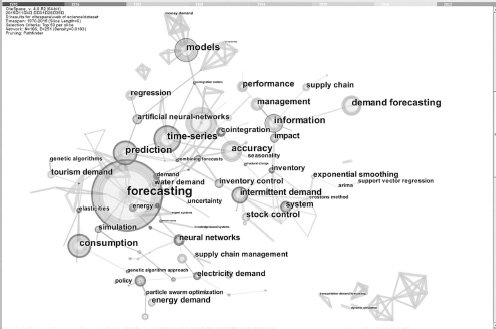
Keywords usually represent what an academic article is about and interested in. Figure 4.4 shows the co-occurrence network of the keywords in demand forecasting research. The co-occurrence network of keywords can to some extent provide a wholesome landscape of the research status. According to Figure 4.4, we can conclude that demand forecasting research is usually connected with the ‘management’ problems, such as an ‘inventory control’ problem and a ‘policy’ making problem. Common forecasting models and methods applied in the demand forecasting research include the ‘time-series’ models, the ‘regression’ models and artificial intelligence models such as the ‘genetic algorithms’, ‘neural networks’ and ‘support vector regression’, etc. Specifically, ‘tourism demand’, ‘water demand’ and ‘energy demand’ and ‘intermittent demand’ have received relatively more attention in the demand forecasting literature.
4.2.4 Most cited articles in demand forecasting literature
Table 4.2 and Table 4.3 jointly list the most cited articles out of the 1,141 articles in the Web of Science database and the corresponding journals. Table 4.2 lists the top 10 articles according to their total citations in the Web of Science database since the year of their publication; and Table 4.3 lists the top 10 articles according to their average citations per year.
|
Total citations |
Title |
Year |
Journal |
|---|---|---|---|
|
330 |
Using the job demands-resources model to predict burnout and performance |
2004 |
Human Resource Management |
|
309 |
Contracting to assure supply: How to share demand forecasts in a supply chain |
2001 |
Management Science |
|
183 |
Forecasting and stock control for intermittent demands |
1972 |
Operational Research Quarterly |
|
159 |
How (in) accurate are demand forecasts in public works project? The case of transportation |
2005 |
Journal of the American Planning Association |
|
119 |
Applications of improved grey prediction model for power demand forecasting |
2003 |
Energy Conversion and Management |
|
113 |
Grey prediction with rolling mechanism for electricity demand forecasting of Turkey |
2007 |
Energy |
|
109 |
Forecasting the short-term demand for electricity – Do neural networks stand a better chance? |
2000 |
International Journal |
|
104 |
ARIMA forecasting of primary energy demand by fuel in Turkey |
2007 |
Energy Policy |
|
99 |
Modeling the evolution of demand forecasts with application to safety stock analysis in production distribution systems |
1994 |
IEE Transactions |
|
97 |
Short-term electricity demand forecasting using double seasonal exponential smoothing |
2003 |
Journal of the Operational Research Society |
|
Average citations per year |
Title |
Year |
Journal |
|---|---|---|---|
|
27.5 |
Using the job demands-resources model to predict burnout and performance |
2004 |
Human Resource Management |
|
20.6 |
Contracting to assure supply: How to share demand forecasts in a supply chain |
2001 |
Management Science |
|
14.45 |
How (in) accurate are demand forecasts in public works project? The case of transportation |
2005 |
Journal of the American Planning Association |
|
12.56 |
Grey prediction with rolling mechanism for electricity demand forecasting of Turkey |
2007 |
Energy |
|
11.56 |
ARIMA forecasting of primary energy demand by fuel in Turkey |
2007 |
Energy Policy |
|
9.33 |
Support vector regression with genetic algorithms in forecasting tourism demand |
2007 |
Tourism Management |
|
9.15 |
Applications of improved grey prediction model for power demand forecasting |
2003 |
Energy Conversion and Management |
|
9 |
A comparison of univariate methods for forecasting electricity demand up to a day ahead |
2006 |
International Journal of Forecasting |
|
8.6 |
A trigonometric grey prediction approach to forecasting electricity demand |
2006 |
Energy |
|
8.5 |
Forecasting next-day electricity demand and price using non-parametric functional methods |
2012 |
International Journal of Electrical Power & Energy Systems |
4.3 The evolution of demand forecasting research
In a scientometric analysis, the intellectual landscape of a research field is usually described through a specific network involving entities such as the cited references, the collaborating authors, co-occurring categories and so on (Chen et al., 2014). This subsection mainly focuses on the co-citation networks of cited references in these demand forecasting articles to explore the past, present and future trends for demand forecasting research. In addition, we also describe other types of networks generated by CiteSpace.
4.3.1 The intellectual structure of demand forecasting
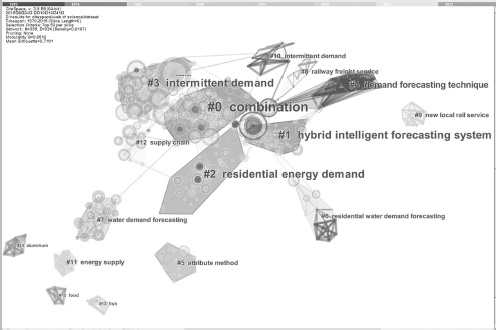
Co-citation analysis is an important part of scientometric analysis and also one of the most important functions of CiteSpace. Figure 4.5 shows the overview of a network of co-cited references in demand forecasting research. Typically, each article cites a number of references. In Figure 4.5, the cited references are represented as nodes; the links between the nodes represent that the two references are cited by the same articles, called co-citation. The assumption is that if two references are often cited together, then it is evident that the two references are associated in some way (Chen et al., 2012). The final co-citation network is a merged network from a series of individual networks, which are constructed from references published in self-defined time slices. In this study, an individual network is derived from the 50 most cited references published in the corresponding time slice, which is set as a 6-year time interval, with the whole timeline ranging from 1970 to 2015.
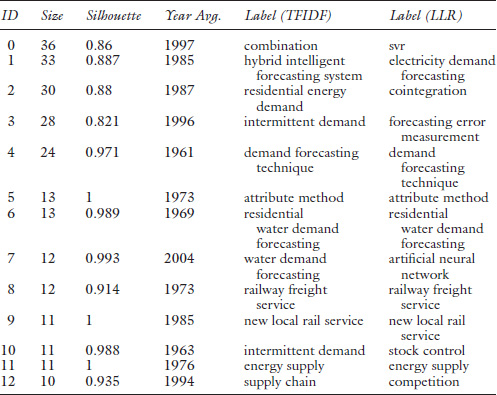
Figure 4.5 shows that the co-citation network is divided into several clusters of co-cited references, where references are tightly connected within the same clusters but loosely connected between different clusters. The cluster numbers are also labeled in descending order, based on the number of references included in each cluster. That is, the more references the clusters have, the higher are the rankings they are given. Table 4.4 lists the top 13 clusters by size, i.e., the number of members in each cluster. Clusters with more references tend to be more representative, because they attract much more attention of researchers.
The third column in Table 4.4, silhouette score, is an indicator of a cluster’s homogeneity or consistency. For a homogeneous cluster, the silhouette values tend to be close to 1. All clusters in Table 4.4 are highly homogeneous. Each cluster is labeled by noun phrases from titles of cited references in the cluster. The label extraction methods usually include the tf*idf weighting method (TFIDF) and the log-likelihood ratio method (LLR). And in this chapter, TFIDF is used in further discussions. The average year of publication of a cluster indicates its recentness. For example, Cluster #0 has an average year of 1997.
4.3.2 Co-citation clusters in time series
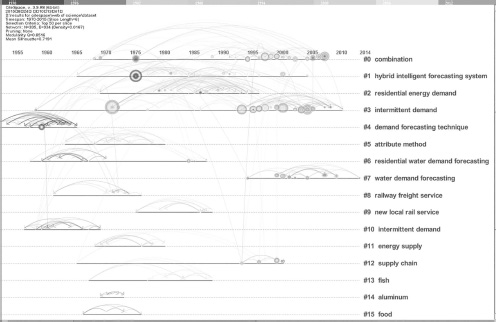
Figure 4.6 shows a visualization of how the network is divided into distinct co-citation clusters by timeline. Referring to the legend at the top, from left to right, we can keep track of the thematic and temporal development in demand forecasting research. Each line represents one cluster identified in Figure 4.5, demonstrating its temporal evolution. It is evident from Figure 4.6 that research about combination techniques, intermittent demand and water demand forecasting have been the relatively hot topics in recent years.
Citation bursts usually provide a useful means to trace the development of research focus. According to the analysis results, Cluster #0 appears to have recent publications with citation bursts, indicating that this is a recent trend for demand forecasting.
In Figure 4.5 and Figure 4.6, there are several publications with high betweenness centrality, summarized in Table 4.5. These publications connect co-citation clusters and tend to bridge different stages of the development of a scientific field. Two of them are in Cluster #0, i.e., Combination. References with the highest betweenness centrality are Box and Jenkins (1976), the ones that are located in Cluster #1. These publications are considered as landmark works in the context of demand forecasting research.
As Figure 4.5 shows, ‘combination’ is the largest cluster, which contains the most cited references. In literature, research about ‘combination’ started in the 1970s and developed mostly in the latest decade according to the number of citations. Now, combination forecasting techniques have been widely accepted in demand forecasting research. They combine advantages of different types of models and also combine reference information from historical data and experts’ domain knowledge. Combination forecasting is nowadays still a hot topic and needs more efforts from researchers.
‘Hybrid intelligent forecasting system’ is the second largest cluster. Artificial intelligence algorithms, for their excellent ability in modeling complex systems, are now widely applied in demand forecasting research. Compared to the traditional econometric models, they are more suitable for modeling nonlinear and unstable data. A hybrid intelligent forecasting system integrates different learning algorithms, which exploit different features and mechanisms underlying the data, to provide better performance than any individual models. Coupled with the combination techniques, artificial intelligence-based forecasting models are considered efficient forecasting tools in various industries.
|
Frequency |
Centrality |
Year |
References |
Cluster |
|---|---|---|---|---|
|
35 |
0.27 |
1976 |
BOX GEP, 1976, TIME SERIES ANALYSIS |
#1 |
|
22 |
0.23 |
1960 |
WINTERS PR, 1960, MANAGE SCIENCE, V6, P324 |
#4 |
|
32 |
0.1 |
1998 |
MAKRIDAKIS S, 1998, FORECASTING METHODS AND APPLICATIONS |
#0 |
|
15 |
0.08 |
1995 |
BISHOP CM, 1995, NEURAL NETWORKS FOR PATTERN RECOGNITION |
#7 |
4.3.3 Keywords and references with surging citation
In general scientometric analysis, burst detection is used for either citation bursts or keywords bursts, indicating the degree of attention from researchers to a keyword or an article, which to some extent represents emerging trends in the related research field (Chen et al., 2014). Figure 4.7 shows a time zone version of keywords co-occurrence (Figure 4.4) for demand forecasting research. The time zone version of keywords co-occurrence networks in Figure 4.7 provides another way to demonstrate the evolution of demand forecasting research in the time domain. Referring to the legend at the top, from left to right, we can track the development of main interests in demand forecasting research. As shown in Figure 4.7, artificial intelligence-based forecasting techniques, such as the artificial neural networks, the support vector regressions and the particle swarm optimization, etc., have been widely applied in demand forecasting literature while the econometric models such as time series models and regression models are viewed as old and benchmark models.
In addition, we also implement a burst detection and find out the keywords and cited references with the strongest bursts in demand forecasting research during the period between 1970 and 2015. The burst detection results identify neural network or artificial neural network as the keyword with the strongest bursts in demand forecasting literature. Starting around 1998, neural networks attracted much attention because of their advantage in modeling nonlinear and unstable data. Actually, besides the neural network algorithm, there are a variety of artificial intelligence algorithms, such as support vector regression and genetic algorithms, etc., which have kept playing important roles in demand forecasting in the past 15 years and will do so in the future also, with more mature algorithms. This result is also consistent with the phenomenon that articles about demand forecasting have grown significantly since the advent of the 21st century. One reason is the increased availability and power of computation systems, which make AI techniques more convenient to use. The results also indicate that method is a key point for demand forecasting research.

4.3.4 The landmark articles in demand forecasting research
Table 4.6 lists the top 10 most cited references in demand forecasting research. The most cited references are usually regarded as the landmark articles in the related research field. For example, Croston (1972) was the landmark article for intermittent demand forecasting, where the Croston model is the most commonly applied model to forecast intermittent demand; and Box and Jenkins (1976) had no doubt established the foundation for forecasting, proving for researchers the most efficient and convenient models for demand forecasting.
4.4 Conclusions
Demand forecasting is not a new discipline but it still attracts increasingly more attention. On one hand, the unsatisfactory forecasting quality and the role that demand forecasting plays in the business management processes have resulted in its continuous importance and on the other hand, the improved computational capabilities have made the adoption of more sophisticated methods possible.
|
Total citations |
Centrality |
Year |
Title of cited reference |
|---|---|---|---|
|
46 |
0.03 |
1972 |
CROSTON JD, 1972, OPER RES QUART, V23, P289 |
|
35 |
0.27 |
1976 |
BOX GEP, 1976, TIME SERIES ANALYSIS |
|
32 |
0.1 |
1998 |
MAKRIDAKIS S, 1998, FORECASTING METHODS AND APPLICATIONS, VTHIRD |
|
32 |
0.01 |
1994 |
WILLEMAIN TR, 1994, INTERNATIONAL JOURNAL OF FORECASTING, V10, P529 |
|
30 |
0 |
2005 |
SYNTETOS AA, 2005, INTERNATIONAL JOURNAL OF FORECASTING, V21, P303 |
|
30 |
0.02 |
2001 |
SYNTETOS AA, 2001, INTERNATIONAL JOURNAL OF PRODUCTION ECONOMICS, V71, P457 |
|
28 |
0.02 |
1996 |
JOHNSTON FR, 1996, JOURNAL OF OPERATIONAL RESEARCH SOCIETY, V47, P113 |
|
25 |
0.03 |
1995 |
WITT SF, 1995, INTERNATIONAL JOURNAL OF FORECASTING, V11, P447 |
|
24 |
0.01 |
2008 |
SONG H, 2008, TOURISM MANAGEMENT, V29, P203 |
|
24 |
0.01 |
1997 |
SANI B, 1997, JOURNAL OF OPERATIONAL RESEARCH SOCIETY, V48, P700 |
In this chapter, we provided a scientometric analysis and visual description for demand forecasting research based on the bibliographic records from the Web of ScienceTM Core Collection, with the help of CiteSpace software, which is mainly designed to generate and analyze networks of co-cited references based on relevant scientific literature. In conclusion, the investigation of the intellectual landscapes, landmark articles and bursting keywords in demand forecasting research has outlined the evolutionary trajectory over the past decades and highlighted the emerging trends in future research. The results can be discussed in several aspects.
Firstly, the quantity of articles published about demand forecasting research was small until the advent of the 21st century, after which it increased to an average level of about 150 per year. This is partly due to the improved availability of powerful computation systems and, in particular, to the usage of personal computers. From the scientometric analysis in section 4.2, we know that the number of articles that adopted the sophisticated methods such as artificial intelligence-based methods has increased massively in recent years.
Then, the scientometric analysis showed that the main trend for future demand forecasting research will still focus on the combination forecasting techniques and the hybrid intelligence forecasting systems. The combination forecasting techniques have been widely accepted in demand forecasting research. They combine advantages of different types of forecasting models and also combine reference information from historical data and domain experts. Combination forecasting techniques still need more efforts from researchers in the future; coupled with the combination techniques, a hybrid intelligent forecasting system integrates different learning algorithms, which are adopted to exploit different features and mechanisms underlying the data, to provide a better forecasting performance than any individual models. And more efficient and mature algorithms will be developed in the future research for demand forecasting.
References
Chen, C. (2006). CiteSpace II: Detecting and visualizing emerging trends and transient patterns in scientific literature. Journal of the American Society for Information Science and Technology, 57(3), 359–377.
Chen, C., Dubin, R., and Kim, M. C. (2014). Emerging trends and new developments in regenerative medicine: A scientometric update (2000–2014). Expert Opinion on Biological Therapy, 14(9), 1295–1317.
Chen, C., Hu, Z., Liu, S., and Tseng, H. (2012). Emerging trends in regenerative medicine: A scientometric analysis in Citespace. Expert Opinion on Biological Therapy, 12(5), 593–608.
Dean, D. L, Lowry, P. B., and Humpherys, S. (2011). Profiling the research productivity of tenured information systems faculty at U.S. institutions. MIS Quarterly, 35(1), 1–15.
Donkor, E. A., Mazzuchi, T. A., Soyer, R., and Alan Roberson, J. (2012). Urban water demand forecasting: Review of methods and models. Journal of Water Resources Planning and Management, 140(2), 146–159.
Hernández, L., Baladrón, C., Aguiar, J. M., Carro, B., Sanchez-Esguevillas, A. J., Lloret, J., and Massana, J. (2014). A survey on electric power demand forecasting: Future trends in smart grids, microgrids and smart buildings. IEEE Transactions on Communications Surveys & Tutorials, 16(3), 1460–1495.
Karuga, G. G., Lowry, P. B., and Richardson, V. J. (2007). Assessing the impact of premier information systems research over time. Communications of the Association for Information Systems, 19(7), 115–131.
Kim, M. C., and Chen, C. (2015). A scientometric review of emerging trends and new developments in recommendation systems. Scientometrics, 104(1), 239–263.
Lowry, P. B., Humpherys, S. L., Malwitz, J., and Nix, J. (2007a). A scientometric study of the perceived quality of business and technical communication journals. IEEE Transactions on Professional Communication, 50(4), 352–378.
Lowry, P. B., Karuga, G. G., and Richardson, V. J. (2007b). Assessing leading institutions, faculty, and articles in premier information systems research journals. Communications of the Association for Information Systems, 20(16), 142–203.
Lowry, P. B., Moody, G. D., Gaskin, J., Galletta, D. F., Humpherys, S., Barlow, J. B., and Wilson, D. W. (2013). Evaluating journal quality and the Association for Information Systems (AIS) Senior Scholars’ journal basket via bibliometric measures: Do expert journal assessments add value? MIS Quarterly, 37(4), 993–1012.
Lowry, P. B., Romans, D., and Curtis, A. M. (2004). Global journal prestige and supporting disciplines: A scientometric study of information systems journals. Journal of the Association for Information Systems, 5(2), 29–80.
Song, H., and Li, G. (2008). Tourism demand modelling and forecasting – a review of recent research. Tourism Management, 29(2), 203–220.
Suganthi, L., and Samuel, A. A. (2012). Energy models for demand forecasting – a review. Renewable and Sustainable Energy Reviews, 16(2), 1223–1240.
Zheng, Y., Yuan, J., Pan, Y., and Zhao, X. (2011). Scientometric analysis of physics (1979–2008): A quantitative description of scientific impact. SCIENCE CHINA Physics, Mechanics & Astronomy, 54(1), 176–182.