3
ITU-T FCAPS
This chapter is intended to provide the reader with an understanding of FCAPS introduced by ITU-T (International Telecommunication Union-Telecommunication Standardization Bureau) and defined in recommendation M.3400. At the end of this chapter you will have a good understanding of FCAPS functionality and how it applies to different layers of the TMN.
3.1 Introduction
Associated with each layer in the TMN model are five functional areas called FCAPS that stand for fault, configuration, accounting, performance and security. These five functional areas form the basis of all network management systems for both data and telecommunications (see Figure 3.1).

The information in telecom management is classified into functional areas using FCAPS. It was introduced for telecom network management by ITU-T in recommendation M.3400. The ISO (International Standards Organization) made the FCAPS also suited for data networks with its OSI (open system interconnection) network management model that was based on FCAPS. Further in this chapter, each of the FCAPS functional areas are taken up and discussed in detail. All element management systems are expected to provide the FCAPS function or a subset of the same. At higher levels like business, service, and network layer, derivatives of basic FCAPS functionality can be implemented like a complex event processing engine that triggers mail on business risks when network elements carrying major traffic goes down or a service request is sent to the nearest technician or set of commands to the network elements to replace load or restart.
3.2 Fault Management
Fault is an error or abnormal condition/behavior in a telecom network.
Fault management basically involves the detection, isolation, and correction of a fault condition.
The first part involves detection of an error condition by the element management system. This can be achieved in the following ways:
- The network element generates a notification when an alarm condition is identified with any of the node attributes associated with the element: Most network elements generate logs/alarms when an error condition occurs. Using a network management protocol these notifications can be collected from the network element.
- Executing diagnostics tests at regular intervals to check for issues: The element management can have its own set of rules to identify errors. For example the EMS can define severity for specific conditions of resource in the network element and do regular audits on the state of resources. When a state change happens, the new state of resource is compared with severity and a log is generated.
- Processing database information: The network element can have a database that stores static and dynamic information about the element. Querying this database will also provide information about fault condition. A detailed coverage of MIB (management information base) is later handled as a separate chapter in this book.
There are other methods that an EMS uses to detect fault also. Some of them include checking and filtering the system logs on the network element, adding code that defines thresholds for attributes of the network element and generating an event when threshold is crossed, and so on. Some EMS employ combinations of the above fault detection methods, like having the NE send event notifications as well as running routine checks if some data was lost or not sent by NE.
Once detected, the fault needs to be isolated. Isolation includes identifying the element in the network or resource (can be a process or physical component) in the element that generated the fault. If the fault information is generic, then isolation would also involve filtering and doing data processing to isolate the exact cause of the fault.
After the fault is detected and isolated, then it needs to be fixed. Correcting fault can be manual or automatic. In the manual method, once the fault is displayed on a management application GUI, a technician can look at the fault information and perform corrective action for the fault. In the automatic method, the management application is programed to respond with a corrective action when a fault is detected. The management application can send commands to the network elements (southbound), send mail to concerned experts (northbound), or restart processes on the management application server. Thus in automatic method interaction with northbound interface, southbound interface, or to self is possible.
Fault information is presented as a log or alarm in the GUI. A log can represent nonalarm situations like some useful information for the user. A log specifying that an audit was performed on a network element is an info log and does not raise an alarm. An alarm or log usually has several parameters (see Table 3.1).
Parameters in an Alarm/Log
|
Parameter |
Description |
|
Notification ID |
The same alarm can occur multiple times. An easy way to track an alarm is using its notification ID. |
|
Alarm ID |
A particular error condition is associated to an ID. For example we can have CONN100 as the alarm ID to signify a connection loss and CONN200 to signify connection established. This way we can associate logs. In a fault database notification ID is unique while alarm ID can be repeated. |
|
Generation time |
This is the time when the error scenario occurred and the notification was generated on the NE. Some applications also have “Notification time,” which signifies the time when the management application received an alarm notification from the NE. |
|
Resource info |
The information about the network element and the resource on the network element that caused the error condition is available in log body. |
|
Alarm purpose |
If the alarm is a new alarm, an alarm for overwriting status, or a clear alarm. For example, when a resource is having some trouble an alarm is raised, as the resource is restarted another alarm is send to overwrite the existing alarm and once the resource is back in service, a clear alarm can be raised. |
|
Probable cause |
This is another parameter for classifying data. Consider the example of CONN100 for connection loss. We might want to classify connection logs associated with a call server and connection logs associated with a media gateway in two different categories. This classification can be achieved with probable cause keeping same alarm ID. |
|
Alarm type |
In addition to classification based on cause, 3GPP recommends the use of alarm types for grouping alarms. Some of the alarm types recommended by 3GPP are: communications alarm, processing error alarm, environmental alarm, quality of service alarm, or equipment alarm. |
|
Severity |
The usual severity conditions are minor, major, critical, and unknown severity. |
|
Alarm information |
This part will contain complete problem descriptions, which includes the resource information and the attribute that gets affected. Sometimes the alarm information will even specify the corrective action to be taken when the log appears. |
A detailed set of alarm parameters for specific networks are available in 3GPP specification 32 series on OAM&P.
Having discussed the basic fault functionality, let us look into some applications that are developed using the fault data that is detected and displayed. Some of the applications that can be developed using fault data are:
- Fault/event processing
- Fault/event filtering
- Fault/event correlation
Event Processing: There are three types of event processing: simple, stream, and complex. In simple event processing when a particular event occurs, the management application is programed to initiate downstream action(s). In stream event processing, events are screened for notability and streamed to information subscribers. In complex event processing (CEP) events are monitored over a long period of time and actions triggered based on sophisticated event interpreters, event pattern definition and matching, and correlation techniques. Management applications built to handle events are said to follow event driven architecture.
Event Filtering: The corrective action for alarms are not the same. It varies with the probable cause. There could also be corrective action defined for a set of alarms as a single event and can generate multiple alarms on different network elements. For example, a connection loss between two NEs would generate multiple alarms not just related to connection but also on associated resources and its attributes that are affected by the connection loss. The relevant log(s)/alarm(s) needs to be filtered out and corrective action defined for the same.
Event Correlation: An integral part of effective fault handling is event correlation. This mostly happens in the network and service management layers. It involves comparing events generated on different NEs or for different reasons and taking corrective actions based on the correlated information. For example, when the connection between a call server and media gateway goes down, alarms are generated on the media gateway as well as the call server, but the NMS handling both these NEs will have to correlate the alarms and identify the underlying single event. The process of grouping similar events is known as aggregation and generating a single event is called event aggregation.
Event processing usually involves event filtering as well as event correlation. Event processing in a service layer can generate reports on a service that could help to analyze/improve quality of service or to diagnose/fix a service problem.
Some of the applications where basic fault data can be used as feed are:
- Quality assurance application: The lesser the faults the better the quality
- Inventory management application: Faulty NEs would need service or replacement
- Service and resource defect tracker
- Event driven intelligent resource configuration and maintenance
- Product and infrastructure budget planning
Most EMS/NMS applications also have fault clearing, fault synchronization, fault generation, and fault handling capabilities.
3.3 Configuration Management
Configuration management involves work on configuration data associated with the managed device/network element.
Some of the functionalities handled in configuration management are:
- Resource utilization: This would involve the representation of data on how effective the configuration is in getting the best out of the network. Some examples include count of the number of trunks that are not working properly, plot of under utilization of a trunk with less traffic routing, and so on.
- Network provisioning: Involves configuring network elements and subresources in the element to offer a service, or in other words the network is set up using interactive interfaces for proper working.
- Auto discovery: When the management application comes up it scans the network and discovers the resources in the network, which is called auto discovery. As part of auto discovery the state of the resource (in service, in trouble, offline, busy, etc.) and its attributes that are to be displayed and used in the management application are also collected.
- Backup and restore: It is critical to backup configuration information and restore the data when required. Some possible scenarios include, installing a new version of software on the NE, upgrading a software, taking the NE down for some maintenance or fault correction, and so forth.
- Inventory management: This involves keeping track of the resources (both active and inactive) in the enterprise, so that they can be allocated, provisioned, rolled out, kept as backup, and so forth. The output of auto discovery is a feed to inventory management to synchronize the status of the resources allocated for a network.
- Change management: The change in status of the network elements needs to be continuously monitored and updated. Break down of an element without proper mitigation strategy can result in loss of business and in a military domain it could result in loss of life. So the change in status would trigger actions corresponding to the new state.
- Preprovisioning: A set of parameters needs to be set during provisioning. Effective decision on the parameters to set can be obtained by trend analysis of the network element. This would aid in determining parameters for provisioning and is termed as preprovisioning.
Configuration management (CM) involves continuous tracking of critical attributes of the network elements and a successful initialization only marks the starting point for CM.
3.4 Accounting Management
Accounting management involves identification of cost to the service provider and payment due for the customer. Accounts being calculated based on service subscribed or network usage.
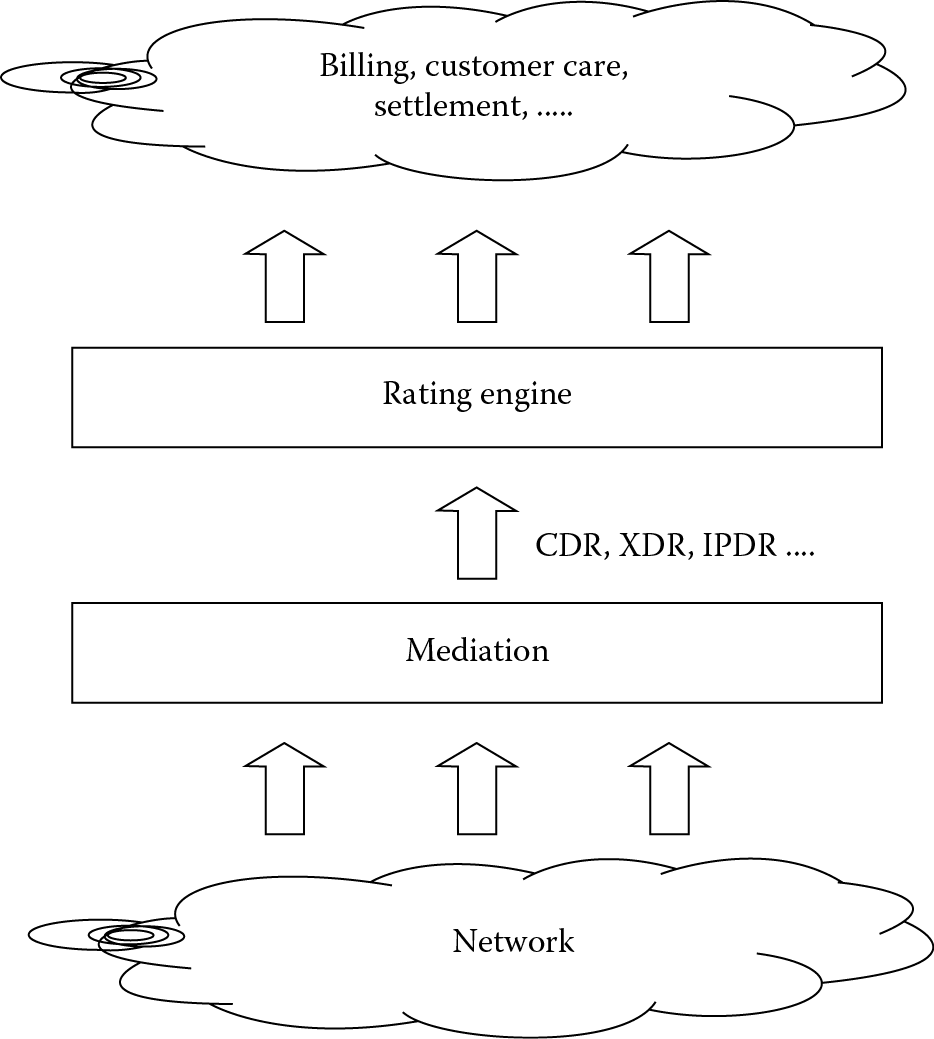
In accounting, a mediation agent collects usage records from the network elements and forwards the call records to a rating engine (see Figure 3.2). The rating engine applies pricing rules to a given transaction, and route the rated transaction to the appropriate billing/settlement system. This is different from customer account management. (Any customer is represented in the billing system as an account. One account can have only one customer.)
Accounting management can be split into the following functions:
- Track service and underlying resource usage: The mediation agent collects data from NEs, which is used to determine charges to customer accounts. Account data processing must be carried out in near real-time for a large number of customers. On the data collected by the mediation agent, a tariff is applied based on the service level agreement the customer has with the service provider.
- Tariff: The tariff or rating of usage is also part of accounting. This involves applying the correct rating rules to usage data on a per customer basis and then applying discounts, rebates, or charges as specified in the service level agreement.
- Usage restrictions: Based on the subscription taken up by the customer there is a limit set on the usage of resources, for example, disk space, network bandwidth, call duration, services offered, and so forth.
- Converged billing: A single service is realized using multiple network elements. Traditionally accounting information is collected from all the NEs and a single bill is generated. With converged billing the customer can have multiple services and still get a consolidated billing for all the services.
- Audits: Accounting is a critical aspect of business and forms the revenue for physical network and service offered. Hence billing records and reports are handled carefully in management applications. Schedule audits and reports check the correctness of information and helps in archiving of data. An internal scheduler can perform report generation. Reports give consolidated data that form input to business and technical planning.
- Fraud reporting: Fraud management in telecom has evolved to be an independent area of specialization and there are applications to detect fraud that are delivered independently without being part of a management application. As part of the initial definitions of ITU-T, fraud reporting was part of accounting. Some of the telecom frauds are: Subscription Fraud, Roaming Subscription Fraud, Cloning, Call-Sell Fraud, Premium Rate Services (PRS) Fraud, PBX Hacking/Clip-on Fraud, Pre-paid Fraud, Internal Fraud, and so on.
The account management system should be such that it can interface to all types of accounting systems and post charges.
3.5 Performance Management
Performance management involves evaluation and reporting the behavior and effectiveness of network elements by gathering statistical information, maintaining and examining historical logs, determining system performance, and altering the system modes of operation.
Network performance evaluation involves:
- Periodic tests to measure utilization, throughput, latency availability, and jitter
- Identifying key performance indicators and setting thresholds for evaluation
- Collection of performance data as register counts on dropped calls, outages registered, threshold parameters crossed to judge the network health
- Analysis of collected data to give plots and reports for technicians
- Archiving performance data to identify trends and best configurations
- Use of the analyzed output to develop patterns for improving and effectively utilizing the network
- Replacing or correcting inventory for improving performance
- Generating logs to notify technicians when thresholds are crossed on predefined parameters for performance evaluation
The functionalities in performance management that are built into most management applications can be classified into:
- Performance data collection: For each network element or for a service offered by network there are a set of key performance indicators. For a network, collection of data on these performance indicators help in determining and forecasting network health and with a service it helps to indicate the quality of service (QoS). Collection of this performance data is a key functionality in most management applications.
- Utilization and error rates: The traffic handled by a trunk to the maximum traffic it can handle is an indicator of trunk utilization. This in turn shows how the trunk is performing independently and compared to other trunks in the network. Even when a trunk is getting utilized, the overall network may not be effectively managed.
A typical example is under utilization of one trunk and over utilization of another. Thresholds need to be set and error rates determined so that there is optimal utilization at network level of all possible resources. Different algorithms are used to implement this and make sure there is minimal manual intervention.
- Availability and consistent performance: The most basic check of performance is availability of a resource. If the resource is generating reports then availability is confirmed. Performance data is usual for forecasting, trend development, and planning only when the performance levels are consistent.
- Performance data analysis and report generation: All performance management applications have data collection, data analysis, and report generation. Multiple reports are generated as graphs and plots of the performance data.
Data analysis would also involve creating correlations and finding correlated output on threshold data. In addition to graphical representation, there are also features in management applications that permit export of data for later analysis by third-party applications.
- Inventory and capacity planning: Performance data is used as input for inventory planning on deciding what network elements need to be replaced or monitored and for capacity planning on deciding the routing path of trunks, how much traffic to route, and so on.
Performance data is usually collected as:
- Bulk download from the NE: In this method PM data are generated and stored in a predetermined folder on the NE. The management applications collect the data at regular intervals of time.
- Send from the NE on generation: The network element contains code to send the data to the management application using a predefined protocol and the management applications keeps listening for data from NE.
- Queried from NE database: The network element can contain a management information base (MIB) where performance data is stored and dynamic attributes of performance updated at real-time. In this method, the management application collects data from the MIB.
3.6 Security Management
Security management deals with creating a protected environment for core resources and for managing the network.
In telecom, security is a key concern. Monitoring and tracking for potential attacks need to be performed as part of security management. The basic functionality in security is to create a secure environment. This can be done by using AAA to authenticate, authorize, and account for user actions. Protocols like RADIUS are used to implement the security.
The communication between network elements can be encrypted and a secure channel may be used while communication uses management protocols. XML-based management protocols like NETCONF inherently supports SSH (secure shell) in its communication architecture.
Authenticated access is required for logging into the network element or the management application. It is also quite common to use security servers that implement rules and policies for access like the Sun One Identity Server, which can control centralized access.
A typical implementation would involve the interface to add, delete, or edit users. Each of the users can be associated to a group. For example there will be groups like administrator, GUI users, technicians, and so forth, with a separate set of access permissions for each group. Permissions could be granted to specific functionalities in an application, like a user in the technicians group can only modify configuration management functionalities and view fault management functionality.
Some applications even define deeper levels of permission where a user in a specific group might be able to view and add comments to a log-in fault management functionality but will not be able to clear the log.
Logs can be used to track security. The network element generates security logs for different access and usage scenarios. For example a log is generated with the log-in user details and source of the user (IP address of the user machine), when a user tries to log into a network element. Logs can also keep track of the activities performed by a user on the network element. Alarms on failed log-in attempts and unauthorized access attempts are also captured as part of security management.
Functionalities like call trace and call interception is done using telecom management applications. When a law enforcement agency wants to trace calls from a user, the security management application configures the network element to generate call trace records for the user. The trace records are collected from the network element, analyzed, and displayed in predetermined format. In call interception, a call in progress between two users is intercepted for listening by a law enforcing agency.
Single-sign-on (SSO) is a popular method for access control that enables a user to authenticate once and gain access to multiple applications and network elements.
SSO functionality is now available in most service and network management applications. There might be multiple element management applications that make up a network management application. For example, network elements may be from different vendors and each have a separate element manager that can be launched from the single NMS application for an entire network. With centralized control of security management a single id can be used by a user to log into all the applications in the NMS.
Security management can be a stand alone application run on a security gateway that provides the only entry point for communication with core networks (see Figure 3.3).

The rapid spread of IP-based access technologies as well as the move toward core network convergence with IMS has led to an explosion in multimedia content delivery across packet networks. This transition has led to a much wider and richer service experience. The security vulnerabilities such as denial-of-service attacks, data flood attacks (SPIT), and so on that can destabilize the system and allow an attacker to gain control over it are applicable to video conferencing over IP, is true for wireless communication over IMS networks also. Currently, hackers are not limited to looking at private data, they can also see their victims. Videoconferencing systems can be transformed into video surveillance units, using the user equipment to snoop, record, or publicly broadcast presumably private video conferences. Network security and management of security has always been a key area in telecom. The latest concepts of convergence, value-added services, and next generation networks have increased the focus on security solutions.
3.7 Conclusion
The FCAPS forms the basic set of functionalities that are required in telecom management. All telecom management applications would use data obtained from these functionalities in one way or the other.
Additional Reading
1. Vinayshil Gautam. Understanding Telecom Management. New Delhi: Concept Publishing Company, 2004.
2. James Harry Green. The Irwin Handbook of Telecommunications Management. New York: McGraw-Hill, 2001.