
CHAPTER 7
Comparative Analysis with Conventional Investing
Shariah-Compliant Investing Is Resilient, while Conventional Investing Has to Recover from Financial Crisis
Disposition of people is contingent upon interest.
(Islamic legal maxim)4
INTRODUCTION
It was in 2010 that I first met the equity investment team of Abu Dhabi Investment Authority (ADIA), one of the top-three largest sovereign wealth funds (SWF), in the world. In trying to understand the logic behind Islamic investing, they asked very valid questions that highlighted key concerns of most, if not all, institutional investors. They queried what characteristics of the smaller universe of available constituents were able to produce comparable performance to the conventional. They also insisted on knowing what the top ten stocks of a proposed Islamic global equity portfolio would be and how many of those were also in the top ten stocks of the conventional global equity index.
Over the last four years my greatest challenge has been to convince SWFs like ADIA, whose investment goals are solely focused on investment performance. There is strong resistance from most SWFs to invest a part of their monies in a Shariah-compliant portfolio. I believe that this is due to these organizations understandably wanting to remain in their traditional comfort zone to a certain extent, as well as due to the lack of long-term investment track records that would provide convincing evidence. Inconsistent efforts by the Islamic finance community to educate and update these institutions and directly address questions like the ones asked above have not helped matters. This chapter will serve to clarify and elucidate where the differences are and how the different investment styles impact the resulting investment performance.
The analysis in this chapter will also serve to shift the mind-set of institutional investors via socially responsible investing (SRI). Most American, European, Japanese, and Australian pension houses have provided specific allocation for SRI portfolios and ethical investment. Shariah investing falls under this allocation of delivering value-added ethical investment. It goes beyond a traditional ethical investment approach because an additional layer of risk management exists on top of the SRI/ethical screening. This built-in layer of risk management delivers the coup de grâce of Shariah investing—high-quality assets with strong fundamentals and low debt-to-equity ratios are examples of criteria that stocks must fulfill in order to be considered compliant with Shariah.
It would be safe to assume that the majority of savings by Muslims are held in cash, conventional deposits, and conventional investment products. In the conventional mutual funds’ universe of more than 70,000 funds, they amount to more than USD19 trillion in assets under management (AUM), compared to USD60–65 billion1 in Shariah-compliant AUM globally with approximately 750 funds. The Islamic finance value chain begins with Islamic banking and continues through to Takaful business and capital markets. At the tail end of this value chain, Islamic asset management exists to service the investment needs of these other components. Shariah investing is a viable option for these investors.
Although the existing belief that Shariah investing will result in performance drag due to its limited investment universe (in comparison to the conventional investment universe) is understandable, the following analysis will clear up this misconception and deepen the understanding of the nature of Shariah investment returns.
ISLAMIC INDICES OUTPERFORMED CONVENTIONAL INDICES
The past five years have been challenging with investment uncertainty, higher market volatility, and increasing investor anxiety. The global equity markets are slumping on sovereign debt troubles and continued doubts about economic recovery. Although the road to recovery has not been smooth, Shariah investing has displayed its strength over the conventional investing approach, especially in these volatile times.
It has been encouraging to observe that out of three global Islamic indices by Dow Jones, MSCI, and FTSE, two of them have outperformed their own conventional global index counterparts over the last five years. Table 7.1 shows the cumulative five-year performance of the global Islamic indices and their corresponding conventional indices.
Table 7.1 Five-Year Cumulative Performance of Global Indices

Islamic indices exhibited respectable outperformance of between –8.96 percent and 9.91 percent over a five-year period ending December 31, 2012. However, it is not only this outperformance in volatile market conditions that speaks positively for Shariah investing but its performance across a full market cycle.
Although the indices have similar performance, there is still variation across the three Islamic indices. The difference in performance across the Islamic indices may be due in part to the variation in the index construction processes. The differing screening criteria introduced by the various Islamic index providers may cause a variation on the eligible constituent lists.
QUALITATIVE COMPARISON OF ISLAMIC INDEX SCREENING PROCESSES
Shariah principles are derived from the Qur’an and Sunnah, which state very clearly at a core level what is permissible, and confer certainty on what is and what is not haram. There is a further layer of debate and refinement among Shariah scholars—Ijma and Qiyas—where they must come to a consensus and reasoning based on assumptions and analysis of what is permissible. This explains that screening at the permissible industry level generally does not differ but financial ratios screening does result in a variation of the overall constituents. The Shariah scholars of each respective index provider (Dow Jones, MSCI, and FTSE) have each come to a different consensus on the financial formulas used to interpret and refine the respective index provider’s financial ratios screening. Therefore, each index provider may have slight variations on the screening criteria being followed, and consideration must be given to whether those variations materially impact the requirements of the respective index users.
Shariah Index Construction: Industry and Financial Ratio Screening
The industry screening processes between the three index providers are similar. The main variation is in the financial ratio screening where DJIM World measures its debt and cash financial ratios over market capitalization while FTSE and MSCI measure them over total assets. Computing the ratios against market capitalization can result in these ratios being less stable when equity markets are volatile. Market capitalization is the market’s perception of how much the business is worth, and tends to fluctuate subject to market sentiment, economic sentiment, and global macroeconomic factors.
The Shariah financial ratios are more stable when total assets are used instead of market capitalization. Also, with total assets as the base, it will mean that the ratios are derived from the company’s balance sheet and shareholders’ financial commitments, which will more clearly reflect how financial decisions are made and how management runs the business.
Shariah Index Maintenance
Each Islamic index provider’s index maintenance review frequency will affect the timing of the inclusion and removal of eligible stocks, and hence will have slight varying performances across the Islamic indices. Again, while each index provider may have minor variations on the review frequency, consideration must be given to whether those variations materially impact the requirements of respective index users. The composition of the DJIM World and MSCI are reviewed quarterly while the FTSE Global Islamic Index Series is reviewed semiannually.
From a Shariah-compliance standpoint, the more reviews and rebalances are done to an index, the more accurate the constituent list will be. Meanwhile, from an index user standpoint, if reviews occur too frequently, the index may exhibit more volatility from repeated rebalancing. As such, index review processes should not take place more than on a quarterly basis. Certainly, our recommendation would be to strike a balance where index reviews occur at most on a semiannual basis.
PERFORMANCE ANALYSIS OF THREE DOW JONES SHARIAH INDICES AND THEIR COUNTERPARTS
The following analysis will look at the factors that influence the outperformance or underperformance of Shariah equity indices and their conventional counterparts. The Dow Jones Islamic Market indices are selected because of the availability of sufficient track record for analysis. The three pairs of investment indices under examination are:
Dow Jones Islamic Market World (DJIM) Index and Dow Jones Global Index (DJ Global)
The results show that this is generally in line with the conviction that global conventional and Islamic indices demonstrate comparable performance. On a five-year cumulative basis, the DJIM World outperformed the DJ Global (see Table 7.2).
Table 7.2 Five-Year Cumulative Performance for Global Index

Further, if we observe the volatility pattern in the past five years of Dow Jones Islamic Index and Global Index, the volatility is not dissimilar between the two. The patterns depicted across the markets are almost the same for both indices. Hence, with regards to the volatility, we can safely comment that volatility is more or less the same for Islamic and conventional indices.
The Dow Jones Global index has 6,850 constituents with a market capitalization of USD44.12 trillion. In comparison, the DJIM World has 2,413 constituents with a market capitalization of USD18.35 trillion. Although the limited Islamic investment universe with fewer constituents delivered comparable performance in a more stable manner than its conventional index counterpart.
Further examination of sector allocation (Table 7.3) for these two indices reveals that the weights of certain sectors differed widely due to the Shariah principles and screening methodology. The financial sector has a 21.78 percent allocation in the conventional index, but only 1.38 percent allocation in the Islamic index. Therefore, when the financial crisis occurred in September 2008, the Shariah index performance benefited from a lack of exposure to the volatile financial sector.
Table 7.3 Dow Jones Sector Allocation for Global Market Index

However, a look at the top constituents of both indices in Table 7.4 reveals a significant amount of congruence. Institutional investors can take comfort that six of the top ten constituents in the Islamic index are also in the top ten of the corresponding conventional index. They are Exxon Mobil, Apple, Chevron, IBM, Microsoft, and Johnson & Johnson. The other four constituents in the Islamic index are also globally recognized companies: Google, Proctor & Gamble, Pfizer, and Samsung Electronics.
Table 7.4 Top 10 Constituents for Global Market Index

Moving away from the developed world, let us examine the performance of an investment universe purported to be the next global growth engine: Asia.
Dow Jones Islamic Market Asia Pacific Index and Dow Jones Asia Pacific Index
There are 13 countries in the Asia Pacific market, including Australia and New Zealand. These nations have proven more resilient, having learned from the 1997–1999 Asian economic crises. Growth in these countries is being supported by resource-based industries in addition to their growing domestic consumption bases. High productivity in the agriculture and manufacturing sectors has boosted consumer and business confidence. India has grown to be one of the largest exporters of software and other information technology-related services. The region’s economic growth has been a result of the expansion of the financial sector with investment flows moving into China and India. Consistent higher growth compared to the developed world has been achieved by this group of emerging middle-income economies, while strong domestic consumption coupled with robust exports have kept investor sentiment upbeat on the region. Similar to the global indices comparison earlier, the Dow Jones Islamic Market Asia Pacific Index shows a comparable performance against its conventional counterpart. See Table 7.5.
Table 7.5 Five-Year Cumulative Performance for Asia Pacific Market

The Dow Jones Islamic Market Asia Pacific Index cumulatively outperformed the Dow Jones Asia Pacific conventional counterpart by 8.33 percent over a five-year period. Moreover, as we mentioned earlier, the volatility between the two indices had depicted similar observations over the years. Outperformance with volatility factor taking into consideration proves the stability of Islamic index. Once more, the Islamic index recorded similar performance in a more stable manner. These differentiations are also because of significant dissimilarity in the sector allocation, as shown in Table 7.6 for both the markets.
Table 7.6 Dow Jones Sector Allocation for Asia Pacific Index
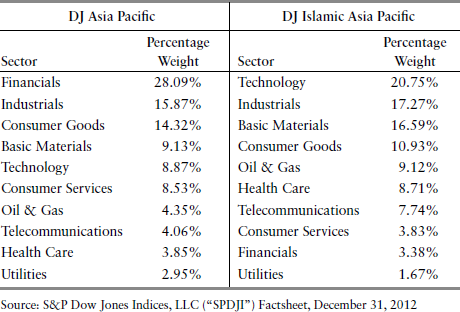
With regards to the constituents, conventional index has 3,589 constituents with a total market capitalization of USD12.1 trillion in comparison to the smaller universe of the Islamic index with 1,146 constituents and a total market capitalization of USD4.37 trillion as of December 2012.
With the not-so-smooth economic recovery, sectors like financials, information technology, materials, and industrials lagged the broader market, causing downward pressure in the equity market. However, when we compare the top 10 constituents of both indices, there are three common constituents—BHP Billiton, Samsung Electronics, and Taiwan Semiconductor. Other familiar names that make up the top 10 list of the Shariah index are Canon Inc., PetroChina Co. Ltd. H Shares, and China Mobile Ltd.
Despite the big difference in sector allocation between the conventional and Shariah indices, where the conventional index invests 41.65 percent of its top 10 constituents in banks, the Shariah index is more spread out and exhibits diversification of risk from the standpoint of country and sector allocation. See Table 7.7.
Table 7.7 Top 10 Constituents for Asia Pacific Index

Dow Jones Islamic Market Emerging Markets Index and Dow Jones Emerging Markets Index
Further analysis is of a third set of market indices that are currently popular with the investment community, the global emerging markets. See Table 7.8.
Table 7.8 Five-Year Cumulative Performance for Emerging Markets
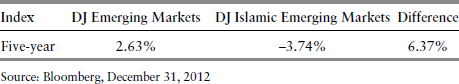
A low-quality rally does not favor Shariah-compliant portfolios, which tend to be of higher quality as they are restricted by Shariah guidelines on levels of debt. The consistent underperformance of the Islamic emerging markets index versus the conventional emerging markets index is in some way being influenced by the rally on risky assets and also the sector weightings.
Conversely, the volatility for both the markets represent similar patterns. This does not mean that the investors’ Shariah-compliant portfolio will be in tandem with these indices. Having done this analysis, the investment managers who manage Islamic emerging markets will have to relook into value adding by taking bets outside the index weight and being more active in quantitative research toward their core belief in superior stock selection for consistent superior performance (alpha).
Referring to the above Table 7.9, the Islamic emerging market index contains a larger exposure to the oil and gas, basic materials, and technology sectors compared to the conventional emerging markets index. Meanwhile, the conventional emerging markets index has greater exposure to the financials, consumer services, and technology sectors. Emerging market countries have been fundamentally more attractive than developed countries, showing stronger economic growth, more favorable demographics, higher current account surpluses and lower levels of debt at the country, corporate, and consumer levels. All these have benefited the financial, consumer services and consumer goods sectors. The oil and gas, basic materials, technology, and telecommunications sectors have been affected at a global level and performance of these sectors within the Islamic emerging market index has dragged the overall performance down relative to the conventional emerging markets index.
Table 7.9 Dow Jones Sector Allocation for Emerging Markets Index

It can be argued that the conventional emerging markets have financial sectors that have been resilient. As banks in emerging markets report better than expected results and credit conditions continue to improve, investors are returning to the market and positioning themselves for an emerging market global economic recovery.
There are three common constituents in the top five of both Islamic and conventional market indices. However, there are five similar companies in the top ten, although with different share types. Two of these common constituents come from manufacturing, namely: Taiwan Semiconductor Manufacturing Co. Ltd. and Vale S.A. Prf B. See Table 7.10.
Table 7.10 Top 10 Constituents for Emerging Markets Index

Although the total number of Shariah-compliant constituents is only 1,065, its market capitalization is at USD4.0 trillion, which is a respected 40.25 percent of the conventional market capitalization. Unlike the global and Asia Pacific Shariah indices, the DJ Islamic Emerging Markets Index underperformed the DJ Emerging Markets Index over five years with similar volatility.
VALUE-ADDED OPTIMIZATION FOR SHARIAH PERFORMANCE
The results of the index analyses shed light on what the fund manager must focus on. The challenge to the investment manager is to provide value by changing the portfolio weights and taking small bets out of the index. Active stock selection can be based on three core beliefs of improving and sustaining business fundamentals, rising investor expectation, and attractive relative valuation.
In addition to optimizing the portfolio, the investment manager may add value by:
- Evaluating whether major market changes are due to Shariah concerns, market concerns, or perhaps both
- Evaluating whether pricing differentiation between conventional and Shariah-compliant securities are due to Shariah interpretations, Islamic market dynamics or imbalance, regulatory requirements, or government initiatives
- Advising clients on potential benchmarks for their portfolios
- Identifying risks peculiar to Islamic securities and markets and mitigating them effectively
- Optimizing a client’s portfolio by anticipating market trends that could affect the securities universe
- Understanding a client’s Islamic needs and then structuring an optimal asset allocation based on the above abilities
These capabilities, coupled with a disciplined investment process, should yield sustainable investment returns over the longer term.2
CONCLUSION
Investing in Shariah equity does not mean one has to sacrifice investment performance. Over a longer time period (e.g., August 2007 to December 2012), the MSCI World Islamic significantly outperformed the MSCI World by more than 11.48 percent.3 This shows that the Shariah investment approach has merit through a strong bull market, not just during a down-trending market, as some would argue.
The analysis of Shariah equity indices, both quantitatively and qualitatively, shed light on how variations in performance of Islamic indices have come about. Similar performance comparison with conventional equity indices will illustrate that Shariah investment is a clear alternative worthy of consideration by all investors. As Shariah index providers further refine their index construction and maintenance processes, the acceptance of this investment process will gain further credence with mainstream investors.
Both Islamic and ethical funds are for clients with similar investment preferences. Investors should adopt and use both ethical and Islamic investment strategies, not only because such investments allow a focus beyond the bottom line but also because their returns are comparable to, if not better than, those from conventional investments.
This chapter has provided an examination of the performance of both conventional and Islamic equities via their respective index performances, which are transparently constructed and globally visible. The comparison has shown that both are able to achieve similar investment performance despite the different index construction processes. It has become evident that the Shariah investment approach is a credible complementary investment alternative that all investors should consider, with the guidance of an experienced Shariah investment manager.
NOTES
1. KFH Research Ltd. and the Global Islamic Finance Forum (GIFF). “Global Islamic Finance Forum (GIFF).” Kuala Lumpur, Malaysia: September 18–20, 2012.
2. CIMB-Principal Islamic Asset Management, “Case for Islamic Asset Management,” July 31, 2012.
3. Bloomberg LP, “Comparison Between MSCI World and MSCI World Islamic,” August 31, 2007–December 31, 2012.
4. The legal maxim shows that Shariah compliance is always associated with benefit and good. And where there is Shariah-compliant business, wellbeing, good returns, and prosperity prevail. Hence the benefit generated from Shariah-compliant business is greater than from the conventional businesses.
General Reading
Brown, Ellen Hodgson, The Web of Debt: The Shocking Truth About Our Money System And How We Can Break Free. Revised and Expanded with 2008 Update. Third Millennium Press Baton, 2008.
Dar, Humayon, Rizwan Rahman, Rizwan Malik, and Asim Kamal, Global Islamic Finance Report (GIFR). An Edbiz Consulting Publication, 2012.
Landier Augustin and Vinay B. Nair, Investing for Change: Profit from Responsible Investment. Oxford University Press, 2009.
Lewis, Michael, The Money Culture. Hodder & Stoughton UK, 2011.