
5
Inspecting Process Injection and API Hooking
In this chapter, we are going to explore more advanced techniques that are used by malware authors for various reasons, including bypassing firewalls, tricking reverse engineers, and monitoring and collecting user information in order to steal credit card data and for other purposes.
We will be diving into various process injection techniques, including DLL injection and process hollowing (an advanced technique that was introduced by Stuxnet), and explain how to deal with them. Later, we will look at API hooking, IAT hooking, and other hooking techniques that are used by malware authors and how to handle them.
By the end of this chapter, you will have extended your knowledge of the Windows platform and be able to analyze more complex malware. You will learn how to analyze injected code inside other processes, detect it through memory forensics, detect different types of API hooking techniques, and analyze them to detect Man-in-the-Browser (MiTB) attacks.
To make the learning process seamless, this chapter is divided into the following main sections:
- Understanding process injection
- DLL injection
- Diving deeper into process injection
- A dynamic analysis of code injection
- Memory forensics techniques for process injection
- Understanding API hooking
- Exploring IAT hooking
Understanding process injection
Process injection is one of the most well-known techniques malware authors use to bypass firewalls, perform memory forensics techniques, and slow down inexperienced reverse engineers by adding malicious functionality into legitimate processes and hiding it this way. In this section, we will cover the theory behind process injection and why it is commonly used in various Advanced Persistent Threat (APT) attacks nowadays.
What’s process injection?
In the Windows OS, processes are allowed to allocate memory, read and write in another process’s virtual address space, as well as create new threads, suspend threads, and change these threads’ registers, including the instruction pointer register (EIP/RIP). Process injection is a group of techniques that allow you to inject code blocks or whole Dynamic-Link Libraries (DLLs) into another process’s memory, as well as execute that code. In Windows 7 and beyond, it’s not permitted to perform an injection into core Windows processes such as explorer.exe or into other users’ processes. However, it’s still OK to inject code into the current user’s browsers and other processes.
This technique is legitimately used by multiple endpoint security products to monitor applications and for sandboxing purposes (as we will see in the Understanding API hooking section), but it’s also commonly misused by malware authors.
Why process injection?
For malware authors, process injection helps them to do the following:
- Bypass trivial firewalls that block internet connections from all applications except browsers or other allowed apps. By injecting code into one of these applications, malware can communicate with the Command and Control (C&C) server without any warning or being blocked by the firewall.
- Evade debuggers and other dynamic analysis or monitoring tools by running the malicious code inside another unmonitored and not debugged process.
- Hook APIs in the legitimate process that the malware injected its code into, which can give unique control over the victim process’s behavior.
- Maintain persistence for fileless malware. By injecting its code into a background process, malware can maintain persistence on a server that rarely gets rebooted without leaving its executable on a hard disk.
Now, we will dive deeper into various process injection techniques, how they work, and how to deal with them. We will start with the most simple, straightforward technique: DLL injection.
DLL injection
The Windows OS allows processes to load DLLs into other processes for security reasons, sandboxing, or even graphics. In this section, we will explore the legitimate, straightforward ways to inject a DLL into a process, as well as the other techniques that allow attackers to inject code into a process using Windows APIs.
Windows-supported DLL injection
Windows has provided special registry entries for DLLs to be loaded within every process that meets certain criteria. Many of them allow the malware DLL to be injected into multiple processes at the same time, including browsers and other legitimate processes. There are many of these registry entries available, but we will explore the most common ones here:
HKEY_LOCAL_MACHINESOFTWAREMicrosoftWindows NTCurrentVersionWindowsAppInit_DLLs
This registry entry was among the most misused registry entries by malware to inject DLL code into other processes and maintain persistence. The libraries specified here are loaded together with every process that loads user32.dll (the system library used mainly for the UI).
In Windows 7, DLLs are required to be signed, and this logic is disabled by default for Windows 8 and beyond. However, it still can be misused by setting the RequireSignedAppInit_DLLs value to False and the LoadAppInit_DLLs value to True (see the following screenshot). Attackers require administrative privileges to be able to set these entries, which can be resolved, for example, with the help of social engineering:

Figure 5.1 – Using the AppInit_DLLs registry entry to inject the malware library into different browsers
Now, let’s move to the next commonly misused registry key:
HKEY_LOCAL_MACHINESYSTEMCurrentControlSetControlSession ManagerAppCertDlls
The libraries listed in this registry entry are loaded into each process that uses at least one of the following functions:
This allows the malware to be injected into most browsers (as many of them create child processes to manage different tabs) and other applications as well. It still requires administrative privileges since HKEY_LOCAL_MACHINE is not writable for normal users on a Windows machine (Vista and above):
HKEY_CURRENT_USERSoftwareClasses<AppName>shellexContextMenuHandlers
This path loads a shell extension (a DLL file) in order to add additional features to the main Windows shell (explorer.exe). Basically, it can be misused to load the malware library as an extension to explorer.exe. This path can be easily created and modified without any administrative privileges.
There are other registry entries available that can inject the malware library into other processes, as well as multiple software solutions, such as Autoruns by Sysinternals, which allow you to see whether any of these registry entries have been exploited for malicious use on the current system:
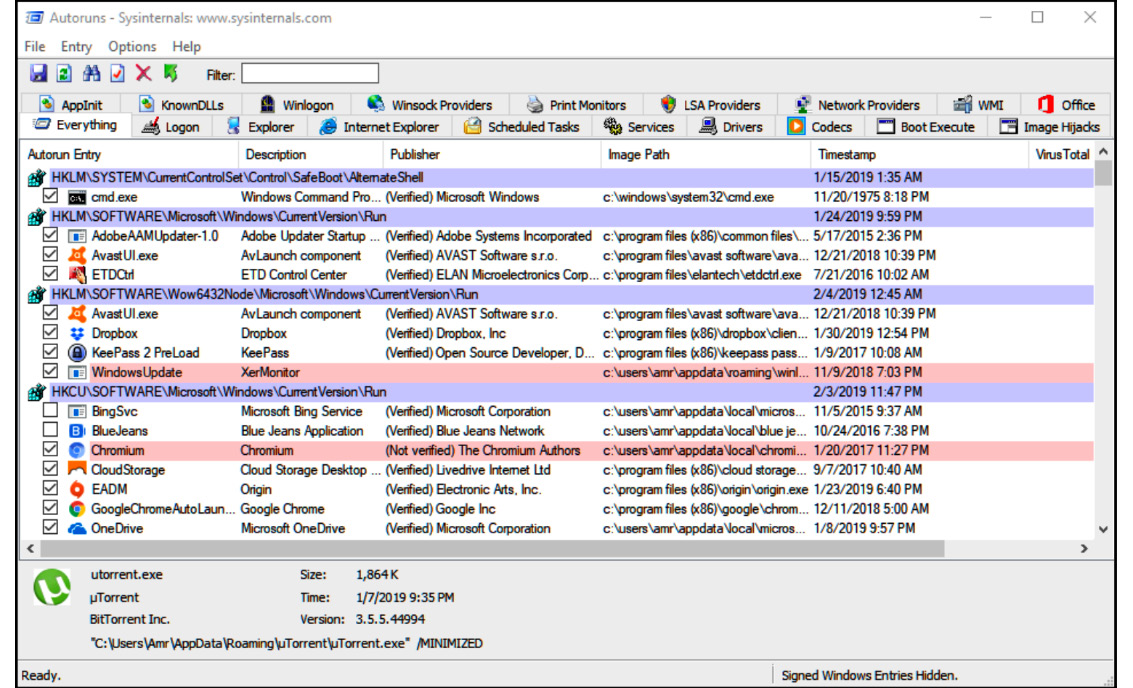
Figure 5.2 – The Autoruns application in the Sysinternals Suite
These are some of the most common legitimate ways that malware can inject its DLLs into different processes.
Important note
It is worth mentioning that many resources call this technique DLL hijacking and track it separately from classic process injection, as in this case attackers rely on the OS to perform the actual injection, rather than doing it themselves.
Now, we will explore the more advanced techniques that require the use of different Windows APIs to allocate, write, and execute malicious code inside other processes.
A simple DLL injection technique
This technique uses the LoadLibraryA API (or its other flavors) as a way to load a malicious library using the Windows PE loader and execute its entry point. The main goal is to inject the path of the malicious DLL into the process, then transfer control into that process with the address of the LoadLibraryA API as the start address. When passing the DLL path as an argument to that thread (which is passed to the LoadLibraryA API), the Windows PE loader will load that DLL into the process and execute its code flawlessly. Here is how the result memory will look:

Figure 5.3 – A simple DLL injection mechanism
The exact steps the malware generally follows are as follows:
- Find the victim process among other processes (more details in the following section).
- Get this process’s handle using the OpenProcess API as an identifier to pass to other APIs.
- Allocate a space in that process’s virtual memory using VirtualAllocEx, VirtualAllocExNuma, NtAllocateVirtualMemory, or similar APIs. This space will be used to write the full path of the malicious DLL file. Another option would be to use CreateFileMapping -> MapViewOfFile or CreateSectionEx -> NtCreateSection APIs to prepare the space.
- Write a path of the malware DLL to the process using APIs such as WriteProcessMemory, NtWriteVirtualMemory, NtWow64WriteVirtualMemory64, or with the help of NtMapViewOfSection.
- Load and execute this DLL using APIs such as CreateRemoteThread / NtCreateThreadEx, SuspendThread -> SetThreadContext -> ResumeThread, QueueUserAPC / NtQueueApcThread, or even SetWindowHookEx, providing the LoadLibraryA address as the start address, and the address of the DLL path as an argument.
Alternative APIs with similar functionality can also be used, for example, the undocumented RtlCreateUserThread API instead of CreateRemoteThread.
This technique is simple compared to the techniques that we will cover in the following sections. However, this technique leaves traces of the malicious DLL in the process information. Any simple tool such as ListDLLs from the Sysinternals Suite can help incident response engineers to detect this malicious behavior. In addition, this technique won’t work for fileless malware since the malware DLL file must be present on a hard disk before it can be loaded using LoadLibraryA.
In the next section, we will dig deeper and cover more advanced techniques. They still rely on the APIs we described earlier, but they include more steps to make process injection successful.
Diving deeper into process injection
In this section, we will cover the intermediate to advanced techniques of process injection. These techniques leave no trace on a disk and can enable fileless malware to maintain persistence. Before we cover these techniques, let’s talk about how the malware finds the process that it wants to inject into – in particular, how it gets the list of the running processes with their names and Process IDs (PIDs).
Finding the victim process
For malware to get a list of the running processes, the following steps are generally followed:
- Create a snapshot of all the processes running at that moment. This snapshot contains information about all running processes, their names, PIDs, and other important information. It can be acquired using the CreateToolhelp32Snapshot API. Usually, it is executed when TH32CS_SNAPPROCESS is given as an argument (to take a snapshot of the running processes, not threads or loaded libraries).
- Get the first process in this list using the Process32First API. This API gets the first process in the snapshot and starts the iteration over the list of processes.
- Loop on the Process32Next API to get each process in the list, one by one, with its name and PID, as shown in the following screenshot:

Figure 5.4 – Process searching using CreateToolhelp32Snapshot
Once the desired process has been found, the malware then goes to the next phase by executing the OpenProcess API with the process’s PID, as we learned in the previous section.
Code block injection
This technique is quite similar to DLL injection. The difference here is actually in the executed code inside the target process. In this technique, the malware injects a piece of assembly code (as an array of bytes) and transfers control to it directly. This piece of code is position-independent. It has the ability to load its own import table, access its own data, and execute all of the malicious activities inside the targeted process.
The steps that the malware follows for these code injection techniques are pretty much the same as the previous ones:
- Search for the targeted process (in Figure 5.4, malware skips other processes by their PIDs).
- Get this process’s handle or some other identifier.
- Prepare the memory inside this process for the size of the whole piece of the malicious code to be injected (see the VirtualAllocEx call in Figure 5.5).
- Copy that code into the targeted process (see the WriteIntoProcessMemory function in Figure 5.5).
- Transfer control to this code in the victim process’s address space (see the CreateRemoteThreadFunc routine in Figure 5.5).
Some malware gives the name or the PID of the malware process to this injected code so that it can terminate the malware (and possibly delete its file and all of its traces) to ensure there’s no clear evidence of the malware’s existence.
In the following screenshot, we can see an example of a typical code injection:

Figure 5.5 – A code injection example
It’s very similar to the DLL injection with regards to the steps that were used for process injection, but most of the hard work is in this piece of the assembly code. We will dive deeper into this type of position-independent, PE-independent code (that is, shellcode) in Chapter 8, Handling Exploits and Shellcode. We will explain how it finds its own place in memory, how it accesses the APIs, and how it performs malicious tasks.
Reflective DLL injection
In this case, instead of injecting a code block, malware injects the whole DLL into the targeted process’s memory, but this time, reading it directly from its memory rather than from a disk. In this case, the loader will be responsible for loading this payload, manually doing the job of the Windows loader.
First, malware prepares memory with the size of ImageBase and follows the PE loading steps, including importing table loading and fixing the relocation entries (in the relocation table, as we learned about in Chapter 3, Basic Static and Dynamic Analysis for x86/x64), as shown in the following screenshot:
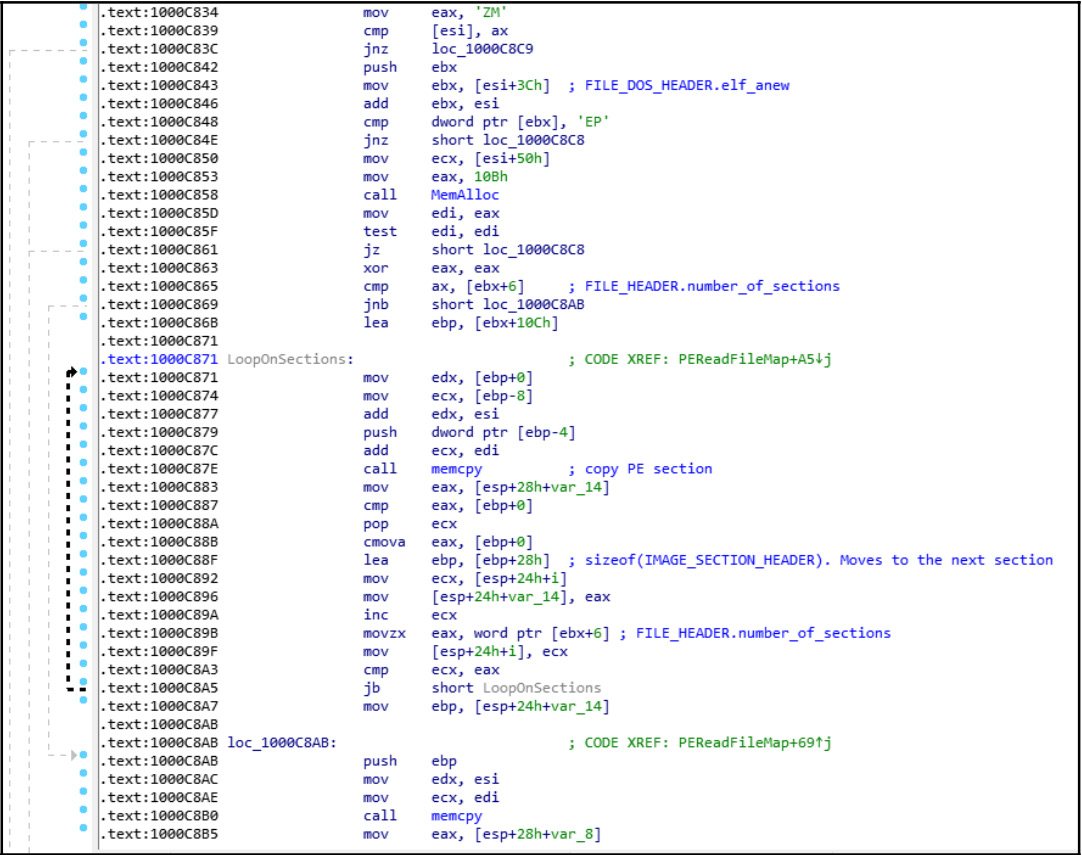
Figure 5.6 – The PE loading process in shellcode
As we can see here, each section is copied individually in the LoopOnSections loop with the help of the memcpy function. This technique looks similar in terms of results to DLL injection, but it doesn’t require the malicious DLL to be stored on the hard disk and it doesn’t leave the usual traces of this DLL inside the Process Environment Block (PEB). So, memory forensics applications that only rely on PEB to detect DLLs wouldn’t be able to detect this loaded DLL in the memory. More details can be found in the Memory forensics techniques for process injection section later.
Stuxnet secret technique – process hollowing
Hollow process injection (process hollowing) is an advanced technique that was introduced in Stuxnet malware before it became popular in the APT attacks domain. Process hollowing is simply a matter of removing the targeted process’s PE memory image from its virtual memory and replacing it with the malware executable file.
For example, the malware creates a new process of, let’s say, svchost.exe. After the process is created and the PE file of svchost is loaded, the malware removes the loaded svchost PE file from its memory and then loads the malware-executable PE file in the same place and continues execution. See the following code examples for more information.
This mechanism completely disguises the malware executable in a legitimate coat as the PEB and the equivalent EPROCESS object still holds information about the legitimate process. This helps malware to bypass firewalls and memory forensics tools.
The process of this form of code injection is quite different from the previous ones. Here are the steps that the malware has to take in order to do this:
- Create a legitimate process in the suspended mode, which creates the process and its first thread, but doesn’t start it:
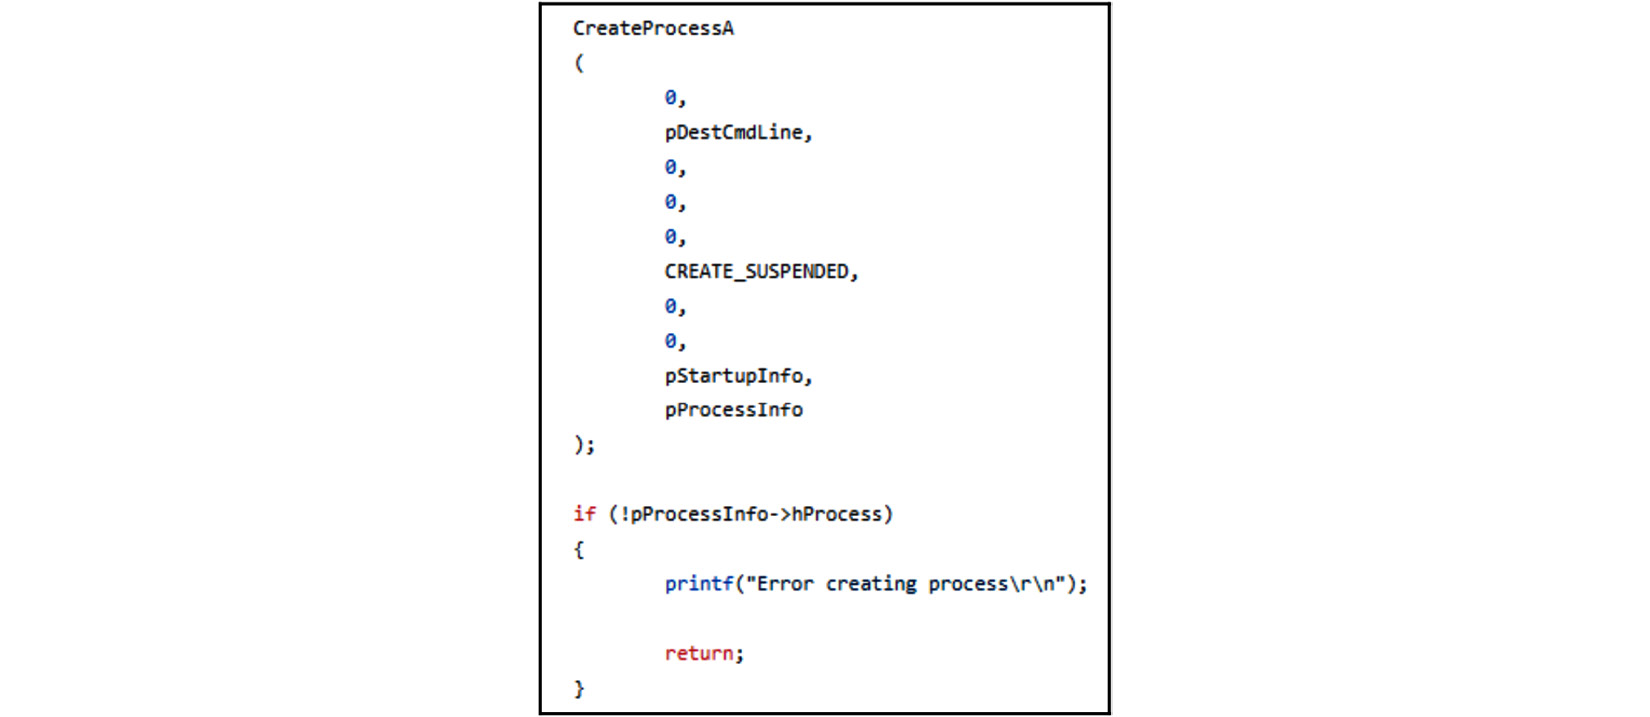
Figure 5.7 – Creating a process in suspended mode
Unload the legitimate application’s memory image using VirtualFreeEx (hollowing out the process).
- Allocate the same space in memory (the same as the unloaded PE image) for the malware PE image (APIs such as VirtualAllocEx allow the malware to choose the preferred address to be allocated if it’s free).
- Inject the malware executable into that space by loading the PE file and fixing its import table (resolving its relocation table if needed).
- Change the thread’s starting point to the malware’s entry point using the SetThreadContext API. The GetThreadContext API allows the malware to get all the registers’ values, thread state, and all of the necessary information for the thread to be resumed after this, whereas the SetThreadContext API allows the malware to change these values, including the EIP/RIP register (instruction pointer), so that it can set it to the new entry point. The last step is to resume this suspended thread to execute the malware from that point:

Figure 5.8 – SetThreadContext and ResumeThread
This is the most well-known technique of process hollowing. There are also similar techniques that don’t unload the actual process and include both the malware and the legitimate application executables together.
Now, we will have a look at how we can extract the injected code and analyze it in our dynamic analysis process or in our memory forensics process.
A dynamic analysis of code injection
The dynamic analysis of process injection is quite tricky. The malware escapes the debugged process into another one in order to run the shellcode or load the DLL. Here are some tricks that may help you to debug the injected code.
Technique 1 – Debug it where it is
The first technique, which is preferred by many engineers, is not to allow the malware to inject the shellcode but rather to debug the shellcode in the malware’s memory as if it were already injected. Generally, the malware injects its shellcode inside another process and executes it from a specific point in that shellcode. We can locate that shellcode inside the malware’s binary (or memory if it gets decrypted) and just set the EIP/RIP register (New origin here in OllyDbg) to this shellcode’s entry point and continue the execution from there. This allows us to execute the shellcode inside a debugged process and even bypass some checks for the name of the process that this shellcode is supposed to run in.
The steps to perform this technique are as follows:
- Once the malware calls APIs such as VirtualAllocEx to prepare space for the shellcode in the targeted process memory, save the returned address of that allocated space (let’s say the returned address was 0x300000).
- Set a breakpoint on memory writing APIs such as WriteProcessMemory and, once it triggers, save the source and the destination addresses. The source address is the address of that shellcode inside the malware process’s memory (let’s say 0x450000) and the destination will probably be the returned address from VirtualAllocEx.
- Now, set a breakpoint on the control transfer APIs such as CreateRemoteThread and get the entry point (and the arguments, if there are any) of that shellcode in the targeted process (let’s say it will be 0x30012F).
- Now, calculate the entry point’s address inside the malware process’s memory, which will be 0x30012F - 0x300000 + 0x450000 = 0x45012F in this case.
- If a virtual machine is used for debugging (which is definitely recommended), save a snapshot and then set the EIP value to the shellcode’s entry point (0x45012F), set any necessary arguments, and continue debugging from there.
This technique is very simple and easy to debug and handle. However, it only works with simple shellcodes and doesn’t work properly with multiple injections (multiple calls of WriteProcessMemory), process hollowing, or with complicated arguments. It needs cautious debugging afterward in order to not receive bugs or errors from having this shellcode running in a process that’s different from what it was intended to be executed in.
Technique 2 – Attach to the targeted process
Another simple solution is to attach to the targeted process before the malware executes CreateRemoteThread or to modify the CreateRemoteThread creation flags to CREATE_SUSPENDED, as follows:
CreateRemoteThread(Process, NULL, NULL, (LPTHREAD_START_ROUTINE)LoadLibrary, (LPVOID)Memory, CREATE_SUSPENDED, NULL);
To be able to do so, we need to know the targeted process that the malware will inject into. This means that we need to set breakpoints on the Process32First and Process32Next APIs and analyze the code in between searching for the APIs, such as strcmp or equivalent code, to find the required process to inject into. Not all calls are just for process injection; for example, they can also be used as an anti-reverse engineering trick, as we will see in Chapter 6, Bypassing Anti-Reverse Engineering Techniques.
Technique 3 – Dealing with process hollowing
Unfortunately, the previous two techniques don’t work with process hollowing. In process hollowing, the malware creates a new process in a suspended state, which makes it unseen by OllyDbg and similar debuggers. Therefore, it’s hard to attach to them before the malware resumes the process and the malicious code gets executed, undebugged, and unmonitored.
As we already mentioned, in process hollowing, the malware hollows out the legitimate application PE image and loads the malicious PE image inside the targeted process memory. The simplest way to deal with this is to set a breakpoint on memory writing APIs, such as WriteProcessMemory, and dump the PE file before it’s loaded into the targeted process memory. Once the breakpoint is triggered, follow the source argument of WriteProcessMemory, and scroll up until the start of the PE file is found (usually, it can be recognized by the MZ signature and common This program cannot run in DOS mode text, which is shown in the following screenshot):
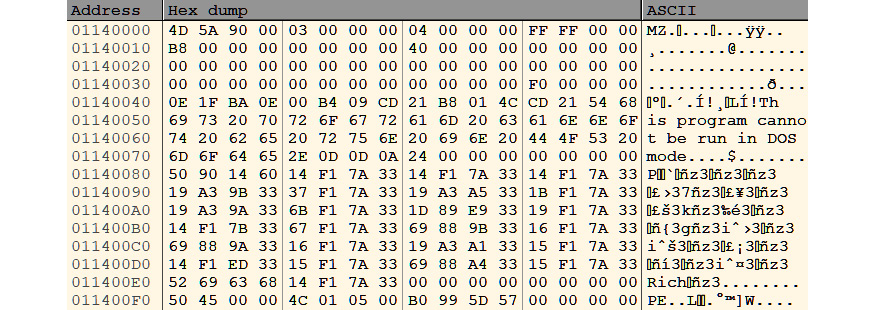
Figure 5.9 – A PE file in a hex dump in OllyDbg
Some malware families use CreateSection and MapViewOfSection instead of WriteProcessMemory. These two APIs, as we described earlier, create a memory object that we can write the malicious executable into. This memory object can also be mapped to another process as well. So, after the malware writes the malicious PE image to the memory object, it maps it into the targeted process and then uses APIs such as CreateRemoteThread to start the execution from its entry point. In this case, we can set a breakpoint on MapViewOfSection to get the returned address of the mapped memory object (before the malware writes any data to this memory object).
Now, it is possible to set a breakpoint-on-write to this returned address in order to catch any writing operation to this memory object (writing to this memory object is equivalent to WriteProcessMemory).
Once your breakpoint-on-write hits, we can find what data is getting written to this memory object (most probably a PE file in the case of process hollowing) and the source of the data that contains all the PE files that are unloaded, so that we can easily dump it to the disk and load it into the debugger as if it were injected into another process.
This technique, in brief, is all about finding the PE file before it gets loaded and dumping it as a normal executable file. Once we get it, we get the second stage payload. Now, all we need to do is debug it in the debugger or analyze it statically.
Now, we will take a look at how to detect and dump the injected code (or injected PE file) from a memory dump using a memory forensics tool called Volatility, which may get even more complicated than dealing with process injection using dynamic analysis.
Memory forensics techniques for process injection
Since one of the main reasons to use process injection is to hide malware presence from memory forensics tools, it gets quite tricky to detect it using them. In this section, we will take a look at different techniques that we can use to detect different types of process injections.
Here, we will be using a tool called Volatility. This tool is a free, open source program for memory forensics that can analyze memory dumps from infected machines. So, let’s get started.
Technique 1 – Detecting code injection and reflective DLL injection
The main red flag that helps us to detect injected code inside a process is that the allocated memory that contains the shellcode or the loaded DLL always has the EXECUTE permission and doesn’t represent a mapped file. When a module (an executable file) gets loaded using the Windows PE loader, it gets loaded with an IMAGE flag to represent that it’s a memory map of an executable file. But when this memory page is allocated normally using VirtualAlloc, it gets allocated with a PRIVATE flag to show that it is allocated for data:
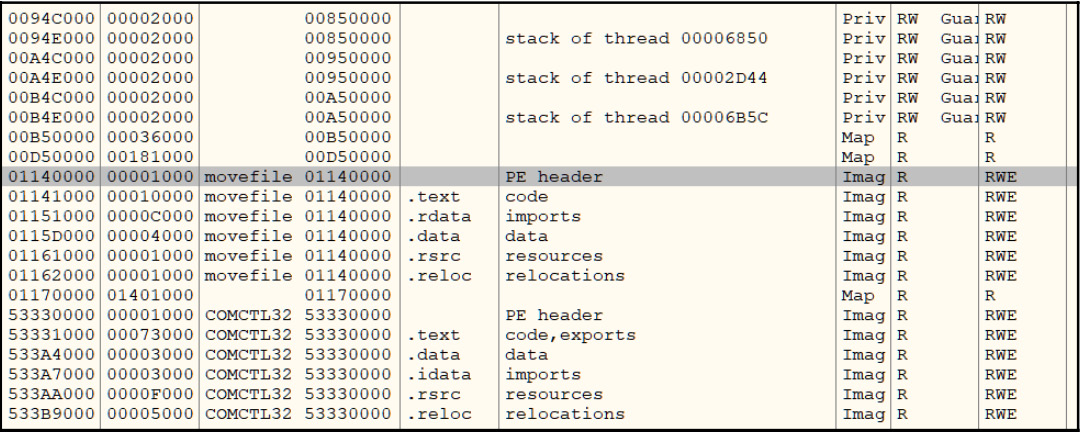
Figure 5.10 – An OllyDbg memory map window (the loaded image memory chunk and private memory chunk)
It’s not common to see private allocated memory with the EXECUTE permission, and it’s also not common (as most shellcode injections do) to have the WRITE permission with the EXECUTE permission (READ_WRITE_EXECUTE).
In Volatility, there is a command called malfind. This command finds hidden and injected code inside a process (or an entire system). This command can be executed (given the image name and the OS version) with a PID as an argument if the scan for a specific process is required, or without a PID in order to scan an entire system, as shown in the following screenshot:

Figure 5.11 – The malfind command in Volatility detects a PE file (by the MZ header)
As we can see, the malfind command detected an injected PE file (by the MZ header) inside an Adobe Reader process at the address 0x003d0000.
Now, we can dump all memory images inside this process using the vaddump command. This command dumps all the memory regions inside the process, following the EPROCESS kernel object for that process and its virtual memory map (and its equivalent physical memory pages), using what are called Virtual Address Descriptors (VADs), which are simply mappers between virtual memory and their equivalent physical memory. vaddump will dump all of the memory regions into a separate file, as shown in the following screenshot:

Figure 5.12 – Dumping the 0x003d000 address using the vaddump command in Volatility
For injected PE files, we can dump them to the disk (and reconstruct their headers and sections back, but not import the tables) using dlldump instead of vaddump, as shown in the following screenshot:

Figure 5.13 – Using dlldump given the PID and ImageBase of the DLL as --base
After that, we will have a memory dump of the malware PE file (or shellcode) to scan and analyze. It’s not a perfect dump, but we can scan it with the strings tool or perform static analysis on it. We may need to fix the addresses of the import table manually by patching these addresses in the debugger and dumping them again or directly debugging them.
Technique 2 – Detecting process hollowing
When the malware hollows out the application PE image from its process, Windows removes any connections between this memory space and the PE file of that application. So, any allocation at that address becomes private and doesn’t represent any loaded image (or PE file).
However, this detachment only happens in the EPROCESS kernel object and not in the PEB information that is accessible inside the process memory. In Volatility, there are two commands that you can use to get a list of all of the loaded modules inside a process. One command lists the loaded modules from the PEB information (from user mode), which is dlllist, and the other one lists all loaded modules from the EPROCESS kernel object information (kernel mode), which is ldrmodules. Any mismatch in the results between both commands could represent a hollow process injection, as shown in the following screenshot:
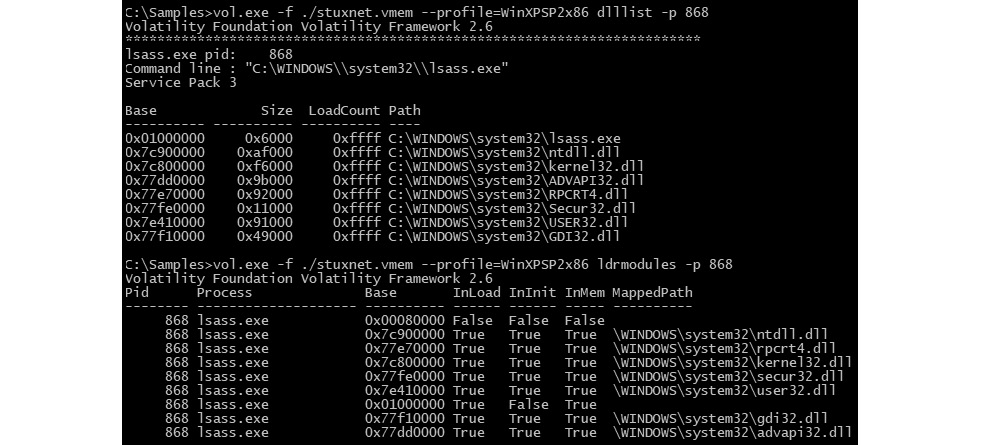
Figure 5.14 – lsass.exe at the 0x01000000 address is not linked to its PE file in ldrmodules
There are multiple types of mismatches, and they represent different types of process hollowing, such as the following:
- When the application module is not linked to its PE file, as in Figure 5.14, it represents that the process is hollowed out and that the malware has been loaded in the same place.
- When the application module appears in the dlllist results and not at all in the ldrmodules results, it represents that the process is hollowed out and that the malware is possibly loaded at another address. The malfind command could help us to find the new address or dump all the memory regions in that process using vaddump and scan them for PE files (search for MZ magic).
- When the application appears in the results of both commands and is linked with the PE filename of the application, but there’s a mismatch of the module address in both results, it represents that the application is not hollowed out, but that the malware has been injected and PEB information has been tampered with to link to the malware instead of the legitimate application PE image.
In all of these cases, it shows that the malware has injected itself inside this process using the process hollowing technique, and vaddump or procdump will help to dump the malware’s PE image.
Technique 3 – Detecting process hollowing using the HollowFind plugin
There is a plugin called HollowFind that combines all of these commands. It finds a suspicious memory space or evidence of a hollowed-out process and returns these results, as shown in the following screenshot:

Figure 5.15 – The HollowFind plugin for detecting hollow process injection
This plugin can also dump the memory image into a chosen directory:

Figure 5.16 – The HollowFind plugin for dumping the malware’s PE image
So, that’s it for process injection and how to analyze it dynamically using OllyDbg (or any other debugger), as well as how to detect it in a memory dump using Volatility.
In the following section, we will cover another important technique that’s used by malware authors, known as API hooking. It’s usually used in combination with process injection for MITM attacks or for hiding malware presence using user-mode rootkits techniques.
Understanding API hooking
API hooking is a common technique that’s used by malware authors to intercept calls to Windows APIs in order to change the input or output of these commands. It is based on the process injection technique that we described earlier.
This technique allows malware authors to have full control over the target process and therefore the user experience from their interaction with that process, including browsers and website pages, antivirus applications and their scanned files, and so on. By controlling the Windows APIs, the malware authors can also capture sensitive information from the process memory and the API arguments.
Since API hooking is used by malware authors, it has different legitimate reasons to be used, such as malware sandboxing and backward compatibility for old applications.
Therefore, Windows officially supports API hooking, as we will see later in this chapter.
Why API hooking?
There are multiple reasons why malware would incorporate API hooking in its arsenal. Let’s go into the details of this process and cover the APIs that malware authors generally hook in order to achieve their goals:
- Hiding malware presence (rootkits): For the malware to hide its presence from users and antivirus scanners, it may hook the following APIs:
- Process listing APIs such as Process32First and Process32Next, so that it can remove the malware process from the results
- File listing APIs such as FindFirstFileA and FindNextFileA
- Registry enumeration APIs such as RegQueryInfoKey and RegEnumKeyEx
- Stealing banking details (banking Trojans): For the malware to capture HTTP messages, inject code into a bank home page, and capture sent username and pin codes, it usually hooks the following APIs:
- Other uses: Hooking CreateProcessA, CreateProcessAsUserA, and similar APIs to inject into child processes or prevent some processes from starting. Hooking LoadLibraryA and LoadLibraryExA is also possible.
Both the A and W versions of WinAPIs (for ANSI and Unicode, respectively) can be hooked in the same way.
Working with API hooking
In this section, we will look at different techniques for API hooking, from the simple methods that can only alter API arguments to more complex ones that were used in different banking Trojans, including Vawtrak.
Inline API hooking
To hook an API, the malware generally prefers to modify the first few bytes (typically, this is 5 bytes) of the API assembly code and replace them with jmp <hooking_function> so that it can change the API arguments and maybe skip the call to this API and return a fake result (as an error or just NULL). The code change generally looks as follows before hooking:
API_START:
mov edi, edi
push ebp
mov ebp, esp
...
Then, after hooking, it looks as follows:
API_START:
jmp hooking_function
...
So, the malware replaces the first 5 bytes (which, in this case, are three instructions) with one instruction, which is jmp to the hooked function. Windows supports API hooking and has added an extra instruction, mov edi, edi, which takes 2 bytes of space, which makes the function prologue 5 bytes in size. This makes API hooking a much easier task to perform.
The hooking_function routine saves the replaced 5 bytes at the beginning of the API and uses them to call the API back, for example, as follows:
hooking_function:
...
<change API parameters>
...
mov edi, edi
push ebp
mov ebp, esp
jmp API+5 ; jump to the API after the first replaced 5 bytes
This way, hooking_function can work seamlessly without affecting the program flow. It can alter the arguments of the API and therefore control the results, and it can directly execute ret to the program without actually calling the API.
Inline API hooking with a trampoline
In the previous simple hooking function, the malware can alter the arguments of the API. But when you’re using trampolines, the malware can also alter the return value of the API and any data associated with it. The trampoline is simply a small function that only executes jmp to the API and includes the first missing 5 bytes (or three instructions, in the previous case), as follows:
trampoline:
mov edi, edi
push ebp
mov ebp, esp
jmp API+5 ; jump to the API after the first replaced 5 bytes
Rather than jumping back to the API, which returns control to the program in the end, the hooking function calls the trampoline as a replacement of the API. This trampoline transfers control to the actual API, but when it finishes execution, the control will be transferred back to the hooking function with the return value of the API to be altered by the hooking function before returning control back to the program, as shown in the following screenshot:
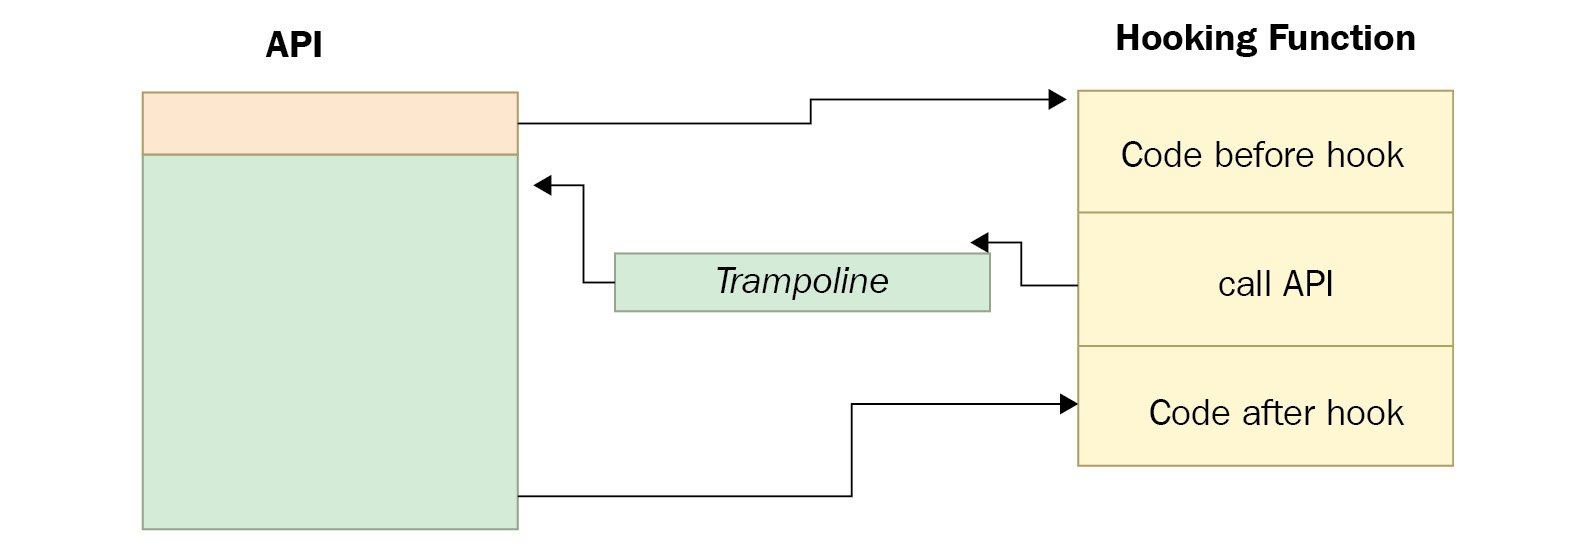
Figure 5.17 – A hooking function with a trampoline
The code of the hooking function looks more complex:
hooking_function:
...
<change API parameters>
...
push API_argument03
push API_argument02
push API_argument01
call trampoline ; trampoline routine will execute jmp to the API, and, once done, the API will return control back here
...
<change API return value>
...
ret ; return control back to the main program
This added step gives the malware more control over the API and its output, which makes it possible, for example, to inject JavaScript code into the output of InternetReadFile, PR_Read, or other APIs to steal credentials or transfer money to a different bank account.
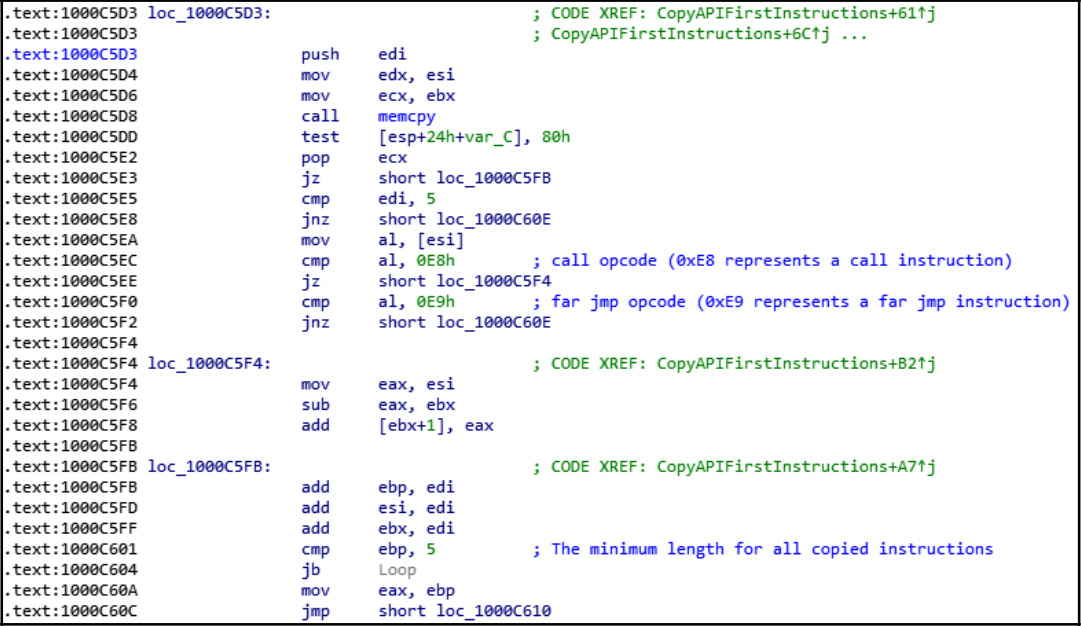
Inline API hooking with a length disassembler
As we have seen in the previous techniques, API hooking is quite simple when you use the mov edi, edi instruction at the beginning of each API, which makes the first 5 bytes predictable for API hooking functionality. Unfortunately, this can’t be the case with all Windows APIs, so sometimes malware families have to disassemble the first few instructions to avoid breaking the API.
Some malware families such as Vawtrak use a length disassembler to replace a few instructions (with a size equal to or greater than 5 bytes) with the jmp instruction to the hooking function, as shown in the following screenshot. Then, they copy these instructions to the trampoline and add a jmp instruction to the API:
F
Figure 5.18 – The Vawtrak API hooking with a disassembler
The main goal of this is to ensure that the trampoline doesn’t jump back to the API in the middle of the instruction and to make the API hooking work seamlessly without any unpredictable effects on the hooked process behavior.
Detecting API hooking using memory forensics
As we already know, API hooking is generally used together with process injection, and dealing with API hooking in dynamic analysis and memory forensics is very similar to dealing with process injections. Adding to the previous techniques of detecting process injection (using malfind or hollowfind), we can use a Volatility command called apihooks. This command scans the process’s libraries, searching for hooked APIs (starting with jmp or a call), and shows the name of the hooked API and the address of the hooking function, as shown in the following screenshot:

Figure 5.19 – The Volatility command, apihooks, for detecting API hooking
We can then use vaddump (as we described earlier in this chapter) to dump this memory address and use IDA Pro or any other static analysis tool to disassemble the shellcode and understand the motivation behind this API hooking.
Finally, let’s talk about IAT hooking.
Exploring IAT hooking
Import Address Table hooking (IAT hooking) is another form of API hooking that is not used as often. This hooking technique doesn’t require any disassembler, code patching, or trampoline. The idea behind it is to modify the import table’s addresses so that they point to the malicious hooking functions rather than the actual API. In this case, the hooking function executes jmp on the actual API address (or the call after pushing the API arguments to the stack), and then returns to the actual program, as shown in the following diagram:

Figure 5.20 – The IAT hooking mechanism
This hooking is not effective against the dynamic loading of APIs (using GetProcAddress and LoadLibrary), but it’s still effective against many legitimate applications that have most of their required APIs in the import table.
Summary
In this chapter, we have covered two very well-known techniques that are used by many malware families: process injection and API hooking. These techniques are used for many reasons, including disguising the malware, bypassing firewalls, maintaining persistence for fileless malware, MITB attacks, among others.
We have covered how to deal with code injection using dynamic analysis, as well as how to detect code injection and API hooking and how to analyze them using memory forensics.
After reading this chapter, you will now have a greater understanding of complex malware and how it can be injected into legitimate processes. This will help you to analyze cyberattacks incorporating various techniques and protect your organization from future threats more effectively.
In Chapter 6, Bypassing Anti-Reverse Engineering Techniques, we will cover other techniques that are used by malware authors to make it harder for reverse engineers to analyze samples and understand their behavior.