As a database administrator, it is your job to make sure that SQL Server runs smoothly. To ensure that SQL Server is running optimally, you can actively monitor the server to:
Keep track of user connections and locks.
View processes and commands that active users are running.
Check the status of locks on processes and objects.
See blocked or blocking transactions.
Ensure that processes complete successfully and detect errors if they do not.
When problems arise, you can terminate a process, if necessary.
Note
For more coverage of monitoring SQL Server, see Chapter 13. In that chapter, you will learn how to use Performance Monitor and SQL Server Profiler to keep track of SQL Server activity, performance, and errors.
Process information provides detailed information about the status of processes, current user connections, and other server activity. You can view process information by completing the following steps:
Start SQL Server Management Studio, and then connect to a server.
Use Object Explorer view to access a database. Expand the server node and the Management node.
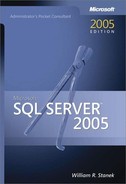
Under the Management node, double-click Activity Monitor. You should see a summary of process activity similar to the report shown in Figure 5-13.

Tip
By default, process information is not updated automatically. To refresh the information, click Refresh on the toolbar. To configure automatic refresh, click the View Refresh Settings link under Status. In the Refresh Settings dialog box, select Auto-Refresh Every. After you set the refresh interval, click OK.
Initially, processes are sorted by process ID, but you can arrange them by any of the available information categories summarized in Table 5-2. Click a category header to sort processes based on that category. Click the same category header again to perform a reverse sort on the category.
Table 5-2. Process Information Used in Database Administration
Category | Description |
|---|---|
Process ID | Provides the server process ID of the current user process. |
System Process | Indicates if the process is a system process. |
User | Shows which user is running the process by SQL Server ID or domain account, depending on the authentication technique used. |
Database | Indicates the database with which the process is associated. |
Status | Shows the status of the process, which is usually runnable, sleeping, or background. A runnable process is active. A sleeping process is waiting for input or a lock. A background process is running in the background and periodically performing tasks. |
Open Transactions | Shows the number of open transactions. |
Command | Displays the command being executed or the last command executed. |
Application | Shows the application or SQL Server component connecting to the server and running the process, such as Report Server. |
Wait Time | Indicates the elapsed wait time in milliseconds. |
Wait Type | Specifies whether the process is waiting or not waiting. |
Resource | Displays the resource that the process is waiting for (if any). |
CPU | Shows the amount of processor time (in milliseconds) used by the process. |
Physical I/O | Indicates the physical input/output used by the process. |
Memory Usage | Displays the amount of memory the process is using (in KB). |
Login Time | Indicates when the connection was established. |
Last Batch | Indicates when the last command was executed using the connection. |
Host | Displays the host from which the connection originated. |
Net Library | Shows the network library used to establish the connection. |
Net Address | Shows the network address for the connection. |
Blocked By | Displays the Process ID blocking this process. |
Blocking | Displays the Process ID waiting for this process to finish. |
Execution Context | Indicates the execution context of the process. |
Locks can be tracked by process ID and object. Either technique provides the same information, but each method presents the information in a different way. You can view locks by process ID or object by completing the following steps:
Start SQL Server Management Studio, and then connect to a server.
Use Object Explorer view to access a database. Expand the server node and the Management node.
Under the Management node, double-click Activity Monitor to start the Activity Monitor.
With processes, you can view a summary of all objects the process is locking. Under Select A Page, click Locks By Process, and then in the right pane, select the process ID you want to examine, such as 51.
With objects, you can see a list of all processes with locks on the object. Under Select A Page, click Locks By Object, and then select the database object you want to examine, such as (internal).
Lock statistics are not updated automatically, and you will occasionally have to refresh the view. To do this, click Refresh on the toolbar.
Although locks by process ID and locks by object are presented in a slightly different manner, the information is almost identical. With process ID, you see a list of objects that the process has a lock on. With objects, you see a list of processes that have locks on the object. You will also see information on the type, status, and mode of the lock, as well as information about the lock owner, the resource being locked, and the index being locked (if applicable). The available lock-related information is summarized in Table 5-3.
Table 5-3. Lock-Related Information Used in Database Administration
Type | Description | |
|---|---|---|
Process ID | The server process ID of the related user process. | |
Context | The ID of the thread associated with the process ID. | |
Batch ID | The batch ID associated with the process ID. | |
Type | RID | Row identifier; used to lock a single row within a table. |
KEY | A row lock within an index; used to protect key ranges. | |
PAGE | A lock on a data or index page. | |
EXTENT | A lock on a contiguous group of eight data or index pages. | |
TABLE | A lock on an entire table, including all data and indexes. | |
DATABASE | A lock on an entire database. | |
METADATA | A lock on descriptive information about the object. | |
Subtype | The lock subtype, frequently used with METADATA locks to identify metadata lock activity. | |
Description | Optional descriptive information. | |
Request Mode | S | Shared; used for read-only operations, such as a select statement. |
U | Update; used when reading/locking an updateable resource. Prevents some deadlock situations. | |
X | Exclusive; allows only one session to update the data. Used with the modification operations, such as INSERT, DELETE, and UPDATE. | |
I | Intent; used to establish a lock hierarchy. | |
Sch-S | Schema stability; used when checking a table’s schema. | |
Sch-M | Schema modification; used when modifying a table’s schema. | |
BU | Bulk update; used when bulk copying data into a table and the TABLOCK hint is specified. | |
RangeS_S | Serializable range scan; used with shared resource locks on shared ranges. | |
RangeS_U | Serializable update; used updating resource locks on shared ranges. | |
RangeI_N | Insert range with a null resource lock; used to test ranges before inserting a new key into an index. | |
RangeX_X | Exclusive range with an exclusive lock; used when updating a key in a range. | |
Request Type | The type of object requested. | |
Request Status | GRANT | The lock was obtained. |
WAIT | The lock is blocked by another process. | |
CNVT | The lock is being converted; that is, it is held in one mode but waiting to acquire a stronger lock mode. | |
Owner Type | CURSOR | The lock owner is a cursor. |
SESSION | The lock owner is a user session. | |
TRANSACTION | The lock owner is a transaction. | |
SHARED_TRANSACTION _WORKSPACE | The lock owner is the shared portion of the transaction workspace. | |
EXCLUSIVE_TRANSACTION _WORKSPACE | The lock owner is the exclusive portion of the transaction workspace. | |
Owner ID | The owner ID associated with the lock. | |
Owner GUID | The GUID of the owner associated with the lock. | |
Database | The database containing the lock. | |
Object | The name of the object being locked. |
Two common problems you may encounter are deadlocks and blocking connections. Deadlocks and blocking connections can occur in almost any database environment, especially when many users are making connections to databases.
Deadlocks occur when two users have locks on separate objects and each wants a lock on the other’s object. Each user waits for the other user to release the lock, but this does not happen.
Blocking connections occur when one connection holds a lock and a second connection wants a conflicting lock type. This forces the second connection either to wait or to block the first.
Both deadlocks and blocking connections can degrade server performance.
Although SQL Server can detect and correct deadlock and blocking situations, you can help speed up this process by identifying potential problems and taking action, if necessary. Process information can tell you when deadlocks or blocking occur. Examine these process information columns: Wait Time, Wait Type, Resource, Blocking, and Blocked By. When you have a deadlock or blocking situation, take a closer look at the locks on the objects that are causing problems. Refer to the section titled "Tracking Locks by Process ID and Object" earlier in this chapter for details. You may also want to stop the offending processes, and you can do this by following the steps described in the section titled "Killing Server Processes" later in this chapter.
Sometimes you will want to track the commands that users are executing. You can do this by using the Current Activity resource viewer:
Start SQL Server Management Studio, and then connect to a server.
Use Object Explorer view to access a database. Expand the server node and the Management node.
Under the Management node, double-click Activity Monitor to start the Activity Monitor. The Last Refresh entry under Status shows a date and time when the activity snapshot was taken.
Select Process Info. The entries in the User column can help you track user sessions and the processes they are using.
Double-click a process to display the dialog box shown in Figure 5-14. This dialog box shows the last command batch executed by the user.
To track current commands being executed by the user, click Refresh periodically.
To kill the process, click Kill Process. Then, when prompted, choose Yes.

You may need to stop processes that are blocking connections or are using too much CPU time. To do this, complete the following steps:
Start SQL Server Management Studio, and then connect to a server.
Use Object Explorer view to access a database. Expand the server node and the Management node.
Under the Management node, double-click Activity Monitor to start the Activity Monitor. The Last Refresh entry shows a date and time when the activity snapshot was taken.
Select Process Info, and then right-click the process you want to stop.
From the shortcut menu, choose Kill Process. Then, when prompted, click Yes.