Whether you are trying to track user activity, troubleshoot connection problems, or optimize SQL Server, SQL Server Profiler is one of the best utilities available. Profiler enables you to trace events that occur in SQL Server. Events you can track in Profiler are similar to counters you can monitor in Performance Monitor. They are organized into groups called event classes, and you can track one or more events for any of the available event classes. The strengths of Profiler are its advanced features and extensive customization capabilities.
You can record and replay Profiler traces when you want to analyze the data—and this is one area in which Profiler excels. You can:
Use the information to find slow-running queries and then determine what is causing the queries to run slowly.
Go through statements a step at a time to find the cause of a problem.
Track a series of statements that cause a particular problem, and then replay the trace on a test server to determine the cause.
Use trace information to determine the cause of deadlocks.
Monitor user and application activity to determine actions that are using CPU time or queries that are taking a long time to process.
Let’s look at how you can work with Profiler. Then I will examine how to create and manage traces.
You can start Profiler in two ways. You can:
Click Start | Programs or All Programs | Microsoft SQL Server 2005 | Performance Tools, and then choose SQL Server Profiler.
In SQL Server Management Studio, select SQL Server Profiler from the Tools menu.
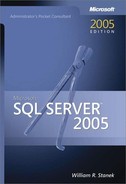
Figure 13-14 shows Profiler in the process of running a trace. The columns shown for the trace, such as Event Class, are completely configurable when you are setting up the trace, allowing you to select or clear columns as necessary. Two columns you will want to pay particular attention to are Duration and CPU. The Duration column shows how long a particular event has been running in milliseconds. The CPU column shows the amount of CPU processing time the event requires in milliseconds.

Stored procedures provide an alternative to Profiler. Using these stored procedures gives you some options that you do not have with SQL Server Profiler. You can:
Store traces in the Windows application log.
Autostart a trace when SQL Server starts.
Forward event data to another computer running SQL Server (Windows only).
To create traces with stored procedures, complete the following steps:
You use traces to record events generated by local and remote SQL servers. You run traces in the Profiler window and store them for later analysis.
To start a new trace, complete the following steps:
Start SQL Server Profiler, and then click the New Trace button. Or select File | New Trace.
Use the Connect To Server dialog box to connect to the server you want to trace.
You will see the Trace Properties dialog box.
In the Trace Name text box, type a name for the trace, such as Data Trace or Deadlock Trace For CustomerDB.
You can store traces as they are being created by setting the Save To File or the Save To Table option, or both. Or you can store a running trace later by selecting File, then selecting Save As, and then choosing either the Trace File option or the Trace Table option.
Tip
There are advantages and disadvantages to using trace files and trace tables. You can use trace files to store traces quickly and efficiently using minimal system resources. Trace tables make it easy to store a trace directly in a table on another server, but you use much more of the system resources and usually have slower response times. Note also that storing a trace only saves the trace data. It does not save the trace definition. To reuse the trace definition, you will have to export the trace definition.
SQL Profiler templates are used to save trace definitions that contain the events, data columns, and filters used in a trace. Use the Template Name drop-down list to choose a template to use as the basis of the trace. Select the TSQL_Replay template if you want to replay the trace.
Click the Events Selection tab, as shown in Figure 13-16. The currently selected template determines the events that are selected for tracking by default. The best way to learn the types of events you can trace is to select each event or event class and read its description at the bottom of the Events tab. Move the pointer to a specific column to see details about that data column.
Only a subset of the traceable events and event classes is displayed by default. To see all event classes available, select Show All Events. The event classes that can be traced include Broker, CLR, Cursors, Database, Deprecation, Errors And Warnings, Full Text, Locks, OLEDB, Objects, Performance, Progress Report, Query Notifications, Scans, Security Audit, Server, Sessions, Stored Procedures, TSQL, Transactions, and User Configurable.
Only a subset of the traceable data columns is displayed by default. To see all data columns, select Show All Columns.
Select event subclasses to add to the trace. If you select a subclass, all data columns for that class are tracked.
As necessary, select individual data columns for event subclasses to track specific data columns for an event subclass (versus all data columns for a subclass). At a minimum you must track:
Cursors, CursorExecute
Cursors, CursorOpen
Cursors, CursorPrepare
Sessions, ExistingConnection
Stored Procedures, RPC:OutputParameter
Stored Procedures, RPC:Starting
TSQL, Exec Prepared SQL
TSQL, Prepare SQL
TSQL, SQL:BatchStarting
Tip
If you are tracking distributed queries, be sure to add the HostName column that corresponds to the ServerName in the display window. For transactions, be sure to add the TransactionID column. Also, if you plan to replay the trace for troubleshooting, refer to the subsection titled "Replaying a Trace" later in this chapter for specific event classes and data columns that you need to select.
To focus the trace on specific types of data, you may want to set criteria that exclude certain types of events. If so, select an event category you want to filter, click the Column Filters button to open the Edit Filter dialog box, and then set filter criteria. For each event category, you can use different filtering criteria. To use the criteria, you click on the related plus sign, and then enter the appropriate value in the text box provided. (When you are finished, click Close to close the Edit Filter dialog box.) You use the filter criteria as follows:
Equals, Not Equal To, Greater Than Or Equal, or Less Than Or Equal. Use these criteria to set the values that trigger the event. Events with values outside the specified range are excluded. For example, with the CPU event category you can specify that only events using greater than or equal to 1000 milliseconds of CPU time are captured. If events use less CPU time than specified, they are excluded.
Like or Not Like. Enter strings to include or exclude for this event category. Use the wildcard character (%) to match a series of characters. Use the semicolon (;) to separate multiple strings. For example, you can use the Application Name category to exclude all application names that start with MS and SQL Server by typing MS%;SQL Server%.
When you are finished configuring the trace, click Run to start the trace.
Profiler displays information for multiple traces in separate windows that can be cascaded or tiled. Use the buttons on the Profiler toolbar to control work with traces. Create a new trace by clicking the New Trace button, and then use the options in the New Trace dialog box to configure the trace. Create a trace template by clicking New Template, setting trace properties, and then clicking Save. Once you have an active trace:
Start the trace by clicking the Start Selected Trace button.
Pause the trace by clicking the Pause Selected Trace button. You can then use the Start Selected Trace button to resume the trace at the point at which it was stopped.
Stop the trace by clicking the Stop Selected Trace button. If you start the trace again with the Start Selected Trace button, the Profiler displays data again from the beginning of the trace process; new data is appended to the files or tables to which you are capturing data.
Edit trace properties by clicking the Properties button.
When you create traces in Profiler, you create trace data and trace definitions. The Profiler window displays trace data, and you can also store it in a file or a table, or both. The trace data records a history of events that you are tracking, and you can use this history to replay the events for later analysis. The Trace Properties dialog box displays the trace definition. You can use the trace definition to create a new trace based on the existing trace.
To save trace data, complete the following steps:
Access the Profiler window that displays the trace you want to save.
Select File, point to Save As, and then select Trace File or Trace Table.
Use the Save As dialog box to select a folder location. Type a file name, and then click Save. Trace files end with the .trc extension.
To save a trace definition, complete the following steps:
Access the Profiler window that displays the trace with the definition you want to save.
Select File, point to Save As, and then select Trace Template.
Use the Select Template Name dialog box to select a folder location. Type a file name, and then click Save. Trace templates end with the .tdf extension.
One of the main reasons you will want to create traces is to save them and replay them later. When replaying traces, Profiler can simulate user connections and authentication, which allows you to reproduce the activity recorded in the trace. You can replay traces in different ways to help you troubleshoot different kinds of problems:
Execute traces step by step to closely monitor each step in the trace.
Execute traces using the original timeline to simulate user loads.
Execute traces with a high replay rate to stress test servers.
As you monitor the trace execution, you can look for problem areas. Then, when you identify the cause of problems you are trying to solve, you can correct them and rerun the original trace definition. If you are still having problems, you will need to reanalyze the trace data or look at other areas that may be causing problems. Keep in mind that you may need to specify different events to capture in the subsequent trace.
Traces that you want to replay must contain a minimum set of events and data columns. If the trace does not contain the necessary elements, you will not be able to replay the trace. The required elements are in addition to any other elements that you want to monitor or display with traces. You must capture the following events in order to allow a trace to be replayed and analyzed correctly:
Connect
CursorExecute (required only when replaying server-side cursors)
CursorOpen (required only when replaying server-side cursors)
CursorPrepare (required only when replaying server-side cursors)
Disconnect
Exec Prepared SQL (required only when replaying server-side prepared SQL statements)
ExistingConnection
Prepare SQL (required only when replaying server-side prepared SQL statements)
RPC:OutputParameter
RPC:Starting
SQL:BatchStarting
You must capture the following data columns to allow a trace to be replayed and analyzed correctly:
You can replay a trace on a server other than the server originally traced. When you replay a trace on another server, this server is called the target system. To replay traces on the target, you should ensure that all logins contained in the trace:
Are created on the target system and are in the same database as the source system.
Have the same permissions they had originally.
Have the same passwords they had originally.
Are set to use a default database that matches the database on the source system.
If these settings are not the same, you will see errors, but the replay operation will continue. Also, database IDs on the target system must be the same as those on the source system. The easiest way to set up databases on the target is to complete the following steps:
Back up the master database on the source and any user databases used in the trace.
Restore the databases on the target as explained in the subsection titled "Restoring a Database to a Different Location" in Chapter 14.
Replaying a trace allows you to analyze problems. To begin, start Profiler, and then select the Open Trace File or Open Trace Table button, as appropriate for the type of trace you want to replay. After you select the trace to replay, the trace is then loaded into the Profiler window. Events and commands recorded in the trace are summarized in the Profiler window, as shown in Figure 13-15. You can select an entry to see an expanded list of commands executed.

As Figure 13-15 also shows, the toolbar in the replay window differs from the standard toolbar. The buttons provide just about everything that you need to debug traces, including:
Start Replay. Starts executing the trace.
Pause Replay. Pauses execution of the trace.
Stop Replay. Stops execution of the trace.
Execute One Step. Allows you to move through the trace one step at a time.
Run To Cursor. Allows you to move through the trace using cursor sets.
Toggle Breakpoint. Allows you to set breakpoints for the trace execution.
When you start the replay, you will need to connect to the server, and then the initial dialog box displays to configure replay options (see Figure 13-16). You configure the options in the Replay Configuration dialog box to control where and how the playback takes place. Start by setting the destination server for the replay operation. By default, the replace server is set to the current (local) server. Click Change to use a different replay server, and then set replay options.

The replay options determine how closely the replay mirrors the original event execution. You can choose from the following options in the dialog box:
Replay Events In The Order They Were Traced. Events are started in the order in which they originally started. This enables debugging but it does not guarantee timing of event execution. Events may be executed sooner than their original start time or after their original start time, depending on current activity levels, the current speed of connections, and other factors.
Replay Events Using Multiple Threads. Events are replayed as quickly as they can be processed. No timing is maintained between events. When one event completes, the next event is started. This optimizes performance and disables debugging.
The Display Replay Results check box controls whether or not the replay results are displayed in the Profiler window. To display results, select this option. Otherwise, clear this option.
You can also select an output file to save the result of the replay for later viewing. The output file allows you to review the replay just as you would any other trace file.