Windows Performance Monitor is the tool of choice for monitoring SQL Server performance. Performance Monitor graphically displays statistics for the set of performance parameters you select. These performance parameters are referred to as counters.
When you install SQL Server on a system, Performance Monitor is updated with a set of counters for tracking SQL Server performance parameters. These counters also can be updated when you install services and add-ons for SQL Server. For example, when you configure replication on a server, the Replication Monitor is added and made available through SQL Server Management Studio, and Performance Monitor is again updated with a set of objects and counters for tracking replication performance.
Performance Monitor creates a graph depicting the various counters you are tracking. You can configure the update interval for this graph, but it is set to three seconds by default. As you will see when you work with Performance Monitor, the tracking information is most valuable when you record the information in a log file and when you configure alerts to send messages when certain events occur or when certain thresholds are reached, such as when a database log file gets close to running out of free space.
The following subsections examine the procedures you will use with Performance Monitor.
Performance Monitor displays information only for counters you are tracking. More than one hundred SQL Server counters are available—and if you have configured replication, you can use even more counters. These counters are organized into object groupings. For example, all lock-related counters are associated with the SQLServer:Locks object.
To select which counters you want to monitor, complete the following steps:
Access the Performance console by clicking Start | Programs or All Programs | Administrative Tools | Performance.
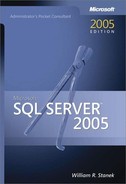
Select the System Monitor entry in the left pane, as shown in Figure 13-6. Any default counters are shown in the lower portion of the Performance Monitor window. To delete a default counter, click its entry in the Performance Monitor window, and then press the Delete key.
Performance Monitor has several viewing modes. Make sure you are in View Current Activity and View Graph display mode by clicking the View Current Activity and View Graph buttons on the Performance Monitor toolbar. Alternatively, you can press Ctrl+T and then Ctrl+G.
To add counters, click the Add button on the toolbar, or press Ctrl+I. This displays the Add Counters dialog box shown in Figure 13-7. Use the options and boxes in the dialog box to configure the counters as follows:
Use Local Computer Counters. Configures performance options for the local computer.
Select Counters From Computer. Enters the UNC (Uniform Naming Convention) name of the SQL Server you want to work with, such as \ZETA.
Performance Object. Selects the type of object you want to work with, such as SQLServer:Locks.
Select Counters From List. Selects one or more counters for the current object. For example, you could select Lock Requests/sec, Lock Timeouts/sec, and Number of Deadlocks/sec.
All Instances. Selects all counter instances for monitoring.
Select Instances From List. Selects one or more counter instances to monitor. For example, you could select instances of the Lock Requests/sec counter for Database, Extent, and Page.
When you have selected all the necessary options, click Add to add the counters to the chart. Repeat this process to add other performance parameters.
Click Close when you are finished.


You can use performance logs to track the performance of SQL Server, and you can replay them at a later date. As you begin to work with logs, remember that the parameters you track in log files are recorded separately from the parameters you are charting in the Performance Monitor window. You can configure log files to update counter data automatically or manually. With automatic logging, a snapshot of key parameters is recorded at specific time intervals, such as every 10 seconds. With manual logging, you determine when snapshots are created. Two types of performance logs are available:
Counter Logs. Record performance data on the selected counters when a predetermined update interval has elapsed.
Trace Logs. Record performance data whenever related events occur.
To create and manage performance logging, complete the following steps:
Access the Performance console by clicking Start | Programs or All Programs | Administrative Tools | Performance.
Expand the Performance Logs And Alerts node. If you want to configure a counter log, select Counter Logs. Otherwise, select Trace Logs.
As shown in Figure 13-8, you will see a list of current logs (if any) in the right pane. A green log symbol next to the log name indicates that logging is active. A red log symbol indicates that logging is stopped.
You can create a new log by right-clicking in the right pane and choosing New Log Settings from the shortcut menu. A New Log Settings box appears. You must provide a name to the new log settings. Type a descriptive name, and then click OK. You will then be able to configure logging using a properties dialog box.
You can manage an existing log by right-clicking its entry in the right pane and then selecting one of the following options:
Start. To activate logging
Stop. To halt logging
Delete. To delete the log
Properties. To display the Log Properties dialog box

Counter logs record performance data on the selected counters at a specific sample interval. For example, you could sample performance data for the CPU every 15 minutes. To create a counter log, complete the following steps:
Select Counter Logs in the left pane of the Performance console, and then right-click in the right pane to display the shortcut menu. Choose New Log Settings.
In the New Log Settings dialog box, type a name for the log, such as SQL Server Locks Monitor or SQL Server Memory Monitor. Click OK. This opens a properties dialog box.
To add all counters for specific performance objects, click Add Objects, and then use the Add Object dialog box to select the objects you want to add. All counters for these objects will be logged.
To add specific counters for objects, click Add Counters, and then use the Add Counters dialog box to select the counters you want to add.
In the Sample Data Every box, type a sample interval value and select a time unit in seconds, minutes, hours, or days. The sample interval specifies when new data will be collected. For example, if you sample every 15 minutes, the log is updated every 15 minutes.
In the Run As text box, type the name of the account under which the counter log will run, and then click Set Password. After you type the password for the account and confirm the password, click OK to close the Set Password dialog box. To run the log under the default system account, Run As should be set to <Default>.
Click the Log Files tab to display the dialog box shown in Figure 13-9. By default, counter logs are saved as sequentially numbered binary files in the %SystemDrive%PerfLogs directory. You can change the log file defaults using the following options:
Log File Type. Changes the default log type. Text File (Comma Delimited) creates a log file with comma-separated entries. Text File (Tab Delimited) creates a log file with tab-separated entries. Binary File creates a binary file that Performance Monitor can read. Binary Circular File creates a binary file that overwrites old data with new data when the file reaches a specified size limit. SQL Database writes the performance data to a SQL database file.
End File Names With. Sets an automatic suffix for each new file created when you run the counter log. Logs can have a numeric suffix or a suffix in a specific date format.
Start Numbering At. Sets the first serial number for a log that uses an automatic numeric suffix.
Comment. Sets an optional description of the log, which is displayed in the Comment column.
Overwrite Existing Log File. Select this option to overwrite any existing log file with the same name.
After you set the log file type, click Configure to configure the log file location. If you selected SQL Database as the file type, use the Configure SQL Logs dialog box to select a previously configured system data source name (DSN). The DSN is used to establish a connection to a SQL-compliant database. If you selected another file type, you will be able to set the log file name and folder location. Using either selection, you have the option of limiting the log file size to a specific value. Click OK, and if prompted to create the log folder, click Yes.
Click the Schedule tab, shown in Figure 13-10, and then specify when logging should start and stop. You can configure the logging to start manually or automatically at a specific date. Select the appropriate option and then specify a start date if necessary.
You can configure the log file to stop manually after a specified period of time, such as seven days; at a specific date and time; or when the log file is full (if you have set a specific file size limit). When a log file closes, you can start a new log file or run a command automatically.
Click OK when you have finished setting the logging schedule. Then the log will be created, and you can manage it as explained in the subsection titled "Creating and Managing Performance Logging" earlier in this chapter.


Trace logs record performance data whenever events related to their source providers occur. A source provider is an application or operating system service that has traceable events.
To create a trace log, complete the following steps:
Right-click Trace Logs in the left pane of the Performance console, and then choose New Log Settings.
In the New Log Settings dialog box, type a name for the log, such as Database Locks Trace or SQL Server Trace. Then click OK. This opens the SQL Trace dialog box shown in Figure 13-11.
If you want to trace operating system events, select the Events Logged By System Provider option button. As shown in Figure 13-11, you can now select system events to trace.
If you want to trace another provider, select the Nonsystem Providers option button, and then click Add. This displays the Add Nonsystem Providers dialog box, which you use to select the provider to trace, such as MSSQLServer Trace.
In the Run As text box, type the name of the account under which the counter log will run, and then click Set Password. After you type the password for the account and confirm the password, click OK to close the Set Password dialog box. To run the log under the default system account, Run As should be set to <Default>.
When you are finished selecting providers and events to trace, select the Log Files tab in the dialog box. You can now configure the trace file as explained in steps 7 and 8 in the subsection titled "Creating Counter Logs" earlier in this chapter. The only difference is in the log file available. There are two types of trace log types:
Sequential Trace File. Writes events to the trace log sequentially up to the maximum file size (if any).
Circular Trace File. Overwrites old data with new data when the file reaches a specified size limit.
Choose the Schedule tab, and then specify when tracing starts and stops, as discussed in the subsection titled "Creating Counter Logs" earlier in the chapter.
You can configure the logging to start manually or automatically at a specific date. Select the appropriate option, and then specify a start date, if necessary.
You can configure the log file to stop manually, after a specified period of time (such as seven days), at a specific date and time, or when the log file is full (if you have set a specific file size limit). When a log file closes, you can start a new log file or run a command automatically as well.
When you have finished setting the logging schedule, click OK. The log is then created, and you can manage it as explained in the subsection titled "Creating and Managing Performance Logging" earlier in this chapter.

When you are troubleshooting problems, you will often want to log performance data over an extended period of time and analyze the data later. To do this, complete the following steps:
Configure automatic logging as described in the section titled "Creating and Managing Performance Monitor Logs" earlier in this chapter.
In Performance Monitor, select the System Monitor entry from the left pane, and then right-click the System Monitor details pane.
Select Properties from the shortcut menu to open the System Monitor Properties dialog box.
Click the Source tab. You can now configure the source:
If you logged the data to a file, click Log Files, and then click Add to open the Select Log File dialog box. You can now select the log file you want to analyze.
If you logged the data to a database, click Database and then select a previously configured system data source name (DSN). The DSN is used to connect to a specific database. Select the set of log records for the database selected.
Specify the time window that you want to analyze. Click Time Range, and then drag the Total Range bar to specify the appropriate starting and ending times. Drag the left edge to the right to move up the start time. Drag the right edge to the left to move down the end time.
Select the Data tab. You can now select counters to view. Click the Add button. This displays the Add Counter dialog box, which you can use to select the counters that you want to analyze.
Click OK. Then in System Monitor, use the View Graph, View Histogram, and View Report buttons on the toolbar to display information based on the counters selected.
You can configure alerts to notify you when certain events occur or when certain performance thresholds are reached. You can send these alerts as network messages and as events that are logged in the application event log. You also can configure alerts to start applications and performance logs.
To add alerts in Performance Monitor, complete the following steps:
Right-click Alerts in the left pane of the Performance console, and then choose New Alert Settings.
In the New Alert Settings dialog box, type a name for the alert, such as Database Alert or SQL Server Locks Alert. Then click OK. This opens the dialog box shown in Figure 13-12.
In the General tab, type an optional description of the alert. Then click Add to display the Add Counters dialog box.
Use the Add Counters dialog box to add counters that trigger the alert. Click Close when you are finished.
In the Counters panel, select the first counter, and then use the Alert When Value Is box to set the occasion that will trigger an alert for this counter. Alerts can be triggered when the counter is over or under a specific value. Select Over or Under, and then set the trigger value. The unit of measurement is whatever makes sense for the currently selected counter(s). For example, to trigger an alert if processor time is over 95 percent, you would select Over, and then type 95 in the Limit text box. Repeat this process to configure other counters you have selected.
In the Sample Data Every text box, type in a sample interval and select a time unit in seconds, minutes, hours, or days. The sample interval specifies when new data is collected. For example, if you sample every 10 minutes, the log is updated every 10 minutes.
In the Run As text box, type the name of the account under which the counte log will run, and then click Set Password. After you type the password for the account and then confirm the password, click OK to close the Set Password dialog box. To run alert logging under the default system account, Run As should be set to <Default>.
Select the Action tab, shown in Figure 13-13. You can now specify any of the following actions to happen when an alert is triggered:
Log An Entry In The Application Event Log. Creates log entries for alerts.
Send A Network Message To. Sends a network message to the computer specified.
Start Performance Data Log. Sets a counter log to start when an alert occurs.
Run This Program. Sets the complete file path of a program or batch file script to run when the alert occurs.
Tip
Alerts can be configured to run executable programs with the .exe extension and batch files with the .bat or .cmd extension when an alert is triggered. Be sure to type the full path to the program or batch file you want to run. The Run This Program text box will accept only valid file paths. If you enter an invalid file path, you will see a warning indicating that the path is invalid when you click OK or try to access another tab. To pass arguments to an executable or batch file application, use the options in the Command Line Arguments panel. Normally, arguments are passed as individual strings. However, if you select Single Argument String, the arguments are passed in a comma-separated list within a single string. The Example Command Line Arguments drop-down list shows how the arguments would be passed.
Choose the Schedule tab, and then specify when alerting starts and stops. For example, you could configure the alerts to start on a Friday evening and stop on Monday morning. Then each time an alert occurs during this period, the specified action(s) are executed.
You can configure alerts to start manually or automatically at a specific date. Select the appropriate option, and then specify a start date, if necessary.
You can configure alerts to stop manually or automatically after a specified period of time, such as seven days, or at a specific date and time.
When you have finished setting the alert schedule, click OK to create the alert. Then you can manage the alert in much the same way that you manage counter and trace logs.

