Chapter at a Glance

Microsoft Dynamics CRM enables you to collect large amounts of data and provides tools that you can use to easily search through the data and find the records you need. In addition, the software offers several different reporting options that empower you to make business decisions based on the data within the reports. Often you might find yourself digging into data in unpredictable ways as you drill into a problem or opportunity and interact with the data. For example, you might answer one question but come up with another and therefore want to dig more deeply. Microsoft Dynamics CRM provides several tools for interacting with the data; two of the simplest are filters and charts.
In this chapter, you will learn how to drill into your data by using the filter and chart tools.
Important
The images used in this book reflect the default form and field names in Microsoft Dynamics CRM. Because the software offers extensive customization capabilities, it’s possible that some of the record types or fields have been relabeled in your Microsoft Dynamics CRM environment. If you cannot find the forms, fields, or security roles referred to in this book, contact your system administrator for assistance.
Important
You must know the location of your Microsoft Dynamics CRM website to work the exercises in this book. Check with your system administrator to verify the web address if you don’t know it.
In Chapter 17, you will learn how to use Microsoft Excel as a reporting tool for Microsoft Dynamics CRM data. In addition to using Excel for reporting, it is common for users of business applications to export data to Excel to filter the data and scrutinize a subset of the records. With Microsoft Dynamics CRM, you can filter your records in real time to zero in on the most important data in your system with a few clicks of the mouse, without leaving the Microsoft Dynamics CRM application.
In this exercise, you will use a filter to view the opportunities that have an estimated close date in the current year and that have a probability associated with them.
Note
SET UP Use the Windows Internet Explorer web browser to navigate to your Microsoft Dynamics CRM website before beginning this exercise.
In the Sales area, click Opportunities.
In the view selector, select Open Opportunities.
The list of Open Opportunities is displayed.
 On the Opportunities tab of the ribbon, in the Data group, click the Filter button.
Filter arrows appear in the grid column headers.
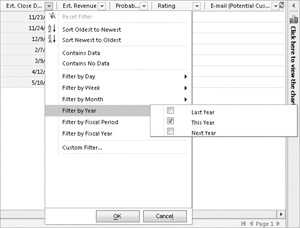
Click the arrow to the right of the Est. Close Date field, select Filter by Year, and then select the This Year check box.
Click OK on the filter menu.
The updated results will reflect all opportunities that will be closing this year.
Click the arrow to the right of the Probability field and select Contains Data.
This will further filter the data to show opportunities that are closing this year and that have a probability recorded.
 On the View
tab of the ribbon, click the Save
As button to save your view.
On the View
tab of the ribbon, click the Save
As button to save your view.In the Name field, enter Opportunities Projected to Close This Year, and then click OK.
The filtered view is saved as a personal view in Microsoft Dynamics CRM.


Over time, you will undoubtedly create additional views of filtered data to support your changing needs. You might find that the filters you applied to a view need to be refined to meet your needs or to provide a more accurate view of your data. In the example in the previous section, you might have noticed that one of the opportunities in the view has a rating of Cold. Because the probability of the opportunity is very low, you would probably want to remove it from your Opportunities Projected To Close This Year view.
In this exercise, you will set additional filters on a previously saved view.
Note
SET UP Use the Internet Explorer web browser to navigate to your Microsoft Dynamics CRM website, if necessary, before beginning this exercise. You need the Opportunities Projected To Close This Year view you created and saved in the previous exercise.
In the Sales area, click Opportunities.
In the view selector, select Opportunities Projected to Close This Year.
The view you saved in the previous exercise is displayed.
Click the arrow to the right of the Rating field, and select the Hot check box. You may need to scroll to the right to see the Rating field.
Click OK. The subset of data is now displayed.
 On the View
tab of the ribbon, click the Save
Filters button.
On the View
tab of the ribbon, click the Save
Filters button.The additional filter has been applied to your previously saved view.


In Chapter 15, and Chapter 17, you will learn how to create reports with Microsoft Dynamics CRM data by using the Report Wizard and Excel tools. These tools allow you to create visually appealing reports by using chart controls within the respective tools. These are great options, but they require you to leave the area of the system you are working on and enter a different application. In addition to these options, Microsoft Dynamics CRM allows you to create and view charts within the application.
Consider the following scenarios:
A sales manager is evaluating sales trends for the current quarter. She filters opportunities to see those owned by a subset of sales representatives. The sales manager wants to quickly get aggregate values for all opportunities for those sales representatives.
A marketing manager would like to execute a lead generation campaign. He has limited resources and would like to target the campaign to geographies that have the most current customers.
You can easily view this information by using charts in Microsoft Dynamics CRM. You will find that many of your chart needs are covered by the 52 charts that Microsoft Dynamics CRM comes with, shown in the following table.
Entity | Charts | |
|---|---|---|
Account | Accounts By Industry Accounts By Owner | Accounts By Territories New Accounts By Month |
Activity | Activities By Month Due Activities By Owner Activities By Owner and Priority | Activities By Priority Activities By Type Activities By Type and Priority |
Article | Articles By Status | |
Campaign | Campaign Budget vs. Actual Costs (By Fiscal) Campaign Budget vs. Actual Costs (by Month) | Campaign Type Mix |
Case | Case Mix (By Business Unit) Case Mix (By Origin) Case Mix (By Priority) Case Mix (By Type) Case Resolution Trend (By Day) | Cases By Origin (By Day) Cases By Priority (Per Day) Cases By Priority (Per Owner) Resolved Case Satisfaction Service Leaderboard |
Goal | Percentage Achieved Goal Progress (Count) Goal Progress (Money) | Today’s Target vs. Actuals (Count) Today’s Target vs. Actuals (Money) |
Lead | Incoming Lead Analysis By Month Lead Generation Rate Leads By Owner | Leads By Rating Leads By Source Leads By Source Campaign |
Opportunity | Actual Revenue by Fiscal Period Actual Revenue by Month Deals Won vs. Deals Lost Deals Won vs. Deals Lost By Fiscal Period Deals Won vs. Deals Lost By Owner Estimated vs. Actual Revenue (By Fiscal) Estimated vs. Actual Revenue (by Month) | Opportunity By Campaigns Revenue Generated By Campaign Sales Leaderboard Sales Pipeline Sales Progress By Territory Top Customers Top Opportunities |
Order | Actual Revenues By Fiscal Period Actual Revenues By Month | Actual Revenues By Owner |
In this exercise, you will view charts within Microsoft Dynamics CRM.
Note
SET UP Use the Internet Explorer web browser to navigate to your Microsoft Dynamics CRM website, if necessary, before beginning this exercise.
In the Sales area, click Opportunities.
The Opportunities grid view appears.
In the view selector, select Closed Opportunities.
 In the Layout group, click the Chart Pane button, and then select Right.
In the chart view list, select Top Customers.
The Top Customers chart displays data from the Closed Opportunities view.
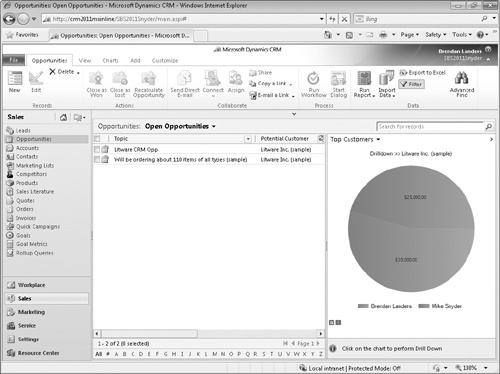
In the view selector, select Open Opportunities.
The same chart is displayed, but it is updated to show open opportunities.
In the Top Customers chart, click the potential customer Litware Inc. bar.
Important
If you do not have Litware Inc. as a potential customer for an opportunity, click a different potential customer, preferably one with multiple open opportunities.
The grid list is filtered to show the open opportunities for Litware Inc., and a drilldown menu appears.
In the Select Field list on the drilldown menu, select Owner.

 Click the Pie
Chart icon, and then click the Results arrow.
Click the Pie
Chart icon, and then click the Results arrow.A pie chart appears, showing the estimated revenue of the Litware Inc. opportunities by opportunity owner.
Click one of the pie chart sections.
The grid updates with the records specific to the section you clicked.


You now understand the power of the built-in charts that come with Microsoft Dynamics CRM. In addition to the charts provided by the application, you can create your own charts to support your unique needs. You can create charts for custom entities as well as for the entities included with Microsoft Dynamics CRM, as shown in the following list.
Entities Available for Chart Use
Account |
Activity |
Appointment |
Article |
Campaign |
Campaign Activity |
Campaign Response |
Case |
Competitor |
Connection |
Contact |
Contract |
Fax |
Goal |
Goal Metric |
Invoice |
Invoice Product |
Lead |
Letter |
Marketing List |
Opportunity |
Opportunity Product |
Order |
Order Product |
Phone Call |
Price List |
Product |
Queue Item |
Quick Campaign |
Quote |
Quote Product |
Recurring Appointment |
Report |
Rollup Query |
Sales Literature |
Service |
Service Activity |
Task |
Team |
Territory |
Unit Group |
User |
In this exercise, you will create a custom chart within Microsoft Dynamics CRM.
Note
SET UP Use the Internet Explorer web browser to navigate to your Microsoft Dynamics CRM website, if necessary, before beginning this exercise.
In the Sales area, click Accounts.
The Accounts grid view appears.
In the view selector, select Active Accounts.
 On the ribbon, click the Charts tab, and then click the New Chart button.
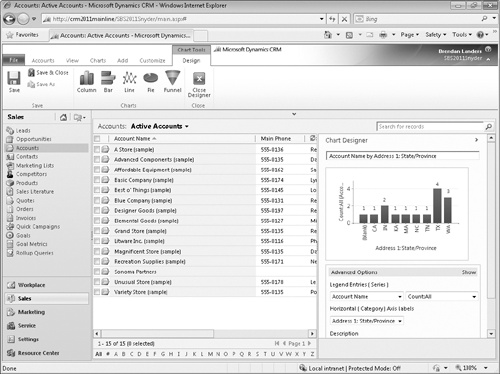
In the Legend Entries (Series) area, select Account Name in the Select Field list.
In the Horizontal (Category) Axis Labels area, select Address 1: State/Province.
You will see that the chart has been given a title of Account Name by Address 1: State/Province.
Update the chart title to Accounts by State.
In the Description field, enter Show a Count of Accounts by State.
 On the Chart Tools
Design tab of the ribbon, click the Bar button to change the chart to a bar chart.
On the Chart Tools
Design tab of the ribbon, click the Bar button to change the chart to a bar chart.
 On the ribbon, click the Save button to save the chart, and then click the Close Designer button.
Your chart is now available in the list of available charts.


It’s likely that the reports and charts you create will also be useful to your colleagues. Rather than trying to articulate the steps it took for you to create a chart, you can share the Chart with other users in Microsoft Dynamics CRM. Typically, a sales manager or other advanced user creates a chart that will be valuable to other team members. These shared charts allow users of all computer skill levels to solve business-critical reporting needs.
In this exercise, you will share a custom chart with another Microsoft Dynamics CRM user.
Note
SET UP Use the Internet Explorer web browser to navigate to your Microsoft Dynamics CRM website, if necessary, before beginning this exercise. You need the Accounts By State chart you saved in the previous exercise.
In the Sales area, click Accounts.
On the ribbon, click the Charts tab. Then click the Chart Pane button and select Right.
In the Chart View list, select Accounts by State.
The Accounts By State chart you created in the previous exercise appears.
 On the Charts tab of the ribbon, in the Collaborate group, click the Share button.
The Who Would You Like To Share The Selected User Chart With? dialog box appears.
Click Add User/Team.
In the Look Up Records dialog box, select a colleague to share the chart with, click the Add button, and then click OK.
Click OK to exit the Who would you like to share the selected user chart with? dialog box.
Your chart is now shared with the selected colleague and will appear in his or her chart list.


Note
See Also For more information on record sharing, see Chapter 16.
You can use filters on any list of records to help analyze your data.
Charts are available to provide inline real-time reporting.
You can interact with charts and drill through to obtain the necessary details.
Charts work in conjunction with lists of records; as you drill into a chart, the list of records will update and, conversely, as you change the view, the chart will update.
Although Microsoft Dynamics CRM comes with many charts, you can also easily create new charts to support your specific reporting needs.
You can share charts with your colleagues as needed so that they can benefit from the reports you’ve built.